Risk Analysis Under Uncertainty, Subjectivity, and Incomplete Knowledge: With a Use Case of Energy System Failures
ABSTRACT
The reliability of gas turbines is crucial due to their critical applications in energy systems and the increasing complexity of their design and operation. Traditional failure mode and effects analysis (FMEA) methods face significant limitations in handling combined uncertainty under conditions of ambiguity and partial information. Although widely used, fuzzy variations of FMEA naturally fall short in simultaneously addressing both sources of uncertainty: Ambiguity and incomplete knowledge. This study investigates the application of fuzzy-rough FMEA (FR-FMEA) to bridge this gap. By integrating fuzzy logic with rough set theory, FR-FMEA effectively manages uncertainties arising from incomplete knowledge and vagueness in expert judgment, providing a more reliable framework for risk prioritization. A case study on a gas turbine demonstrates the application of the proposed method. The results show that FR-FMEA provides distinct and reliable rankings, reducing clustering while aligning more closely with conventional RPN rankings. Key components such as the combustion chamber, fuel nozzle, and turbine rotor were consistently identified as high-risk across methods, emphasizing their criticality for maintenance and design optimization. Moreover, the results are also compared with conventional FMEA and Fuzzy-FMEA to highlight the differences.
1 Introduction
Gas turbines are widely used in the aviation industry, powering helicopter lift systems, certain commercial aircraft, and military jets and serving as propulsion systems for various types of ships. In particular, gas turbines are reliable power sources in aviation, especially due to their superior power-to-weight ratio driven by higher efficiency and lighter construction. Therefore, their reliability engineering and failure analysis are indispensable in ensuring performance and safety, considering that most of their applications are safety critical.
As turbomachinery evolves toward new-generation designs and optimizations [1], incorporating advancements in materials and manufacturing [2], optimal combinations of pressure, temperature, and density [3], and more complex control systems [4], incomplete knowledge becomes more prevalent due to the complexity of these advancements and the difficulty in gathering comprehensive data. Failure mode and effects analysis (FMEA) is crucial for turbomachinery as it systematically identifies potential failure modes and their impacts [5]. Rough FMEA enhances this process by managing the uncertainty from incomplete knowledge, leading to more robust failure analysis and improved reliability of turbomachinery systems. On the other hand, fuzzy FMEA helps deal with the ambiguity inherent in human judgment for ranking failures. The current study is focused on combining these two approaches to enhance FMEA-related decision-making.
-
Hypothesis 1 about handling ambiguity, vagueness, and incomplete knowledge: FR-FMEA identifies essential attributes influencing the decision process, reducing all kinds of uncertainty.
Research Question 1: How can fuzzy set and rough set methodologies be integrated with FMEA to achieve a new method to address all types of uncertainties?
- Hypothesis 2 about application: Fuzzy rough set theory (FRST) can classify and analyze data in FMEA even when boundaries between classes are not sharply defined and the knowledge is incomplete. Research Question 1: How can the FRST-based FMEA (FR-FMEA) be implemented in identifying critical failure modes with imprecise or incomplete data in a case study of turbomachinery?
The findings of this study offer significant contributions to the risk and reliability research community in two key areas. First, the proposed FR-FMEA enhances the reliability of turbomachinery by improving the design, manufacturing, and maintenance processes. Second, we introduce Fuzzy Rough Set numbers for FMEA, accompanied by a practical implementation example.
These results empower designers to identify potential failure modes early in the design phase, even when available information is incomplete or subjective judgment introduces ambiguity. This leads to better material selection and more informed structural decisions. In the manufacturing of turbomachinery, the FR-FMEA approach helps optimize processes by predicting failure risks despite data limitations, ultimately improving quality control. For operational components, it supports real-time evaluation and adjustments enhancing system reliability [6], enables proactive maintenance and reducing downtime.
2 Identified Gap and Proposed Solution
Conventional FMEA assigns severity, occurrence, and detection ratings based on expert judgment [7], making the process often subjective [8]. In the real-world systems, these parameters are frequently uncertain and based on assumptions or historical data that may no longer be applicable. The conventional methods in failure analysis (including FMEA) assume the system is well understood and that all possible failure modes and their effects are known [9-11]. However, in early design stages or emerging technologies, knowledge is often incomplete or evolving. Several studies have addressed these uncertainties in complex, nonlinear, and emerging technologies [12, 13], implementing probabilistic and risk-based approaches instead of assigning precise values in failure analysis [14-18].
This highlights that, when FMEA relies on expert judgment, the analysis may be influenced by a lack of experience or insufficient historical data. As a result, this leads to unreliable assumptions about complete knowledge of all failure modes and depends on assigning precise values using crisp numbers, while ignoring probabilistic reasoning. Consequently, the method faces several limitations when dealing with uncertainty, incomplete knowledge, and subjectivity.
In the context of multicriteria analysis (MCA), various mathematical strategies have been proposed to manage the inherent uncertainty and subjectivity present in real-world scenarios. Table 1 presents a comparison of eight such strategies, extracted from the literature and evaluated based on their ability to represent uncertainty and manipulate subjective information. These include crisp numbers, fuzzy sets, -numbers, cloud models, weighted aggregated operators (WAOs), rough numbers, fuzzy rough numbers, and rough fuzzy numbers.
| Strategies | Uncertainty representation | Subjectivity manipulation |
|---|---|---|
| Crisp numbers | No | No |
| Fuzzy sets | Yes | No |
| -numbers | Yes | No |
| Cloud model | Yes | No |
| WAOs | No | Partially |
| Rough numbers | No | Yes |
| Fuzzy rough numbers | Yes | Yes |
| Rough fuzzy numbers | Yes | Yes |
Crisp numbers are the most basic approach, relying on exact values without incorporating any form of uncertainty. Their simplicity and computational efficiency make them useful for straightforward problems; however, they fail to capture any vagueness or personal judgment, limiting their applicability in complex decision-making environments. Fuzzy sets extend this by allowing partial membership through membership functions, effectively handling vagueness and linguistic information. Nevertheless, they do not explicitly model subjectivity, particularly the variability of human judgment.
-numbers build upon fuzzy sets by introducing a second fuzzy component that expresses the reliability of the primary information. This dual structure offers a more nuanced way to model uncertainty, yet it still lacks the depth required to fully capture personal or contextual subjectivity. Similarly, the cloud model attempts to blend fuzziness with randomness, offering a more holistic view of uncertainty. Despite this advantage, it remains weak in dealing with subjective variation across decision-makers.
Weighted aggregated operators (WAOs) are aggregation tools that incorporate the relative importance of criteria or opinions through weights. While they can partially account for subjectivity, especially in group decision-making settings, they do not provide a formal mechanism for modeling uncertainty. Rough numbers, on the other hand, excel at expressing subjectivity through lower and upper bounds—essentially representing a range of possible values. However, they fall short when it comes to capturing uncertainty due to fuzziness or ambiguity.
To overcome these limitations, fuzzy rough numbers and rough fuzzy numbers have been developed as hybrid models. Fuzzy rough sets combine fuzzy sets and rough numbers to handle both uncertainty and subjectivity in a balanced way. In this study, fuzzy rough numbers are selected as the primary approach due to their more established theoretical foundation and successful application in previous risk-based MCA. Future research will focus on exploring the potential of rough fuzzy numbers, aiming to expand their practical usage and refine their application within different frameworks.
A general search without applying any strict filters revealed only eight documents related to fuzzy rough and rough fuzzy methods in FMEA (Table 2).
| Title | Year | References |
|---|---|---|
| A hybrid decision-making technique based on extended entropy and trapezoidal fuzzy rough number | 2024 | [19] |
| Ranking failure modes with pythagorean fuzzy rough VIKOR approach | 2024 | [20] |
| A Vague Rough Set Approach for Failure Mode and Effect Analysis in Medical Accident | 2023 | [21] |
| A novel FMEA approach for submarine pipeline risk analysis based on IVIFRN and ExpTODIM-PROMETHEE-II | 2023 | [22] |
| A fuzzy rough number extended AHP and VIKOR for failure mode and effects analysis under uncertainty | 2022 | [23] |
| Risk evaluation model for failure mode and effect analysis using intuitionistic fuzzy rough number approach | 2021 | [24] |
| Improved failure mode and effect analysis with interval-valued intuitionistic fuzzy rough number theory | 2020 | [25] |
| Fuzzy rough FMEA evaluation method based on hybrid multiattribute decision and correlative analysis | 2016 | [26] |
This limited number of publications indicates a significant research gap in the field. Notably, half of the papers were published in the last two years, highlighting the emerging and novel nature of this research topic. The increasing interest suggests that fuzzy rough sets are becoming trendy frameworks in decision-making models.
Since the use of fuzzy rough sets already addresses the limitations of conventional FMEA based on crisp numbers, there is no need to introduce additional complexity by directly integrating hybrid methods or combining FMEA with full MCDM frameworks. In cases where it is necessary to calculate the weights of criteria, an appropriate MCDM method can be applied independently prior to the FMEA process. Therefore, in this study, we present a use case of fuzzy rough FMEA, which leverages the synergy of fuzzy logic and rough set theory to manage all types of uncertainty, while simultaneously reducing the complexity that often arises in hybrid methods when such complexity is not essential.
This approach offers a more practical and efficient solution for the engineering community, where ease of implementation and clarity are valuable. Meanwhile, the exploration of more complex and integrated methods remains a worthwhile pursuit within the research community, particularly for addressing highly complex decision-making problems that may warrant the full use of hybrid methodologies for more granularity in results.
In the following, three specific engineering problems that can benefit from this improved method are described, with three cutting-edge engineering examples.
2.1 Engineering Example 1: Full Self-Driving (FSD) Systems
Autonomous vehicle systems are composed of sensors (LiDAR, radar, cameras), complex software algorithms, and machine learning models. FMEA struggles because: data from sensors is noisy and conflicting, failure modes are interdependent and nondeterministic, expert assessments (e.g., severity of misdetection) are subjective and since these systems are still in development stage, the experts do not have complete knowledge.
In this condition, Fuzzy Logic models degrees of severity and likelihood (e.g., “high” and “very high”) instead of crisp values; and Rough Sets can categorize failures into approximate boundaries when data is incomplete (e.g., unknown exact probability of failure but categorized as “likely” based on partial data). Since in FSD systems, a misclassification of a pedestrian by the AI can result in vastly different outcomes depending on speed, visibility, and traffic context, the improved prioritization of failure modes under data uncertainty, improves decision-making on which subsystems need fail-safes.
2.2 Engineering Example 2: Renewable Energy Production
Offshore wind turbines operate under uncertain weather and maintenance schedules. FMEA faces challenges due to: stochastic nature of environmental loads, difficulty in modeling degradation over time. In photovoltaic (PV) panels, the challenge becomes even more complex due to the significant influence of environmental parameters—such as synergetic impact of humidity, wind speed, and wind direction—that are often not explicitly captured in conventional physical or mathematical models. However, expert judgments tend to vary widely because these environmental factors introduce nonlinear and context-dependent effects. Over the past decade, AI techniques have been increasingly used to estimate and model the combined impact of these variables, further highlighting the limitations of traditional FMEA approaches with incomplete knowledge of the experts in handling such uncertainties.
In this domain, we consider scenario on wind turbines: blade erosion due to salt spray may accelerate over time depending on unpredictable microclimate effects. This causes difficulty in assigning static failure probabilities. In this condition, Fuzzy Logic allows considering of gradual degradation stages (e.g., “early erosion” and “moderate wear”), whereas Rough Sets can categorize failures into approximate boundaries when data is incomplete (e.g., unknown exact probability of failure but categorized as “likely” based on partial information).
2.3 Engineering Example 3: Safety-Critical Nature in Medical Device and Reliability
Wearables like continuous glucose monitors rely on physiological sensors whose performance depends on user behavior, skin condition, and environment. Sensor failures are difficult to pin down, diverse user conditions cause inconsistent readings, and safety-critical nature means errors must be minimized, even if data is partial.
For example a smart watch heart-rate sensor might falsely detect issue due to tattoo interference or motion.
In this condition, Fuzzy Logic captures subjective evaluations of risk levels; while Rough Sets can group diverse sensor performance outcomes into “safe”, “borderline”, and “alert” regions, even if not all failure mechanisms are fully known.
3 Theoretical Foundation
While the integration of fuzzy set theory with FMEA has been extensively studied and numerous combined methods have been proposed and implemented, the application of rough set theory with Fuzzy FMEA remains underexplored. Combining fuzzy logic and rough set theory to prioritization methods improves the conventional approaches in addressing uncertainties [27-29]. Therefore, this study aims to fill the literature gap and present a novel approach that not only retains the well-established advantages of integrating fuzzy set theory with FMEA for reliable failure analysis but also addresses the challenges posed by uncertainty arising from incomplete knowledge.
A general search in SCOPUS using “fuzzy rough FMEA” as the keyword yields only one article in English (in December 2024), highlighting the significant gap in research on this topic. The identified article focuses on the use of trapezoidal fuzzy rough numbers along with a multicriteria decision-making method to enhance failure analysis and risk prioritization [19] This study, however, will investigate the generation and application of triangular fuzzy rough numbers for FMEA. Additionally, another article, written in Chinese with an abstract available in English, investigates a multicriteria decision-making approach combining the fuzzy rough framework with the VlseKriterijumska Optimizacija-Kompromisno Resenje (VIKOR) model and FMEA [26].
3.1 Theoretical Foundation of Triangular Fuzzy Set
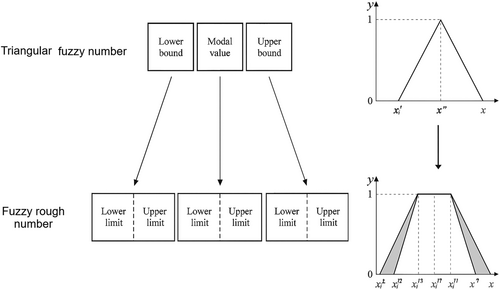
A triangular fuzzy set is a simple and widely used representation of fuzzy sets for handling subjectivity [30], reducing possible defects of individual bias [31], and consistency in evaluation [31], which improves decision-making by accounting for uncertainty and partial truths. It is characterized by a triangular membership function (see Formula (1)) [32] shown in Table 3. The triangular function is defined by three parameters: (lower bound), (mode or peak value), and (upper bound). The membership function, , increases linearly from to and decreases linearly from to . The membership degree ranges between 0 and 1, where the peak value achieves a degree of 1 (see the representation in Figure 1).
| Linguistic term | Fuzzy numbers |
|---|---|
| VL (Very Low) | |
| L (Low) | |
| M (Medium) | |
| H (High) | |
| VH (Very High) |
Triangular fuzzy sets are particularly useful for representing vagueness in qualitative terms such as “low,” “medium,” and “high.” They are computationally efficient and suitable for applications in decision-making, risk assessment, and fuzzy logic-based models.
3.2 Theoretical Foundation of Rough Set
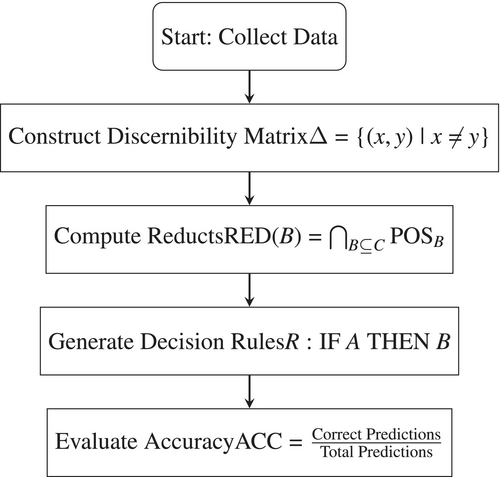
In emerging technologies, incomplete and partial information often arises due to systems' complexity and data collection limitations, posing challenges for accurate failure analysis. The rough set theory offers a powerful tool to address this by handling uncertainty and imprecision, making it ideal for such scenarios [33-35]. Figure 2 outlines the key steps in the rough set theory process [36]. It begins with data collection, followed by constructing the discernibility matrix () to identify differences between objects. Next, reducts are computed () to derive minimal attribute sets. Decision rules () are then generated based on these reducts. Finally, the model's accuracy is evaluated before concluding the process.
Traditional FMEA relies heavily on crisp and subjective input data and identifying the values for severity (S), occurrence (O), and detectability (D), and multiplying the three values to obtain a risk priority number (RPN) [37]. However, RPNs can be inconsistent and ambiguous due to the inherent subjectivity of human judgment. Integrating fuzzy and rough set theories with FMEA, we aim to make the analysis more robust and less sensitive to uncertainty. Therefore, in the current study, we propose a variant of the fuzzy FMEA method integrated with rough set theory to address uncertainty and enhance the robustness of reliability analysis through FMEA.
3.3 Integration of Fuzzy and Rough Theories
Fuzzy and rough theories each have specific capabilities in dealing with uncertainty. Fuzzy theory captures the vagueness and ambiguity in expert reasoning during risk prioritization by representing their judgment through linguistic variables and membership functions. This is particularly crucial when implementing FMEA since it conventionally uses crisp values that may not reflect the true uncertainty in failure assessments [38, 39]. Rough theory, on the other hand, uses boundary regions instead of membership functions to represent uncertainty due to indiscernibility caused by lack of sufficient information [40]. In the implementation of FMEA, rough theory is particularly useful because it takes into account the decision maker's subjective judgment and preference and ensures the accuracy of FMEA ranking results [41].
Integrating fuzzy and rough theories with FMEA overcomes the limitations of traditional RPN by refining the calculation of the RPNs. Rough set theory complements fuzzy logic by managing uncertainty due to incomplete or imprecise information, leading to more nuanced modeling of uncertainty and improved decision-making accuracy [42]. This integration enhances the reliability of risk assessments by incorporating both fuzzy uncertainty (due to subjective expert opinions) and random uncertainty (due to variability in data) [43].
4 Proposed Fuzzy Rough Set-Based FMEA (FR-FMEA) for Turbomachine
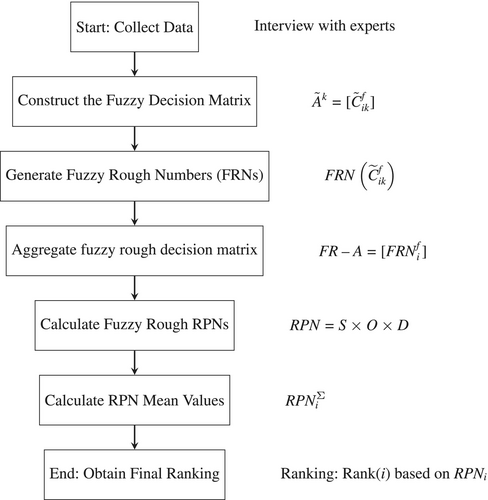
The proposed FR-FMEA involves the following steps, as shown in Figure 3 and explained in detail subsequently.
4.1 Step 1: Data Collection
Data collection is conducted through structured questionnaires. Experts are asked to evaluate failures based on FMEA risk factors: severity (), occurrence (), and detectability (). Each expert selected a linguistic term to describe the risk factors. The linguistic terms are then mapped to triangular fuzzy numbers (TFNs), as shown in Table 3, following the methodology in [44].
4.2 Step 2: Construct the Fuzzy Decision Matrices
4.3 Step 3: Generate FRNs
All collected TFNs are converted into Fuzzy Rough Numbers (FRNs). A TFN is converted into an FRN through the following steps [45]:
4.3.1 Step 3.1: Calculating Lower and Upper Approximations
4.3.2 Step 3.2: Calculating Lower and Upper Limits
4.3.3 Step 3.3: Generating FRNs
4.4 Step 4: Obtain the Aggregate Fuzzy Rough Decision Matrix
4.5 Step 5: Calculating Fuzzy Rough RPNs
4.6 Step 6: Calculating the Mean Value of RPNs
To evaluate the overall importance of each failure, the mean value of , indicated by is calculated using Formula (11):
4.7 Step 7: Ranking
The mean values of RPNs are sorted in ascending order to generate the final ranking of failures.
5 Experimental Case: Gas Turbine
A gas turbine is a type of internal combustion engine that uses rotating equipment machinery to generate power [46]. As shown in Figure 4, it operates by utilizing the energy of hot, high-pressure gases produced from the combustion. Although turbines are broadly used for power generation [47], the rotation of turbines produces thrust for aviation propulsion systems.
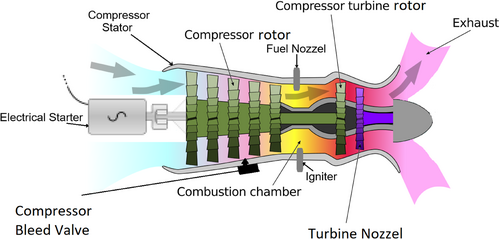
The failure causes and the link to their effects that are used in this study are taken from [48]. Recent studies highlight prevalent failure modes in aerospace engine turbine components, which have significant implications for their service life and overall reliability [49]. Consequently, understanding the causes of these failures and their effects offers valuable insights into areas requiring targeted mitigation, ultimately contributing to enhanced gas turbine reliability. Table 4 presents a classification of failure modes for various components in a gas turbine system, detailing their causes and effects. Each component (the components are shown in Figure 4 including the starter, compressor rotor, turbine rotor, etc.) is associated with specific failure modes that highlight potential operational vulnerabilities. For example, the starter may experience “under-speed” due to induction mechanism failure, resulting in the engine's inability to reach idle speed. Similarly, the compressor rotor's failure modes include “vibration,” caused by defective bearings, leading to structural oscillations and fluctuations in speed indicators.
| Component | Failure mode | Failure cause | Failure effect |
|---|---|---|---|
| Starter | No operation | No electrical power | No engine start- F1 |
| Under-speed | Induction mechanism failure | Engine unable to reach idle speed- F2 | |
| Over-speed | Driveshaft sheared | No engine start and burn of starter windings- F3 | |
| Compressor rotor | Vibration | Defective bearings | Oscillated structure, speed indicator fluctuation- F4 |
| Shaft locked | Rubbing of rotor blades with compressor casing | Engine coast-down lower than limits- F5 | |
| Deformation | Foreign object damage | Vortex creation and stall- F6 | |
| Compressor stator | Stall | Ice formation on engine inlet | - F7 |
| Binding of variable stator vanes | Increase in temperature plus speed indicator hang-up/drop-off- F8 | ||
| Foreign object damage | - F9 | ||
| Compressor bleed valve | Valve stuck open | Low compressor discharge pressure | Slow acceleration- F10 |
| Valve stuck closed | Internal spool failure | Stall during deceleration- F11 | |
| Combustion chamber | Hot spot | Gas temperature exceeding limits | Reduction of combustion efficiency- F12 |
| Gas leakage | Cracking of cases | Reduction of output power- F13 | |
| Fuel nozzle | Flame-out | Nozzle clogs | Drastic reduction of output power- F14 |
| Instability of flame pattern | Irregular fuel-to-air ratio | - F15 | |
| Igniter | Eroded tips | Material removal by excessive discharge | Weak ignition while starting- F16 |
| Turbine rotor | Shaft seized | Rubbing of rotor blades with turbine casing | Reduction of turbine speed- F17 |
| Vibration | Defective bearings | Oscillated structure, speed indicator fluctuation- F18 | |
| Deformation | Improper material and heat treatment | - F19 | |
| Corrosion | Impurities in high-temperature gas | Drastic low power- F20 | |
| Fracture | Loss of coating by thermal and centrifugal stresses | - F21 | |
| Turbine nozzle | Burnt vanes | Gas over-temperature | Turbulence in gas stream- F22 |
5.1 Data Collection for Empirical Study
To calculate rough FMEA, rough-fuzzy FMEA, and fuzzy-rough FMEA, data needs to be collected from domain experts regarding the failure modes, S, O, and D ratings in Table 4. This data will serve as input to the respective FMEA models.
5.1.1 Required Data
According to Chin, Chan, and Yang [50], the risk priority number (RPN) is estimated using three key indexed parameters (S, O, and D). This ranking system provides a quantitative basis for prioritizing failure modes, enabling effective risk management in various engineering applications [50].
- Failure modes: a comprehensive list of potential failure modes associated with the system under investigation.
- S: the potential impact of each failure mode, rated on a predefined scale (e.g., 1–10).
- O: the likelihood of occurrence of each failure mode, rated on a predefined scale (e.g., 1–10).
- D: the likelihood that the failure mode will be detected before causing harm, rated on a predefined scale (e.g., 1–10).
- Expert insights: qualitative and quantitative insights from domain experts to validate and supplement the ratings.
5.1.2 Interviews
- Identifying and validating potential failure modes.
- Assigning ratings for severity, occurrence, and detection for each failure mode.
- Exploring expert opinions on uncertainties in the data, such as imprecise or incomplete information.
Number of experts: a minimum of 3–5 experts is typically sufficient to ensure reliability and validity in studies involving expert judgments [51, 52]. Therefore, we interviewed five experts with diverse backgrounds in the field of Turbomachinery. The interviewee's background shows strong expertise in maintenance, with one expert, two advanced level, and two beginners and significant experience in pumps, fans, and other specialized areas. Overall, the interviewees' design skills are moderate, with some intermediate-level proficiency, while research skills are mostly at a beginner level, except for two risk analysis experts.
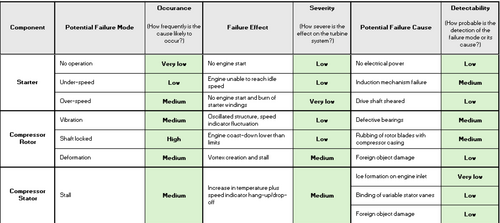
Sample form of the Interview which was in Excel format itself for ranking and description provided to the interviewee to describe the case machine set is shown in the Appendix B, Figure B1 and Figure B2. The interviewees are provided with Table 5 to ensure a consistent reference scale for their evaluations.
| Effect | Severity level | Probability of occurrence | Detection criteria |
|---|---|---|---|
| Very high | When a potential failure mode effects | Very high: failure is almost unavoidable ( in 2) | Controls actions are not available (Not possible) |
| High | System inoperable due to destructive failure | High: repeated failure, A process that has often failed (1 in 8) | Low possibility of noticing the breakdown (Low) |
| Medium | System inoperable with minor or notable failure | Moderate: infrequent failures with little impact (1 in 80) | Low chance of detecting a possible cause and consequent failure mode (Low) |
| Very low | System operable with relatively few failures | Low: relatively few failures are associated with similar processes (1 in 2000) | Reasonably high possibility of noticing the possible reasons for occurrence of breakdown (high) |
| Low | No effect | Remote: failure is implausible (1 in 1,50,000) | Very high probability of noticing the potential reasons for occurrence of breakdown (Very high) |
5.1.3 Ensuring Interview Reliability
The reliability of the interviews is assessed using the Fleiss' Kappa that is an inter-rater reliability method for multiple raters [55-57] and Cronbach's Alpha for level of internal consistency among the experts' evaluations [58].
- is the number of items.
- is the variance of the item.
- is the variance of the total score.
- Fleiss' kappa: approximately 0.0428, indicating slight agreement beyond what would be expected by chance.
- Cronbach's alpha: approximately 0.401, suggesting moderate internal consistency among their evaluations.
When considering the full dataset that includes five experts, the calculated Cronbach's Alpha is approximately 0.338. This lower value reflects a decrease in the overall internal consistency of the evaluations when the contributions of all experts are included. Given this discrepancy, greater weight was assigned to the opinions of the more experienced experts to enhance the reliability and quality of the analysis.
6 Synthesis of Results
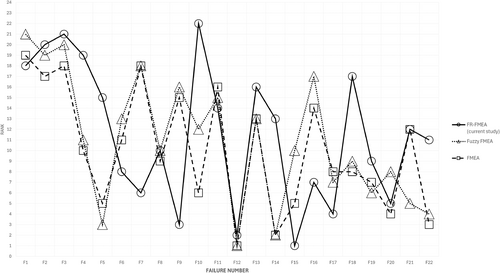
The results of FR-FMEA are shown in Table 6. The FR-FMEA proposed in this study yielded the top five failures as F15, F12, F9, F17, and F20, respectively. Instead, in the study of the same system with Fuzzy FMEA [48], F12, F14, F5, F21, and F22 are the top five failures. Despite the fact that interviewees in this study and the ones in [48], comparing the results of the proposed FR-FMEA from this study with the Fuzzy FMEA and conventional FMEA from their study is insightful because both of these studies evaluated the same case and the same set of failures. This comparison is illustrated in Figure 5.
| Failure N. | Mean value | Final rank |
|---|---|---|
| F15 | 173.72 | 1 |
| F12 | 161.89 | 2 |
| F9 | 145.27 | 3 |
| F17 | 133.49 | 4 |
| F20 | 130.57 | 5 |
| F7 | 129.47 | 6 |
| F16 | 128.47 | 7 |
| F6 | 127.81 | 8 |
| F19 | 124.00 | 9 |
| F8 | 123.80 | 10 |
| F22 | 116.09 | 11 |
| F21 | 109.93 | 12 |
| F14 | 107.99 | 13 |
| F11 | 106.74 | 14 |
| F5 | 105.84 | 15 |
| F13 | 103.41 | 16 |
| F18 | 93.86 | 17 |
| F1 | 88.21 | 18 |
| F4 | 86.81 | 19 |
| F2 | 86.52 | 20 |
| F3 | 82.30 | 21 |
| F10 | 54.60 | 22 |
The first observation is that all three methods highlight the combustion chamber (F12) and fuel nozzle (F14/F15) and the highest risk components. Failure F12 (fuel nozzle) ranks in the top 3 in both methods, highlighting its criticality despite the mentioned differences in methodology and input from experts. This alignment in high-risk components provides insight into critical areas needing attention for maintenance and risk mitigation. On the other hand, the starter component, consisting of FM1, FM2, and FM3, is considered the least risky component in the proposed FR-MEA as well as in the other two types of FMEA. Moreover, the ranks produced by FR-FMEA provide an adequate alignment (the rank difference equal to or less than 3 positions) with those of Fuzzy FMEA and conventional FMEA in 9 of 22 failures (F1, F2, F3, F8, F11, F12, F13, F19, and F20).
On the other hand, While certain components align, others differ significantly between the methods. For example, FR-FMEA assigns Failure F15 the highest rank, whereas it holds a different position in Fuzzy FMEA (rank 10) and conventional FMEA (rank 5). Another example of this misalignment is in F7, where although both Fuzzy FMEA and conventional FMEA produced the same ranks (rank 18), FR-FMEA suggested a significantly higher position for this failure (rank 6). Overall, the ranks produced by FR-FMEA do not adequately align (the rank difference is equal to or more than 5 positions) with those of Fuzzy FMEA and conventional FMEA in 9 of 22 failures (F4, F5, F7, F9, F10, F14, F16, F18, and F22).
Although inference about granularity needs more case studies with the same group of interviewees, FR-FMEA often provides more distinct rankings, reducing the chance of ties or clustering. This distinction is apparent in how intermediate failures are more distributed in the rough fuzzy method. One reason might be that Fuzzy FMEA depends heavily on rules set by experts and predefined parameters. In contrast, FR-FMEA takes a more data-driven approach to overcome the incomplete knowledge of experts.
6.1 Sensitivity Analysis
For the sensitivity analysis of the proposed FR-FMEA, two different evaluations are considered. First, the TFNs used for the linguistic terms Table 3 are replaced with those of [59] and [60]. These two studies were selected because they also use a five-point TFN structure for FMEA risk factors' ranking. Second, the robustness of the proposed FR-FMEA is tested by changing the input of experts in two different scenarios: (1) replacing all inputs of one expert to very high (VH) and (2) replacing all inputs of one expert to very low (VL).
The outcome of the first evaluation is shown in Table 7. As shown in the ranking results, no significant change is seen in the ranking of most failures. The only failures whose ranking has changed drastically are F6 and F10. This shows the acceptable robustness of the results to changes in TFNs.
| Failure N. | Ranks based on TFNs in Table 3 | Ranks based on TFNs in [59] | Ranks based on TFNs in [60] |
|---|---|---|---|
| F1 | 18 | 18 | 18 |
| F2 | 20 | 19 | 20 |
| F3 | 21 | 20 | 21 |
| F4 | 19 | 21 | 19 |
| F5 | 15 | 17 | 13 |
| F6 | 8 | 12 | 4 |
| F7 | 6 | 8 | 6 |
| F8 | 10 | 13 | 7 |
| F9 | 3 | 7 | 3 |
| F10 | 22 | 22 | 22 |
| F11 | 14 | 15 | 12 |
| F12 | 2 | 4 | 2 |
| F13 | 16 | 11 | 15 |
| F14 | 13 | 9 | 14 |
| F15 | 1 | 3 | 1 |
| F16 | 7 | 10 | 5 |
| F17 | 4 | 1 | 10 |
| F18 | 17 | 16 | 17 |
| F19 | 9 | 6 | 9 |
| F20 | 5 | 5 | 8 |
| F21 | 12 | 2 | 16 |
| F22 | 11 | 14 | 11 |
Table 8 shows outcomes of the second evaluation where the experts' inputs are changed. It is observed in the table that there have been some changes in the results, although the significant ones are seen only in four failures (F11, F16, F17, and F20). The relative stability of ranks with respect to drastic changes in one expert's input demonstrates the robustness of results to noise.
| Failure N. | Original ranks | Scenario 1 | Scenario 2 |
|---|---|---|---|
| F1 | 18 | 17 | 18 |
| F2 | 20 | 21 | 20 |
| F3 | 21 | 20 | 21 |
| F4 | 19 | 19 | 19 |
| F5 | 15 | 14 | 11 |
| F6 | 8 | 5 | 5 |
| F7 | 6 | 6 | 6 |
| F8 | 10 | 7 | 10 |
| F9 | 3 | 4 | 4 |
| F10 | 22 | 22 | 22 |
| F11 | 14 | 9 | 9 |
| F12 | 2 | 2 | 2 |
| F13 | 16 | 15 | 14 |
| F14 | 13 | 12 | 13 |
| F15 | 1 | 1 | 1 |
| F16 | 7 | 3 | 3 |
| F17 | 4 | 13 | 15 |
| F18 | 17 | 18 | 17 |
| F19 | 9 | 8 | 7 |
| F20 | 5 | 11 | 8 |
| F21 | 12 | 16 | 16 |
| F22 | 11 | 10 | 12 |
6.2 Computational Complexity
The time complexity values in Table 9 reflect the computational demands of each failure analysis method based on how they process data. For crisp (conventional) FMEA, the complexity is , where is the number of failure modes or components analyzed. This is because the method involves a simple calculation of the risk priority number (RPN) for each failure mode, using fixed numerical values for severity, occurrence, and detection. These are independent operations, requiring no iterations or comparisons between failure modes, resulting in linear complexity.
| Method | Complexity level | Typical time complexity | Handles uncertainty? | Key features | Real-time suitability |
|---|---|---|---|---|---|
| Crisp (Conventional) FMEA | Low | No | Uses fixed numeric scores; fast and simple; no uncertainty modeling | High | |
| Fuzzy FMEA | Moderate | Yes (Fuzziness) | Uses fuzzy sets and rule base; models subjectivity; more expressive than crisp | Moderate | |
| Fuzzy Rough FMEA | Moderate | or higher | Yes (Fuzziness + Roughness) | Models subjectivity, vagueness, and suitable for incomplete knowledge | Moderate |
In the case of fuzzy FMEA, the complexity increases to , where is the number of fuzzy rules or membership functions. On the other hand, fuzzy sets typically rely on relation matrices, where every object is compared with every other object in the dataset. This results in a total of pairwise comparisons, which leads to a time complexity of .
Each failure mode must be processed through a fuzzy inference system, which includes fuzzification of inputs, evaluation of fuzzy rules, and defuzzification of outputs. The rule base must be evaluated for each item, increasing the overall computation in proportion to both the number of items and the number of rules.
Fuzzy rough FMEA can have an even higher complexity, so typically or worse. This is because the method involves computing pairwise similarity or indiscernibility relations between all failure modes, resulting in a relation matrix of size . In addition to this, lower and upper approximations must be calculated for each object, often requiring multiple passes through the data. If attribute reduction or feature selection is also performed using fuzzy rough techniques, the complexity can grow further, depending on the number of attributes and the method used for searching attribute subsets.
The results of the comparison illustrate that while conventional FMEA is fastest, it lacks the ability to deal with uncertainty. Fuzzy FMEA adds uncertainty modeling with reasonable computational cost, and fuzzy rough FMEA offers the most powerful modeling for uncertainty and incomplete knowledge, at the cost of increased complexity.
6.3 Limitations and Future Research
This study recognizes several limitations. First, the proposed FMEA method holds the inherent limitation in all FMEA methods, that is, the reliance on experts' judgments, which may be influenced by different types of bias. Although the integration of rough and fuzzy theories with FMEA seeks to address the subjectivity in experts' judgments, the reliance on experts' inputs still remains. On the other hand, the number of experts may also influence the results. Moreover, this study is conducted on and validated by a specific use case and may not be generalized on more broad cases.
A valuable future research would be to compare FR-FMEA, RE-FMEA, Fuzzy FMEA, and conventional FMEA on the same case study, using the same team of interviewees, rather than data from different sources. This approach would allow for a more controlled comparison, highlighting which method offers greater granularity and effectiveness in complex systems. Additionally, exploring the sensitivity of these methods to input variations could provide deeper insights into their robustness and reliability under changing conditions.
- Conducting extensive cross-domain case studies to assess the method's effectiveness in different engineering sectors.
- Evaluating the approach under real operational conditions with incomplete, ambiguous information.
- Comparing fuzzy-rough FMEA with other advanced uncertainty modeling techniques to further explore its relative strengths and limitations for reliability engineering and applications.
- Investigate the application of the fuzzy-rough FMEA method across different system levels, including: system of systems level, system level, component level, and process level, to evaluate its effectiveness in capturing hierarchical risk propagation.
Validating the method's adaptability and reliability through various tests will be essential before it can be confidently adopted as a standard tool in complex engineering risk management.
7 Conclusion
The proposed integration of rough set theory with fuzzy logic in FR-FMEA offers a robust framework for addressing uncertainty in failure analysis. This study highlights the critical role of advanced methodologies such as FR-FMEA in improving the reliability and safety of turbomachinery.
The case study of a gas turbine system unveiled key components, such as the combustion chamber, fuel nozzle, and turbine rotor were consistently identified as high-risk across methods, emphasizing their criticality for maintenance and design optimization.
Therefore, the answers to the research questions that were raised relating to the two hypotheses are as follows:
Hypothesis 1.Rough set theory with fuzzy set theory would be integrated to manage the ambiguity, vagueness, and incompleteness in knowledge. However, its applications are rarely reported in failure analysis, while in decision science, it has large-scale studies and implementations.
Hypothesis 2.FR-FMEA has been applied to the actual case in the field of tauromachy. The process of such implementation, as well as the FRST-based FMEA proposed in this article, may be regarded as a framework in which triangular FR-FMEA must be used.
Author Contributions
Ali Aghazadeh Ardebili: conceptualization; investigation; writing – original draft; visualization; writing – review and editing; methodology; validation; formal analysis; project administration; data curation; supervision. Mahdad Pourmadadkar: methodology; validation; writing – review and editing; writing – original draft; investigation; formal analysis; data curation; conceptualization. Elio Padoano: supervision; project administration; funding acquisition; writing – review and editing; validation.
Disclosure
The authors have nothing to report.
Conflicts of Interest
The authors declare no conflicts of interest.
Appendix A: Risk Indexed Parameter (S, O, and D) Rankings for RPN Estimation for Conventional Methods and Extracted Scale for Current Study
| Effect | Severity level | Probability of occurrence | Detection (D) criteria | Conventional rating/scale |
|---|---|---|---|---|
| Hazardous | When a potential failure mode effects | Very high: failure is almost unavoidable ( in 2) | Controls actions are not available (Not possible) | 10 |
| Very high | When a potential failure mode effects | Very high: failure is almost unavoidable (1 in 3) | Extremely low possibility of noticing the breakdown (Very remote) | 9 |
| High | System inoperable due to destructive failure | High: repeated failure, A process that has often failed (1 in 8) | Low possibility of noticing the breakdown (Remote) | 8 |
| Moderately high | System inoperable due to harsh failure | High: repeated failure, A process that has often failed (1 in 20) | Low possibility of noticing the reasons for the occurrence of breakdown (Low) | 7 |
| Moderately low | System inoperable with minor or notable failure | Moderate: infrequent failures with little impact (1 in 80) | Low chance of detecting a possible cause and consequent failure mode (Low) | 6 |
| Low | System inoperable with minor or prominent failure | Moderate: infrequent failures with little impact (1 in 400) | Reasonable possibility of noticing the reasons for the occurrence of breakdown (Moderate) | 5 |
| Very low | System operable with relatively few failures | Low: relatively few failures are associated with similar processes (1 in 2000) | Reasonably high possibility of noticing the possible reasons for the occurrence of breakdown (Moderately high) | 4 |
| Very remote | System operable with relatively few failures | Low: relatively few failures are associated with similar processes (1 in 15,000) | High probability to notice the potential reasons for the occurrence of breakdown (High) | 3 |
| Remote | No effect | Remote: failure is implausible (1 in 1,50,000) | Very high probability of noticing the potential reasons for occurrence of breakdown (Very high) | 2 |
| None | No effect | Remote: failure is implausible (1 in 15,00,000) | Required controls are available to detect a failure mode (Assured controls) | 1 |
Appendix B: Interview Sample Form and the Desciption

Open Research
Data Availability Statement
The authors declare no conflicts of interest.


