Influence of Waste Glass Powder as a Supplementary Cementitious Material (SCM) on the Mechanical Properties, Expansion, Environmental Impact, and Microstructure of Cementitious Mortar
ABSTRACT
Incorporating waste glass powder (GP) as a partial replacement for Portland cement (PC) in cementitious mortars offers promising environmental and performance benefits. This study evaluates the effects of varying GP content on setting time, flexural and compressive strength, autoclave expansion, environmental impact, and microstructure. The results indicate that increasing GP content prolongs the setting time due to its lower reactivity compared to PC. Although the early strength of GP-incorporated mortars is substantially lower than that of the control mixture, extended curing durations result in significant strength gains due to ongoing pozzolanic reactions. Autoclave expansion tests show that replacing PC with 30%–40% GP reduces expansion by up to 50%, attributed to the improved particle packing, pozzolanic activity, and optimized pore structure. Environmental impact analysis indicates that both embodied carbon dioxide (ECO2e) and embodied energy (EE) decrease as GP content increases, reflecting its lower environmental footprint compared to PC. Microstructural analysis using scanning electron microscopy (SEM) reveals denser calcium silicate hydrate (C-S-H) crystals and refined pore structures in GP 30% and GP 40% mortars. Additionally, energy-dispersive X-ray spectroscopy (EDX) analysis shows significant consumption of calcium hydroxide (CH) due to the pozzolanic reaction, suggesting reduced risks of alkali-silica reaction (ASR) and sulfate attack, thereby enhancing long-term durability. These findings establish GP as a sustainable supplementary cementitious material (SCM) with significant environmental and performance advantages for future construction applications.
1 Introduction
Cement is a widely used material for construction, but it has a high environmental cost due to the energy consumption and greenhouse gas emissions involved in its production. Therefore, it is important to find alternative materials or additives that can reduce the amount of cement consumption and its environmental impact [1-4]. Among various supplementary cementitious materials (SCMs), glass powder (GP) demonstrates distinct advantages due to its high silica content, pozzolanic reactivity, and contribution to sustainable waste management. Compared to commonly used SCMs such as ground granulated blast furnace slag (GGBFS), fly ash (FA), silica fume (SF), metakaolin (MK), calcined clay, and rice husk ash (RHA), dredged marine sediments, phosphogypsum (PG), GP stands out for its environmental and performance-related benefits. GGBFS and FA, known for their hydraulic and pozzolanic properties, face availability constraints due to their dependence on the steel and coal industries, whereas GP is globally abundant [5-7]. SF, while highly reactive due to its ultrafine particles, is costly and less available, whereas GP offers a more sustainable and economical solution. Similarly, MK and calcined clays are effective in enhancing strength and durability but require energy-intensive processing, giving GP an environmental advantage. RHA, another agricultural waste-based SCM, exhibits strong pozzolanic properties but is regionally constrained and less standardized than GP. Dredged marine sediments require extensive pretreatment due to potential contaminants, while GP, derived from postconsumer glass, is chemically stable with minimal processing needs. PG, though produced as a by-product of phosphate fertilizer production, poses challenges related to harmful emissions, making GP a safer and more environmentally friendly alternative [8, 9].
GP has a high amount of silica, which can react with calcium hydroxide (CH) that is generated from the hydration of cement to form more cementitious compounds, such as calcium silicate hydrate (C-S-H) and calcium aluminate hydrate (CAH) [10-14]. The fineness of the GP is a key factor that affects its performance as an additive. The smaller the GP particles are, the more surface area they have, which means they can react more easily with CH in cement to form more C-S-H gel. C-S-H gel is the main binding phase in concrete, and its formation improves its strength and durability. GP can also fill the voids between the cement particles and improve the packing density of the mix, resulting in a denser and more durable matrix [7, 15-18].
Many researchers have studied the effect of GP as an additive in cement mortar and reported different effects on the mechanical properties, setting time, and microstructure of the mortar. The mechanical properties of mortar, such as compressive strength, flexural strength, tensile strength, and modulus of elasticity, depend on the amount, fineness, and color of GP, as well as the water-to-binder (w/b) ratio, curing temperature, and curing time [19-21]. Literature shows discrepancies in GP's effect on mechanical properties, with enhancement reported for finer GP (D50 < 10 μm) due to higher pozzolanic reactivity and a decrease for coarser GP (D50 > 15 μm) due to slower reaction rates [22-25]. This study's GP (D50 ≈ 20 μm, Section 2.1.1) aligns with the latter.
The compressive, flexural, and tensile strengths are essential mechanical characteristics of cement mortar, as they indicate its structural stability and load-bearing capacity. The degree of improvement in strength varies depending on several factors, such as the type and composition of the GP, the fineness of the powder, and the replacement percentage [10, 20, 26, 27]. In general, studies have shown that GP can be used to replace 20%–30% of the cement in mortar without affecting its strength [28-32].
The setting time of mortar, which is the time needed for the mix to start and finish setting, is influenced by the chemical composition and reactivity of GP, as well as the w/b ratio and admixtures. Some studies have found that GP can increase the setting time of mortar, while others have reported a drop or no significant effect. In general, GP tends to increase the setting time of mortar. The amount of increase in setting time depends on the amount of GP added, the fineness of the powder, and the type of cement used [32-34].
The microstructure of mortar, which is the arrangement and distribution of the hydration products and pores in the matrix, is influenced by the pozzolanic reaction and filler effect of GP, as well as the w/b ratio and curing conditions. Some studies have shown that GP can improve the microstructure of mortar by increasing the CSH content, reducing the porosity, and refining the pore structure. The refinement of the pore structure leads to a number of improvements in the properties of mortar, including increased strength and reduced permeability [21, 35-38].
The use of GP as an SCM in cementitious mortar has several benefits, such as reducing cement consumption, enhancing strength and durability, and improving the microstructure and hydration products of the mortar. GP can also reduce the environmental impact of cement production by recycling the waste glass and lowering the carbon footprint and energy demand of the cement industry [7, 39]. Moreover, GP can improve the aesthetic and functional properties of the mortar, such as color, texture, and thermal insulation. However, using GP as an SCM in cementitious mortar also has some drawbacks, such as the possibility of Alkali-silica reaction (ASR) expansion, the slow early strength development, and the optimal dosage and particle size of GP. ASR expansion is a harmful phenomenon that occurs when the alkalis in the cement react with the silica in the glass, forming a gel that swells and cracks the mortar. ASR expansion can be prevented or mitigated by using low-alkali cement, adding mineral admixtures, or controlling the moisture content of the mortar [17, 20, 21, 40, 41]. The slow early strength development of the mortar with GP is due to the low reactivity of the GP in the initial stages of hydration. The slow early strength can be improved using finer GP, increasing the curing temperature, or adding chemical activators. The optimal dosage and particle size of GP are important factors that affect the performance and characteristics of the mortar. The optimal dosage of GP depends on the type and quality of the cement, the water-to-cement (w/c) ratio, and the desired properties of the mortar [27, 30, 35, 36].
While the environmental benefits of GP as an SCM are documented, few studies integrate its combined effects on mechanical properties, durability, environmental impact, and microstructure within a single framework, especially with a focus on optimizing dosage for balanced performance. This study addresses this gap by providing a comprehensive dataset across these dimensions, including autoclave expansion, which is rarely quantified in GP studies, and recommends an optimal 30% GP dosage for applications prioritizing durability and sustainability, such as non-load-bearing elements in aggressive environments.
To address this research gap, this paper conducts a thorough investigation of how GP, as an SCM, affects the behavior and characteristics of cementitious mortar. The paper has the following structure: Section 2 explains the experimental work, including the mix design, specimen preparation and curing, and testing methods. Section 3 shows results and a discussion of the setting time, normal consistency, mechanical properties, autoclave expansion, environmental impact, and microstructure of the cementitious mortar with various GP dosages. Finally, Section 4 presents conclusions.
2 Materials and Methods
2.1 Materials
2.1.1 Binder
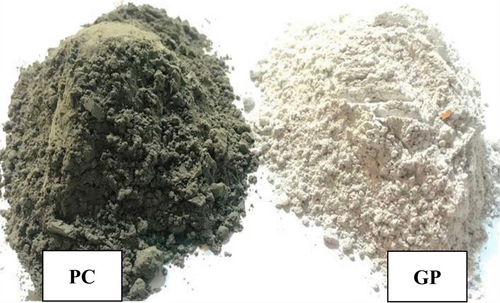
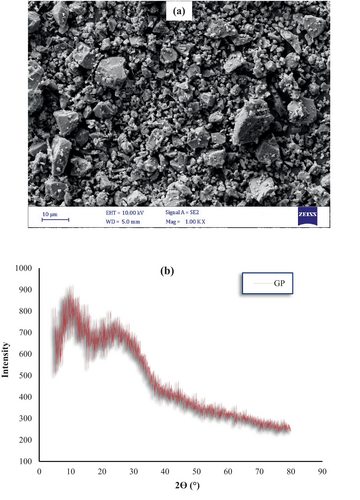
This research investigated the production of mortar utilizing Portland cement (PC) Type II and waste GP as a supplementary cementitious material. The GP was derived from postconsumer glass waste through a process of washing, drying, grinding, and subsequent sieving to achieve a desired particle size distribution. Chemical composition analysis of the GP revealed a significant silica content (71% SiO2), alongside alumina (3.4% Al2O3) and iron oxide (1.1% Fe2O3). Despite an elevated alkali content, the GP's chemical composition fulfilled the pozzolanic material requirements stipulated in ASTM C618 [42]. The chemical properties of PC and GP are shown in Table 1. Moreover, Figure 1 shows what PC and GP look like; Figure 2a,b shows the morphology and X-ray diffraction (XRD) pattern of GP, respectively; and Figure 3 shows the particle size distribution of PC and GP. The PC shows a broad particle size distribution, with the majority of particles ranging from approximately 0.1 μm to 100 μm. The cumulative curve indicates that the median particle size (D50) is approximately 10 μm, which reflects a typical particle size distribution for PC. The wide size range supports efficient hydration due to the availability of both finer particles for early reaction and coarser particles for long-term strength gain.
| Chemical properties | PC (%) | GP (%) |
|---|---|---|
| Silicon Dioxide (SiO2) | 21.21 | 71.00 |
| Aluminum Oxide (Al2O3) | 4.49 | 3.42 |
| Ferrous Oxide (Fe2O3) | 3.70 | 1.10 |
| Calcium Oxide (CaO) | 63.62 | 9.76 |
| Magnesium Oxide (MgO) | 1.32 | 1.59 |
| Sodium Oxide (Na2O) | 0.68 | 11.98 |
| Potassium Oxide (K2O) | 0.59 | 0.29 |
| Sulfur Trioxide (SO3) | 2.66 | 0.19 |
| Loss On Ignition (LOI) | 1.67 | 0.67 |
| Insoluble Residue (IR) | 0.49 | 100.00 |
| Tricalcium Silicate (C3S) | 55.71 | — |
| Dicalcium Silicate (C2S) | 18.61 | — |
| Tricalcium Aluminate (C3A) | 5.92 | — |
| Tetra-calcium Aluminoferrite (C4AF) | 11.01 | — |
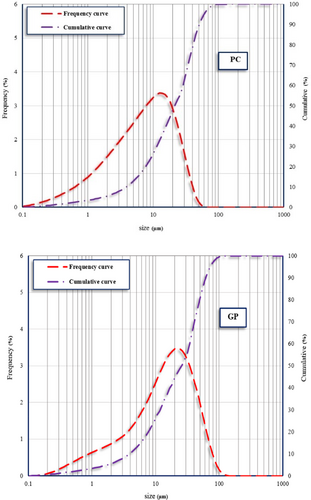
Conversely, the GP exhibits a narrower distribution compared to PC, with particle sizes predominantly between 0.3 μm and 80 μm. The cumulative curve indicates a D50 of approximately 20 μm, slightly coarser than PC. The difference in particle size distribution between PC and GP significantly influences the microstructure and mechanical properties of the resulting mortar. PC provides the primary cementitious binding phase, while the GP serves as an SCM, refining the pore structure and improving durability.
2.1.2 Sand
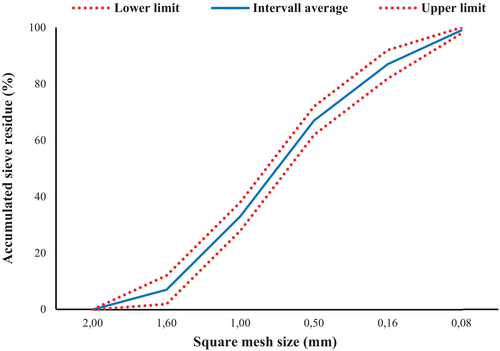
The particle size distribution of the sand, as shown in Figure 4, aligns with the specifications outlined in EN 196–1:2005 for standardized sand used in cementitious testing [43]. The cumulative sieve residue curve indicates that the D50 of the sand is approximately 0.6 mm, meaning that 50% of the sand particles are smaller than this size. The particle size range extends from 0.08 mm to 2 mm, as defined by the upper and lower sieve limits. The distribution follows a well-graded pattern, which ensures proper packing density and minimizes the void ratio within the mortar matrix. This contributes to improved workability and reduces the water demand of the mortar. The consistency of the sand's gradation within the specified limits ensures reproducibility and reliability in experimental results, which is critical for isolating the effects of SCMs, such as GP, in the mortar compositions.
2.2 Mixture Proportions
The present study examines the mechanical characteristics, expansion, and microstructure of mortar by investigating eight different combination proportions containing GP. In accordance with the requirements provided in EN 196–1:2005, mortar prisms were produced with a composition consisting of 450 g of cement, 225 g of water, and one bag containing 1350 g of CEN Standard Sand [43]. The proportions of the mixture can be seen in Table 2.
| Materials | Control | GP 5% | GP 10% | GP 15% | GP 20% | GP 25% | GP 30% | GP 35% | GP 40% |
|---|---|---|---|---|---|---|---|---|---|
| PC (g) | 450 | 427.5 | 405 | 382.5 | 360 | 337.5 | 315 | 292.5 | 270 |
| Sand (g) | 1350 | 1350 | 1350 | 1350 | 1350 | 1350 | 1350 | 1350 | 1350 |
| Water (g) | 225 | 225 | 225 | 225 | 225 | 225 | 225 | 225 | 225 |
| GP (g) | 0 | 22.5 | 45 | 67.5 | 90 | 112.5 | 135 | 157.5 | 180 |
| W/B | 0.5 | 0.5 | 0.5 | 0.5 | 0.5 | 0.5 | 0.5 | 0.5 | 0.5 |
2.3 Production Method and Curing Conditions
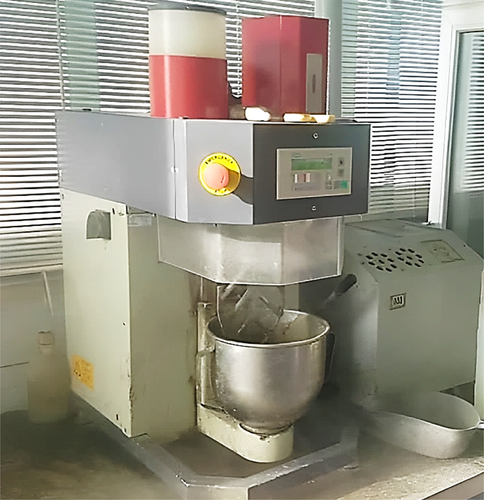
Cement mortar was prepared and tested following the EN 196–1:2005 standard [43]. Initially, cement, sand, and water were combined in a mixer (Figure 5). Subsequently, the mortar was cast into 40 × 40 × 160 mm metal molds. After that, the specimens were kept in a humidity-curing cabinet for 24 h. After 24 h, all the specimens were demolded, and until the time of testing, the specimens were cured in water at a temperature of 20°C ± 2°C.
2.4 Test Methods
2.4.1 Setting Time
The setting time of cement refers to the period required for the cement paste to transition from a fluid state to a solid state. It is categorized into two stages: The initial setting time, which marks the point at which the paste begins to lose its plasticity, and the final setting time, which indicates when the paste has hardened sufficiently to resist significant deformation. Understanding the setting time is crucial for construction practices, as it ensures proper handling, placement, and finishing of cement-based materials.
The setting time is determined using a Vicat apparatus, as specified in ASTM C191. A paste of cement and water is placed in a mold, and a standard needle is used to measure penetration depth at specific intervals. The initial setting time corresponds to the time at which the needle penetrates the paste to a depth of 25 mm. The final setting time is the time at which the needle fails to leave a visible mark on the surface. These measurements provide critical information about the hydration behavior of cement and its suitability for various applications [44].
2.4.2 Normal Consistency
The normal consistency of cement refers to the amount of water required to produce a paste with a standard consistency, allowing a Vicat plunger to penetrate to a depth of 10 ± 1 mm under specified conditions. This test is performed using a Vicat apparatus, where a known weight of cement is mixed with varying amounts of water until the desired consistency is achieved. The normal consistency is critical to ensuring that the cement has an appropriate water content for proper setting and hydration processes, as well as for standardizing subsequent tests such as setting time and soundness [45].
2.4.3 Flexural and Compressive Strength
The flexural and compressive strengths of the mortar specimens were determined in accordance with the EN 196–1:2005 standard [43]. An automatic cement compression and flexure testing machine was employed to apply loads under controlled conditions until specimen failure. For flexural strength, prismatic mortar specimens measuring 40 × 40 × 160 mm were subjected to three-point bending. The maximum load at failure was used to calculate the flexural strength.
For compressive strength, the halves of the broken flexural specimens were tested. The compressive load was applied uniformly to the specimen faces until failure, and the strength was calculated based on the failure load and the cross-sectional area of the specimens. These measurements are critical for assessing the mechanical performance and suitability of mortar in various structural applications.
2.4.4 Autoclave Expansion
The autoclave test is a standardized procedure used to evaluate the potential expansion of hardened cement paste when exposed to high-pressure steam. This test is particularly useful for detecting delayed expansion caused by the hydration of free calcium oxide (CaO) or magnesium oxide (MgO) present in hydraulic cement. Such expansions can lead to cracking and durability issues.
As specified in ASTM C151, the test involves molding and curing cement paste specimens, which are then subjected to a steam pressure of approximately 2.0 MPa (295 psi) at a temperature of about 215.7°C (420°F) for a defined period. The length of the specimens is measured before and after the test to calculate the percentage expansion. The autoclave expansion is a critical quality control parameter, with a maximum permissible expansion limit typically set at 0.8% for most hydraulic cements. This ensures that the cement is free from excessive amounts of reactive CaO or MgO, thereby minimizing the risk of delayed expansion and associated structural damage [46].
2.4.5 Scanning Electron Microscope (SEM) and Energy-Dispersive X-Ray Spectroscopy (EDX)
The scanning electron microscope (SEM) is a powerful tool for investigating the surface morphology and microstructural features of concrete at the micro- and nanoscale levels [7]. In this study, an SEM (Philips XL 30, LEO 1430VP-Carl Zeiss) was utilized to examine the microstructure of mortar specimens. The imaging was conducted at an accelerating voltage of 10 kV and a magnification of up to 10,000 × to visualize key features of the microstructure.
Mortar specimens aged 90 days were prepared for SEM analysis with dimensions of 10 × 10 × 10 mm. To ensure conductivity and prevent charging, the specimens were coated with a thin layer of gold prior to imaging.
While SEM primarily provided high-resolution images of the microstructure, energy-dispersive X-ray spectroscopy (EDX), an accessory to the SEM system, was employed to analyze the chemical composition of specific phases within the specimens. This dual approach enabled a comprehensive understanding of the morphological and chemical characteristics of the mortar specimens.
3 Results and Discussion
3.1 Setting Time
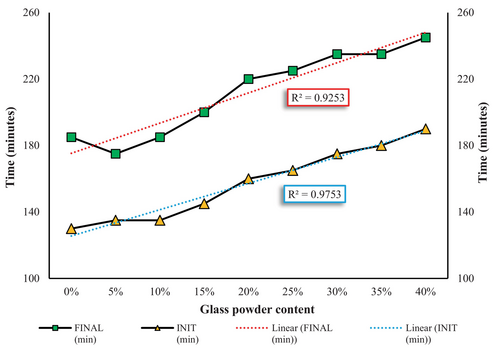
The setting time results depicted in Figure 6 reveal the impact of GP content on the initial and final setting times of cement paste. With an increase in GP content from 0% to 40%, both the initial and final setting times are extended. The high R-squared (R 2) values of 0.9753 for the initial setting time and 0.9253 for the final setting time indicate a strong correlation between GP content and the setting time trends. This delay in setting time is primarily due to the dilution effect caused by partially replacing PC with GP. The reduction in PC content lowers the availability of reactive phases, specifically tricalcium silicate (C3S) and tricalcium aluminate (C3A), which are primarily responsible for early hydration reactions. Consequently, the hydration rate slows down during the initial period, as GP particles primarily act as fillers with limited involvement in the early hydration reactions. The increased water-to-cementitious material ratio (w/c) resulting from replacing PC with GP also contributes to the extended setting times [47, 48].
Moreover, the pozzolanic activity of the GP plays a significant role in prolonging the setting time. GP reacts with CH to form C-S-H, but this secondary reaction occurs more slowly compared to the primary hydration reactions of PC. Additionally, a silica gel layer may form on the surface of cement particles in the presence of GP, further hindering hydration and extending the setting time [49, 50]. The fineness and alkali content of GP further influence the setting behavior. High-alkali GP can accelerate the hydration process by increasing the pH and ionic strength of the pore solution, while low-alkali GP can slow hydration by consuming CH and forming a passivating layer [51, 52].
The distinct slopes of the initial and final setting time curves in Figure 6 suggest that the effect of GP becomes more pronounced during the later hydration stages. The cumulative influence of the reduced PC content, slower pozzolanic reaction, and filler effect is more evident in the final setting times. These findings are consistent with previous research, which highlights the critical roles of GP quantity, particle size, and chemical composition in modifying the hydration and setting behavior of cementitious systems [33, 53-55].
3.2 Normal Consistency
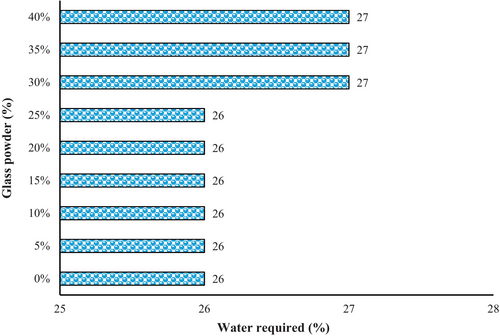
The normal consistency of the mortar refers to the amount of water required to achieve a certain workability, which is commonly measured using the Vicat apparatus. According to the results (Figure 7), the water required for cement mixtures containing 30%, 35%, and 40% GP was around 1% greater than that of cement paste with 100% PC. The particle size, the chemical composition of the GP, and the other ingredients in the mortar mixture can affect this amount. The normal consistency of mortar with GP can change in different ways when GP is added to the mortar. GP, which is very fine, can make the mortar require more water because it has a lot of surface area. This means that the water molecules stick to the surface of the glass particles, leaving less water to make the cement hydrate. Also, the GP can slow down the hydration process of the cement, making the setting time longer.
On the other hand, GP that is not very fine can have the opposite effect, making the mortar require less water. This is because the bigger particles have less surface area and, therefore, do not absorb as much water. Also, bigger GP can make the mortar easier to work with by acting like tiny balls that reduce the friction between the cement particles [56].
The normal consistency of the mortar can also change depending on the chemical composition of the GP. GP with a lot of silica can make the mortar require more water because of the pozzolanic activity of silica. Pozzolanic materials react with CH, a cement hydration product, to make more binding compounds. This extra hydration uses up water, leaving less water for the cement. Generally, the normal consistency of mortar with GP is higher than that of mortar without GP. This means that more water is required to make a mortar with the same workability. The exact amount of water required will depend on the factors mentioned above.
3.3 Compressive Strength
The compressive strength test is a common method to evaluate the quality of concrete because it relates to the mix composition and structure of the hydrated cement paste [57]. Figure 8 shows how compressive strength changed in the control mortar, made of 100% PC, over 90 days. The compressive strength values measured were 29 MPa at 3 days and 56 MPa at 90 days. This is slightly higher than the compressive strength of mortar 70% PC + 30% GP (GP 30%), which increased from 16 to 47 MPa from 3 to 90 days, that is, a decrease of 45% [(16–29) × 100/29] at 3 days and only 16% [(47–56) × 100/56] at 90 days from the control mortar.
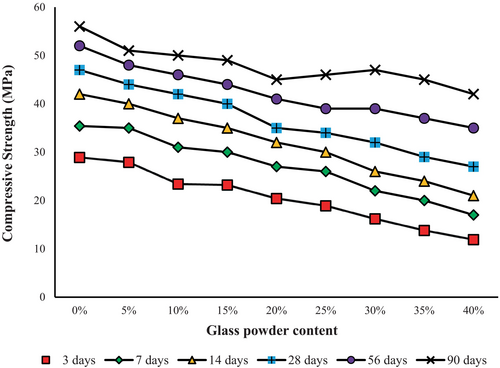
This finding supports the positive effect of GP on improving the strength of the cementitious matrix in the final stages of development. However, it is important to note that the strength of the cementitious matrix with GP is still extremely lower than that of the control mortar in the early stages of development [7, 58]. The reason for this phenomenon might be due to the high percentage of GP (30%) and its slow pozzolanic reactivity during the initial stages. Moreover, during the later stage, adding GP to cement paste causes the pozzolanic reaction, resulting in the formation of C-S-H. This C-S-H compound effectively fills the interfacial transition zone (ITZ) and improves the compressive strength of the cementitious material [7, 49, 59]. Also, the pozzolanic reaction of GP has a direct relationship with its particle size. A smaller particle size is linked to an increased pozzolanic reaction. Therefore, the rate at which strength increases is affected by the particle size distribution of the GP [7, 60]. This slower strength development is acceptable in applications where early load-bearing is not required, such as precast nonstructural elements, allowing extended curing to achieve comparable long-term strength.
3.4 Flexural Strength
The flexural strength of mortar and concrete is an essential characteristic that shows how well the material performs when it is bent under stress. The ability to resist bending forces is crucial for materials used in structures, such as beams, slabs, and pavements, that are exposed to bending loads [61-63]. This study mainly focused on how a specific factor, namely the use of GP as a partial substitute for cement in mortar mixtures, influenced the strength of mortar. Figure 9 shows how flexural strength changed over time in the control mortar, which only had 100% PC for a period of 90 days. The observed flexural strength values were 5.3 MPa at a 3-day curing period and 8.4 MPa over a 90-day curing period. The flexural strength of mortar 60% PC + 40% GP (GP 40%) showed a lower value compared to the control mortar. Specifically, the flexural strength increased from 2.8 to 8.1 MPa during a period of 3–90 days. This represents a decrease of 47% [(2.8–5.3) × 100/5.3] at 3 days and a minor decrease of 3.6% [(8.1–8.4) × 100/8.4] at 90 days when compared to the control mortar.
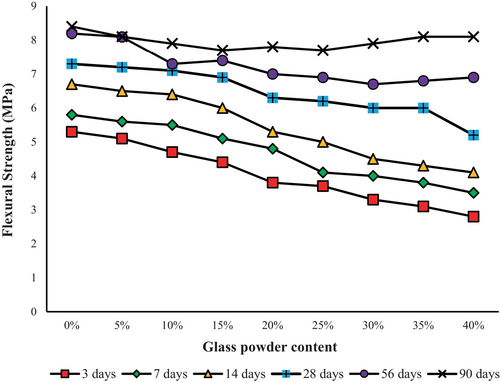
The findings of the study also showed that there was a positive relationship between the duration of the curing process and flexural strength, regardless of how much GP was present. The longer duration of curing enhanced hydration and pozzolanic reactions, leading to higher levels and better qualities of cementitious compounds. The pozzolanic properties of GP allow it to react with CH, which is produced from cement hydration, and create more cement-like substances, such as C-S-H and CAH. GP can also act as a filler and increase the packing density of the mix by filling the gaps between the cement particles. This leads to a more compact and stronger matrix [64-68].
3.5 Correlation Between Compressive and Flexural Strength
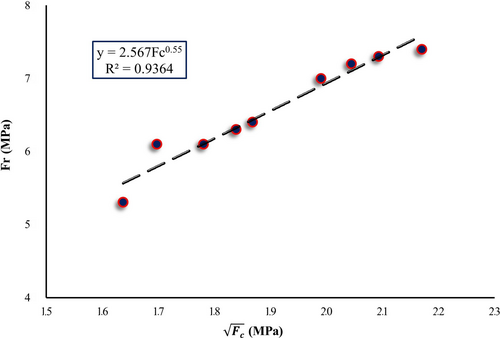
The proposed relationship has high accuracy and agrees with the equations proposed by other researchers for PC specimens [69].
3.6 Autoclave Expansion
The ASTM C151 standard specifies a maximum autoclave expansion limit of 0.8% for normal Portland cement [46]. This limit ensures that excessive free lime (CaO) or magnesia (MgO) in cement does not cause delayed expansion, which could result in cracking or structural damage in concrete. As illustrated in Figure 11, mixtures containing 30%–40% GP show a significant reduction in autoclave expansion up to 50% lower than the control sample. This demonstrates the beneficial role GP can play in enhancing the stability of cement systems. However, the effects of GP on autoclave expansion are influenced by several interdependent factors. Smaller GP particles exhibit higher surface area, which enhances pozzolanic activity by promoting reactions with CH to form stable C-S-H, contributing to reduced autoclave expansion by minimizing the availability of free lime. Irregularly shaped GP particles can fill voids more effectively, improving particle packing and reducing microstructural voids, leading to less free water in the matrix and curbing expansion during autoclaving [70, 71].
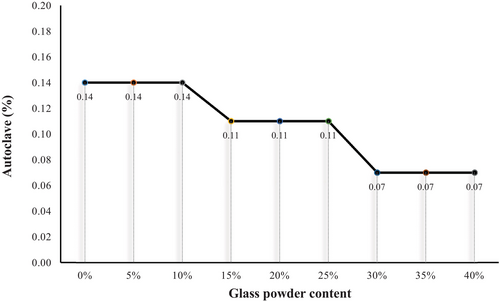
The chemical composition of GP is critical in determining its reactivity, as low alkali content minimizes the risk of ASR, a major contributor to expansion, while higher alkali content can exacerbate ASR and increase autoclave expansion. The proportion of GP incorporated also significantly affects autoclave expansion. Moderate replacement levels, such as 30%–40%, provide an optimal balance of pozzolanic reactivity and dilution of alkali content, resulting in reduced expansion, although excessive GP levels may introduce additional alkali ions, potentially counteracting the benefits [71, 72]. Additionally, the response of cement systems to GP additions is influenced by the type and alkali content of the cement, with low-alkali cements benefiting from the pozzolanic effect of GP, while high-alkali cements are more prone to ASR due to the presence of excess alkali ions from both the cement and GP [71, 73].
The variability in the results of autoclave expansion across different studies underscores the complexity of the interaction between GP and cementitious systems. While GP generally reduces autoclave expansion due to its pozzolanic nature and ability to mitigate free lime, the overall effect depends on optimizing these influencing factors. Careful selection of GP characteristics and incorporation levels is crucial to maximizing its potential in reducing autoclave expansion in cement-based materials [71, 74, 75].
3.7 Environmental Impact
Table 3 highlights the ecological factors of the materials used in this study, where PC exhibits the highest embodied energy (EE) of 5.63 MJ/kg and embodied carbon dioxide (ECO2e) emissions of 0.95 kgCO2/kg. In comparison, GP has significantly lower EE (0.52 MJ/kg) and ECO2e (0.043 kgCO2/kg), making it a more sustainable alternative.
| Materials | EE (MJ/kg) | Embodied carbon (kgCO2/kg) |
|---|---|---|
| PC | 5.63 | 0.95 |
| Sand | 0.08 | 0.033 |
| GP | 0.52 | 0.043 |
Table 4 presents the proportions of materials for each mixture. For example, the control mix contains 600 kg of PC, which decreases progressively as the GP replacement level increases. At 40% GP substitution, the PC content is reduced to 360 kg, while the GP content increases to 240 kg per cubic meter of mortar. Water usage remains constant across all mixtures, ensuring it does not influence the ecological analysis.
| Materials | Control | GP 5% | GP 10% | GP 15% | GP 20% | GP 25% | GP 30% | GP 35% | GP 40% |
|---|---|---|---|---|---|---|---|---|---|
| PC | 600 | 570 | 540 | 510 | 480 | 450 | 420 | 390 | 360 |
| Sand | 1700 | 1693.7 | 1687.3 | 1681 | 1674.7 | 1668.4 | 1662 | 1655.7 | 1649.4 |
| Water | 300 | 300 | 300 | 300 | 300 | 300 | 300 | 300 | 300 |
| GP | 0 | 30 | 60 | 90 | 120 | 150 | 180 | 210 | 240 |
| W/B | 0.5 | 0.5 | 0.5 | 0.5 | 0.5 | 0.5 | 0.5 | 0.5 | 0.5 |
Table 5 presents the results of the ecological analysis of mortar mixtures. The control mix generates the highest ECO2e (626.1 kgCO2e/m3) and EE (3514 MJ/m3). As GP replaces PC, significant reductions are observed in both parameters. For instance, the ECO2e decreases to 598.7 kgCO2/m3 at 5% GP substitution and further drops to 406.8 kgCO2/m3 at 40% GP substitution. Similarly, EE decreases from 3360.2 MJ/m3 at 5% GP replacement to 2283.6 MJ/m3 at 40% GP replacement.
| Ecological Factors | Control | GP 5% | GP 10% | GP 15% | GP 20% | GP 25% | GP 30% | GP 35% | GP 40% |
|---|---|---|---|---|---|---|---|---|---|
| ECO2e (kgCO2e/m3) | 626.1 | 598.7 | 571.3 | 543.8 | 516.4 | 489 | 461.6 | 434.2 | 406.8 |
| EE (MJ/m3) | 3514 | 3360.2 | 3206.4 | 3052.6 | 2898.8 | 2745 | 2591.2 | 2437.4 | 2283.6 |
These reductions are visually depicted in Figure 12, illustrating the percentage changes in cement consumption, ECO2e emissions, and EE with varying GP content. At 5% GP replacement, there is a 4.38% reduction in ECO2e and EE, which increases to 35.03% and 35.02%, respectively, at 40% GP substitution. This demonstrates that replacing PC with GP significantly mitigates the environmental impact by reducing embodied energy and carbon emissions.
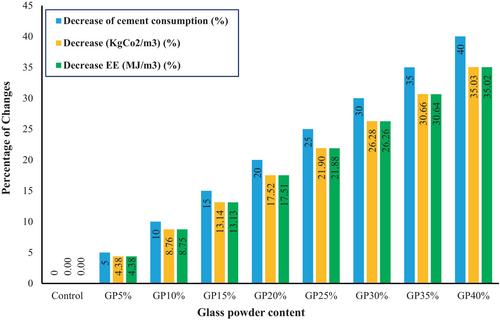
This 35% reduction (from 626.1 kgCO2e/m3 in the control to 406.8 kgCO2e/m3 at 40% GP) not only lowers the environmental footprint but also aligns with improved durability metrics, such as a 50% reduction in autoclave expansion (Section 3.6), which enhances resistance to expansive reactions in aggressive environments.
These findings underscore the potential of GP as a sustainable SCM, aligning with the growing emphasis on reducing the environmental footprint of construction materials [75, 76].
3.8 Scanning Electron Microscopy (SEM) and Energy-Dispersive X-Ray Spectroscopy (EDX)
Scanning electron microscopy (SEM) was employed to examine the microstructural characteristics of cementitious mortars containing 0%, 30%, and 40% GP as a partial cement replacement after 90 days of water curing. The SEM images, presented in Figure 13, consist of three parts: Figure 13a for the control sample, Figure 13b for the GP 30% sample, and Figure 13c for the GP 40% sample, revealing distinct microstructural differences across the samples.
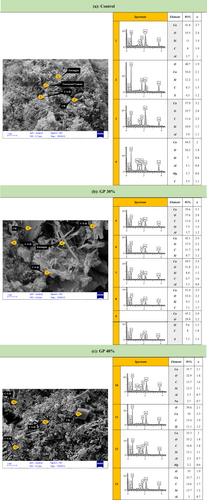
The control sample displays a heterogeneous microstructure typical of Type II Portland cement mortar. The matrix exhibits a textured appearance with irregular particles ranging from a few micrometers to over 10 μm, interspersed with smoother, elongated regions. The textured matrix corresponds to calcium silicate hydrate (C-S-H), the primary binding phase, while the smoother regions are indicative of CH. Visible cracks and fissures are present, likely resulting from drying-induced shrinkage, though they may also reflect inherent porosity in the material.
The GP 30% sample shows a more complex microstructure, with irregularly shaped particles exhibiting sharp edges embedded within a porous matrix. The matrix appears slightly denser than that of the control, suggesting the formation of additional C-S-H through the pozzolanic reaction between GP and CH. Cracks are still present, indicating that while GP contributes to matrix densification, it does not fully mitigate drying-induced artifacts.
The GP 40% sample exhibits an evolved microstructure. The matrix is characterized by a dense, fibrous network of C-S-H, appearing as the densest among the samples. The presence of CH is minimal, with small plate-like crystals observed, reflecting significant consumption of CH through the pozzolanic reaction with GP. The enhanced matrix densification and reduced CH content suggest improved durability, though the persistence of unreacted GP indicates potential long-term reactivity concerns, such as delayed ASR.
Energy-dispersive X-ray spectroscopy (EDX) was performed at multiple points across the samples to determine the elemental composition and identify the phases present, ensuring a comprehensive analysis of the microstructural features. In Figure 13, a total of 13 spectra were analyzed: Spectra 1–4 from the control sample, Spectra 5–9 from the GP 30% sample, and Spectra 10–13 from the GP 40% sample. EDX points were strategically selected to target distinct morphological features, such as smooth particles, needle-like structures, and matrix regions, to capture a representative range of phases and interactions. Elemental compositions (excluding C and O for stoichiometric considerations) were used to calculate Ca/Si and Ca/Al ratios, which, along with the presence of elements like S and Na, facilitated phase identification.
Control Sample (Spectra 1–4).
Spectrum 1 (unreacted cement): Ca: 41.8%, Si: 11%, Al: 3.7% (Ca/Si ≈ 3.8). The high Ca/Si ratio and presence of Al suggest unreacted cement phases, likely tricalcium silicate (C3S) or dicalcium silicate (C2S), which are visible as irregular particles in the SEM image.
Spectrum 2 (Ettringite): Ca: 34.4%, Si: 12.2%, S: 4.3% (Ca/Si ≈ 2.8, Ca/S ≈ 8.0). The presence of S and a moderate Ca/Si ratio indicate ettringite (Ca6Al2(SO4)3(OH)12·26H2O), a sulfate phase, though Al was not detected, possibly due to low concentration or matrix effects. This phase is typically found in the textured matrix.
Spectrum 3 (C-S-H): Ca: 37.9%, Si: 10.9%, Al: 3.9% (Ca/Si ≈ 3.5). The Ca/Si ratio, though slightly high, aligns with C-S-H, the dominant binding phase in the textured matrix, with minor CH contributions.
Spectrum 4 (CH): Ca: 44.5%, Si: 7%, Al: 5.1%, Mg: 3.7% (Ca/Si ≈ 6.4). The very high Ca/Si ratio confirms portlandite (CH), corresponding to the smoother, elongated regions in the SEM image.
The control sample's microstructure is dominated by C–S–H and CH, with minor ettringite and unreacted cement, reflecting typical hydration products of Type II cement after 90 days.
GP 30% Sample (Spectra 5–9).
Spectrum 5 (Ettringite): Ca: 39.6%, Si: 7.5%, Al: 3.7% (Ca/Si ≈ 5.3). The presence of Al and a high Ca/Si ratio suggests ettringite, though S was not reported, possibly due to low detection.
Spectrum 6 (C-S-H): Ca: 42.1%, Si: 8.7% (Ca/Si ≈ 4.8). The Ca/Si ratio indicates a C-S-H-dominated region, likely in the denser matrix, with minor CH.
Spectrum 7 (C-S-H): Ca: 49.5%, Si: 8.8%, Al: 3.3% (Ca/Si ≈ 5.6). Despite the high Ca/Si ratio, the matrix context and reduced CH presence suggest C-S-H, reflecting pozzolanic activity.
Spectrum 8 (C-S-H): Ca: 51.4%, Si: 9.2% (Ca/Si ≈ 5.6). Similar to Spectrum 7, this indicates C-S-H in a region with an ongoing GP reaction.
Spectrum 9 (CH): Ca: 45.2%, Si: 9.6%, S: 7.3% (Ca/Si ≈ 4.7). The high Ca/Si ratio and matrix context suggest residual CH, indicating an incomplete pozzolanic reaction.
The 30% GP sample shows a reduction in CH (only Spectrum 9) compared to the control, with C-S-H dominating (Spectra 6–8), confirming the pozzolanic reaction's progress. The presence of ettringite (Spectrum 5) suggests minor sulfate reactions, possibly due to the cement's composition.
GP 40% Sample (Spectra 10–13).
Spectrum 10 (C-S-H): Ca: 35.7%, Si: 12.3%, Al: 2.7%, Na: 2.7% (Ca/Si ≈ 2.9). The presence of Na indicates a GP particle, but the Ca/Si ratio and needle-like structures in the SEM image confirm C-S-H formation around the GP, evidencing bonding.
Spectrum 11 (CH): Ca: 34%, Si: 11.1% (Ca/Si ≈ 3.1). The Ca/Si ratio suggests minor CH in a C-S-H-dominated matrix, reflecting near-complete CH consumption.
Spectrum 12 (C-S-H): Ca: 33.3%, Si: 12.1%, Al: 2.3%, Mg: 2.2% (Ca/Si ≈ 2.8). The Ca/Si ratio and needle-like structures confirm C-S-H, indicating advanced pozzolanic activity.
Spectrum 13 (C-S-H): Ca: 33.7%, Si: 13.7%, Al: 3% (Ca/Si ≈ 2.5). The lowest Ca/Si ratio among the spectra aligns with C-S-H, supported by the SEM's needle-like structures.
The 40% GP sample shows the most significant CH reduction (only Spectrum 11), with C-S-H dominating (Spectra 10, 12, 13), reflecting an advanced pozzolanic reaction. The presence of Na in Spectrum 10 confirms unreacted GP, but its association with C-S-H indicates partial reaction. The denser C-S-H (Ca/Si ≈ 2.5–2.9, Spectra 10, 12–13) and reduced CH (Spectrum 11) contribute to tangible benefits: (1) a 50% reduction in autoclave expansion (Section 3.6) by consuming free lime and CH, enhancing resistance to expansive reactions; (2) improved long-term compressive strength (e.g., GP 30%: 47 MPa at 90 days, Section 3.3); (3) enhanced sulfate resistance by limiting ettringite formation through CH consumption; and (4) reduced water permeability due to refined pore structure.
4 Conclusions
This study establishes GP as a promising SCM for cementitious mortars, demonstrating significant benefits in mechanical properties, durability, environmental sustainability, and microstructural development. The incorporation of GP at replacement levels up to 40% extends setting times due to the dilution of reactive cement phases (e.g., tricalcium silicate), as observed in Section 3.1. However, prolonged curing compensates for initial strength reductions, with the GP 30% mixture achieving compressive strengths 16% lower than the control at 90 days, as reported in Section 3.3, while higher replacement levels show less strength recovery. The slower strength gain (e.g., GP 30%: 45% lower at 3 days, Section 3.3) is acceptable for non-load-bearing applications (e.g., precast panels in marine or sulfate-rich environments) where curing time is not a constraint. The 50% reduction in autoclave expansion (Section 3.6) and reduced CH (Section 3.8) enhance resistance to sulfate attack by limiting ettringite formation, making GP suitable for such environments.
Autoclave expansion tests reveal a reduction of up to 50% at 30%–40% GP replacement levels (Section 3.6), attributed to GP's pozzolanic activity, which consumes CH to form C-S-H, and its particle size distribution (0.3–80 μm, D50 ≈ 20 μm), which, despite being coarser than PC (D50 ≈ 10 μm), complements PC's broader distribution (0.1–100 μm) to improve packing density. Additionally, the increased binder volume due to mass-based replacement further enhances packing density and reduces permeability, as evidenced by the denser matrix observed in SEM images (Section 3.8). Environmentally, GP substitution decreases ECO2e emissions and EE by approximately 35% at 40% replacement (Section 3.7), underscoring its role as a sustainable alternative to PC.
Microstructural analysis via SEM–EDX (Section 3.8) highlights denser C-S-H formations, refined pore structures, and improved interfacial bonding between GP and cement hydrates, particularly in the GP 30% and GP 40% samples. The formation of C-S-H around GP particles (Spectrum 10) confirms chemical bonding, enhancing durability. Based on the SEM–EDX findings, a 30% GP replacement is recommended as the optimal dosage. This level balances microstructural refinement, mechanical performance, and durability, achieving significant C-S-H formation and minimal unreacted GP, while maintaining compressive strength close to the control at 90 days. The denser C-S-H reduces water permeability and enhances sulfate resistance by limiting ettringite formation, further supporting GP's durability benefits.
4.1 Limitations
This study provides valuable insights into the use of GP as an SCM, but several limitations must be acknowledged. The SEM–EDX analysis, while comprehensive with 13 spectra, relies on point-based measurements, which may not fully capture the spatial variability of the microstructure; techniques like EDX mapping could offer a more detailed phase distribution. Additionally, the presence of unreacted GP in the 40% replacement sample (Spectrum 10) raises concerns about long-term durability, particularly the potential for delayed ASR, given GP's particle size distribution (0.3–80 μm, D50 ≈ 20 μm) with coarser fractions (20–80 μm) that may remain reactive over time. The study's focus on 90-day properties limits insights into the completion of the pozzolanic reaction, as longer curing periods (e.g., 360 days) could better assess long-term behavior and ASR risk. Furthermore, GP's coarser particle size compared to PC (D50 ≈ 10 μm) may not optimize packing efficiency, potentially limiting pore refinement and permeability reduction. Future studies should: (1) employ EDX mapping for detailed phase analysis; (2) extend curing to 360 days to evaluate long-term durability; (3) grind GP to a finer particle size (e.g., D50 < 10 μm) to enhance reactivity and packing density; and (4) compare mixes with adjusted cement content (e.g., 95% cement vs. 95% cement + 5% GP) to quantify benefits like reduced water permeability while maintaining comparable strength.
Author Contributions
Mahdi Bameri: conceptualization, methodology, software, data curation, investigation, formal analysis, visualization, writing – original draft, writing – review and editing, project administration, resources. Mohammad Mohammadhasani: resources, project administration, writing – review and editing, supervision, validation, visualization. Alireza Khaloo: supervision, validation, project administration. Ashraf Ashour: validation, supervision, project administration, resources, writing – review and editing. Morteza NikKhah: data curation, methodology, visualization.
Acknowledgments
The authors sincerely appreciate the invaluable cooperation and generous technical and laboratory equipment support provided by Kerman Momtazan Cement Co. (KMCC), which greatly facilitated the experiments for this study. They also extend their deepest gratitude to Mr. Moein Amiri, Quality Control Manager at KMCC, for his valuable technical assistance and insightful contributions throughout the research process. Additionally, the authors thank Ms. Hanieh Soltani Jalal Lou for her assistance in the proofreading of the article. This support and collaboration significantly enhanced the quality and outcomes of this work.
Conflicts of Interest
The authors declare no conflicts of interest.
Open Research
Data Availability Statement
The data that support the findings of this study are available from the corresponding author upon reasonable request.


