A Discrete-Element-Based Pore-Scale Hydromechanical Approach to Investigate the Hysteresis Effect on the Unsaturated At-Rest Earth Pressure Coefficient
ABSTRACT
Accurate design of several geotechnical structures, such as retaining walls and piles, necessitates a thorough understanding of the dependence of earth pressure on various soil conditions. Designing resilient earth structures in a rapidly changing climate requires consideration of soil moisture variations caused by droughts or intense rainfall. Therefore, saturation-dependent alterations in the soil's mechanical behavior, such as lateral earth pressure, are crucial to consider. In this study, a pore scale approach, namely, a coupled discrete element-pore network method, was utilized to study the volumetric behavior of unsaturated sandy soils under at-rest conditions. The simulated oedometer tests indicated that the behavior of the soil under study is nonlinear, regardless of variations in the degree of saturation and the hydraulic hysteresis, in which the elastic and elastoplastic regions can be vividly captured. The higher the suction level, the more stretched the elastic region, highlighting the suction-induced effects on the lateral pressure variation with vertical stress; moreover, the increase in suction results in lower values for the at-rest earth pressure coefficient. Finally, the effect of the hysteresis phenomenon and cycles of drying–wetting on the at-rest pressure coefficient was examined. The effect of drying–wetting cycles was assessed in terms of a new quantity, the so-called degree of hysteresis in K0. The results indicate that the earth pressure coefficient is highly dependent on the hydraulic path as well as the drying–wetting cycles, where a considerable reduction in the degree of hysteresis in K0 was observed during the second cycle of drying–wetting and this reduction is more prominent in the samples of lower density.
1 Introduction
Due to its paramount importance in the design of earth-retaining walls and piles, the determination of K0 has been the subject of several studies in recent years. In addition to infrastructures such as buried pipelines, with the advancement of technology, the rapid advent of autonomous vehicles and different rovers, knowledge of at-rest pressure becomes essential in applications such as designing navigation and locomotion systems for autonomous vehicles at the time of repositioning, particularly for estimating robot- and wheel-soil interactions [3-5]. Given the importance of determining the at-rest pressure coefficient in the design of various earth structures, several studies in the literature have investigated its estimation from experimental and numerical points of view [6-13], most often focused on saturated soils. However, top-soil layers are not always dry or saturated. Notably, global warming, greenhouse gas emissions, and climate change have introduced new engineering challenges [14-16]. The design of resilient earth structures, which can withstand various environmental conditions in an increasingly volatile climate—ranging from prolonged droughts to more frequent and intense rainfall events—demands accurate estimations of the effect of saturation change on the stress states within soil and earth structures. The mechanical and hydraulic properties of unsaturated soil vary with the changes in the saturation level [17-20].
Comparing Equations (2) and (3), one should note that a K0 definition based on the total stresses would be proper for defining the boundary conditions, while linking the constitutive variables, an effective stress definition is the suitable approach.
Pirjalili et al. [26] investigated the suction-induced changes in lateral pressure for two unsaturated soils, namely, Firouzkouh Clay and Sand-Kaolin mixture, through a developed flexible ring together with horizontal strain gauges. It was observed that the coefficient of the lateral soil pressure continuously decreases with an increase in the matric suction value. Sliva et al. [27] investigated the changes in the coefficient of earth pressure in an unsaturated colluvium soil (a residual soil typical of tropical regions) and studied the saturation dependency of coefficient. In addition to laboratory research, Zhang et al. [28] conducted a numerical study based on the Barcelona Basic Model (BBM) to further examine the unsaturated K0 coefficient. For this purpose, unsaturated oedometer laboratory results were utilized to calibrate the model parameters. It was observed that in oedometric loading and at the transition of elastic to elastoplastic conditions, the slope of the stress path (consequently, K0 coefficient) is expected to vary.
While a limited number of studies have been conducted to investigate the changes in K0 in unsaturated soils, they have yielded noteworthy results. Nevertheless, it should be acknowledged that certain aspects of the changes in unsaturated soils have been overlooked. Among such aspects, one can refer to the effect of drying and wetting cycles, which occur predominantly in nature, on the at-rest coefficient, which has not been investigated. Given the labor-intensive and time-consuming nature of unsaturated soil experiments and the special design they need, numerical modeling is perceived to be an appealing alternative. Within numerical modeling approaches, the discrete element method enables direct implementation of granular physics, such as unsaturated flow and the implementation of capillary forces at the particle level.
The discrete element method, introduced in the field of granular materials by Cundall and Strack [29], provides a great platform to model soil as a granular medium and its deformation due to interactions with earth structures, such as retaining walls. This method has recently been further developed to model the mechanical behavior of unsaturated soils [30-35]. Li et al. [36] simulated the triaxial test on an unsaturated silty soil. In this study, the capillary forces proportional to suction were applied in the model. Despite the significant advancements made in the discrete modeling of unsaturated soils, only a very few studies model a three-phase system consisting of particles, water, and air and account for the air invasion through the soil's porous skeleton. That is, in most of the previous studies, capillary forces are randomly assigned to the soil grains, or a random distribution of total water content in the form of capillary bridges between the grains is assumed, which can lead to deviation from reality [37]. As an alternative solution, pore network modeling methods can be coupled with the discrete element technique to provide a rather realistic depiction of soil unsaturation and a more precise simulation of unsaturated soil hydromechanical behavior [37-39].
Portraying soil structure as a network consisting of two distinct elements, namely pores and throats, the pore network modeling approach is a technique that can simulate two-phase flow inside the soil void space at a low computational cost [40-48]. It provides a suitable computational tool for simulating a deformable porous medium, as the soil pore network can be extracted from the grain packing and can dynamically be updated during soil deformation [37, 39]. Therefore, the hybrid model incorporating the discrete element technique and pore network modeling enables a more realistic and precise characterization of unsaturated soil hydromechanical behavior. This approach was employed by Nikooee et al. [49, 50] to investigate the unsaturated soil properties, such as the relationship among suction, saturation, and interfacial area, with a more realistic depiction of the internal soil porous structure. Chalak et al. [51] investigated the effective stress relationship for unsaturated soils and compared the coupled pore network-discrete element technique and thermodynamic approaches. Sweijen et al. [38] examined the porosity dependence of capillary–saturation relationships through the same approach. Li et al. [52] inspected the effect of grain size distribution and particle shape on the soil water retention curves by a PNM-DEM approach. However, to the authors' knowledge, this approach has not yet been used to investigate the lateral earth pressure in unsaturated soils. Particularly, the effect of the hysteresis phenomenon on the saturation dependency of the at-rest coefficient has not been examined in previous studies from a discrete element technique perspective. In this study, a coupled discrete element-pore-network model is employed to investigate the saturation dependency of the at-rest coefficient and particularly to examine the influence of the drying–wetting cycles on the at-rest pressure coefficient. Unsaturated oedometer tests under constant suction are simulated and assessed against the experimental results for sandy soil. Next, the effect of the hysteresis phenomenon on the values of the at-rest coefficient is examined by determining the at-rest pressure variation under drying and wetting conditions. The obtained insights would envision the design procedures and design peculiarities, particularly pertinent to constructing earth-retaining structures dealing with unsaturated soils. The K0 definition presented in this study is intended to be utilized in geotechnical engineering applications to evaluate in situ total stresses for at-rest conditions; thus, it is formulated based on the total stress values obtained through numerical simulation at different suction values.
In the subsequent sections, a brief description of the discrete element model, as well as the pore network model, is presented. It is followed by the computational procedure, results, and discussion of the main findings.
2 Methodology
and specify the translational and angular velocities, and stands for the torque acting on the particle due to its interaction with the neighboring particles. and are material properties of the individual particles, representing the mass and inertia, respectively.
The consideration of only normal and tangential forces among particles can simplify the modeling process, and thus, in recent years, researchers [58] have emphasized the importance of this principle in modeling and have been drawn to the use of more innovative contact laws [59]. It can be argued that the complexity of a contact law does not necessarily result in improving the simulation's correspondence to reality. Therefore, a contact law should not only strive to maximize its resemblance to real conditions but also possess simplicity and reasonable computational cost.
3 Contact Law
The effect of grain shapes can be considered through different techniques in discrete element modeling. When direct knowledge of particle shapes and their distributions is available, particle clumping can be employed to form particles of different shapes [60]. However, accounting for complex geometrical shapes is computationally demanding, and it needs imaging data. An alternative approach is to use rolling resistance in an effort to account for particle shape effects, as supported by studies such as those of Zhou et al. [61] and Wensrich and Katterfeld [62]. Therefore, in the current study, the effect of particle shapes was incorporated through the use of rolling resistance (i.e., rolling friction). The coefficient of rolling friction is defined based on the energy dissipation associated with relative rotation between particles in contact. The particle shape, and consequently, the rolling friction coefficient, particularly controls the mechanical response in terms of peak shear strength. Laboratory results of Oda et al., along with those of Iwashita and Oda, demonstrate that the rolling resistance, a phenomenon originally induced by particle shape, is a crucial and significant micromechanical effect to be considered, especially when there is a considerable effect of friction among particles [63, 64]. According to their findings, rolling plays a more significant role than sliding in interparticle contact behavior and, consequently, macroscopic behavior (e.g., the deformation of the granular medium).
In this equation, is the dimensionless rolling coefficient and RA, RB and Ks are selected and defined as Equation (7). Among different contact laws [66-68], the MTL contact law has few parameters and, thereby a low computational cost while accounting for particle shape effects; hence, MTL was used in this study.
4 Pore Network and 2PFV-DEM Model
An unsaturated soil element can ideally be conceptualized as a three-phase system consisting of soil, water, and air. Simulation of unsaturated soil can thus be carried out using various methods, one of which is the use of pore-scale methods. The pore network modeling directly simulates the fluid flow in the so-called throats (connecting adjacent pores) and the retention of fluids inside different pores. The pore network is extracted from the void space within grains using mathematical methods such as different tessellation techniques.
The classical methods utilizing continuum mechanics usually consider the effects of fluids through empirical relationships, such as soil water retention curves and relative permeability, and their evolution with strain. The first pore network modeling study was carried out by Fatt [69] in the field of petroleum. The major advantage of this method is its use of separate equations defining the fluid phase in addition to the equations related to the solid phase. In other words, while discrete element modeling captures solid deformation, at each iteration, the soil porous skeleton is extracted and updated. In the case of unsaturated soils, air invasion is then modeled within the pore network; thereby, the saturation of pores is updated, and the unsaturated hydromechanical behavior is simulated.
Yuan [70] assumed that on the micro-scale, the movement of a solid grain is formulated by Newton's law of motion by combining solid motion equations with fluid equations. The so-called 2PFV-DEM was proposed to simulate the drainage process inside a granular medium. In this approach, to extract the pore network from the granular packing, the soil pore space is divided into different tetrahedra through the regular triangulation technique. Each tetrahedron is considered a pore unit, and their intersection specifies the throat connecting pore units [71]. According to regular triangulation, a pore is considered to be surrounded by four solid spheres, the center of each of which is the apex of the tetrahedron. This model has been successfully employed for simulating drainage in granular materials within the YADE-DEM computational platform by Yuan [70]. The major advantage of the model is in its use of the different equations defining fluid phases, namely, water and air, as well as taking into account the effect of the fluid phase on the solid phase at a low computational cost. For a detailed explanation of the different pore network extraction techniques and the 2PFV-DEM framework, the reader is referred to Hosseinkhani et al. [37] and Yuan [70]. In this study, the 2PFV-DEM framework was used to simulate unsaturated soil under constant suction to obtain the at-rest pressure coefficient at different degrees of saturation.
5 DEM Modeling
5.1 Studied Soil Type
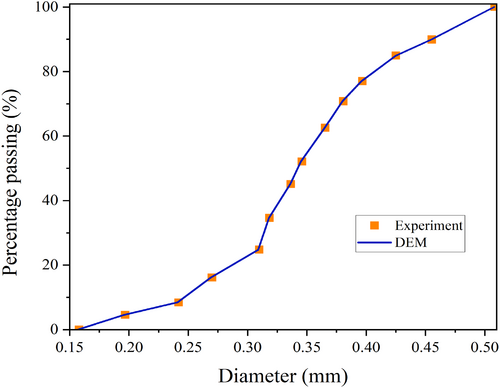
The sandy soil studied in this research is Hostun sand, named based on its original location in southeast France. The main mineral of this soil is silica [72], based on which the contact properties of grains were selected, as indicated in the subsequent sections. The median grain size of the studied soil, D50, is equal to 0.34 mm [73]. Other physical and basic properties of Hostun soil are presented in Table 1. Figure 1 shows the DEM particle distribution curve compared to the experimental one, which represents the agreement between the two. The closer the grain size distribution produced in DEM packing to the real soil sample, the better the virtual sample will replicate the internal structure of the real soil sample, and thereby, more precise estimations of the soil water retention curve can be achieved when simulating the drying curve.
| Soil property | Value |
|---|---|
| Classification (USCS) | SP |
| Coefficient of curvature Cc | 1.11 |
| Coefficient of uniformity Cu | 1.5 |
| D50 (mm) | 0.34 |
| Specific gravity | 2.65 |
5.2 DEM Sample Preparation and Modeling Stages
There are two different approaches to prepare the sample numerically satisfying a desired void ratio and considering a specified number of particles, namely, cloud dynamic compaction [74] and radius growth [75, 76]. In cloud dynamic compaction, the sample preparation is performed by compacting a cloud of nonoverlapping particles until reaching the target void ratio, where confining walls move inward to compact the particles until the target confining stress is reached. A Similar procedure has been used in previous studies [37, 77, 78]. This method better replicates the experimental procedure, where confinement is typically applied through external boundaries rather than radius growth. Additionally, this approach allows for the natural rearrangement of particles, leading to a more realistic distribution of voids (i.e., throat and pore size distributions) and interparticle contacts [37]. In the current study, the goal is to conduct an oedometer test under constant suction. The closer the internal pore structure is to the real sample, the better the effect of suction on hydromechanical behavior can be captured. That is why the cloud compaction technique was preferred and used in this study.
In the process of the initial sample construction phase and to ensure that particles come into equilibrium, Kuhn et al. [79] recommendation was followed, which implies that the unbalanced force ratio must be less than 0.001. After sample preparation, the model is ready to be used for modeling oedometer tests in unsaturated and saturated conditions. In order to reach the target saturation, the pore network simulation takes place, where air is invaded from the top boundary. Side boundaries are considered impermeable to air and water. At the bottom boundary, an arbitrary water pressure is applied. The air pressure for the top boundary is calculated based on the experimental suction values so that the difference between air and water pressure matches the suction values applied in the experimental datasets used for model calibration and validation. For details of pore network modeling of soil drainage, one can refer to [45]. After arriving at the target suction value, K0 loading is applied under a constant suction value.
The current study aims to investigate the effect of suction on the K0 values numerically. Although constant water content tests are more prevalent due to their simplicity from the experimental point of view, they may inadvertently allow suction changes during loading, complicating data interpretation [24, 80]. With the advent of data acquisition systems and suction-controlled oedometers, constant suction tests have also been made possible [81]. Since the experimental tests used for model calibration and verification were conducted at constant suction [73], numerical simulations were also performed under this condition.
5.3 REV
The concept of a representative elementary volume (REV) is critical in discrete element modeling (DEM) of soils, as it ensures that the selected volume adequately captures the material's macroscopic behavior. Consequently, an accurate determination of the REV is essential for reliable simulations. Various methods have been proposed in the literature to define the REV [52, 82], each addressing specific aspects of the soil's mechanical response.
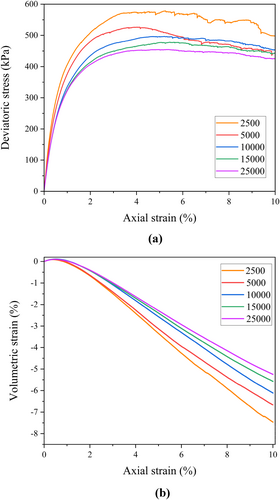
In this study, the total number of particles corresponding to constructing the REV was determined by examining the variations observed in the simulated stress–strain behavior of the drained triaxial compression test on Hostun sand and checking the invariancy of the stress–strain behavior (within a specific range) with the increase in the number of particles. To this end, the drained triaxial test simulations of Hostun sand were employed, and the simulations were performed by considering a particle range of 2500–25,000. Figure 2 compares deviatoric stress versus axial strain curves for the samples comprising different particle numbers. From Figure 2, it can be noted that there is negligible change in the stress–strain results and volumetric response with the increase in the number of particles surpassing 15,000; therefore, a cubic sample containing 15,000 particles was chosen as the REV for the soil under study. This choice of REV conforms with the recommendations of Li et al. [52], Salot et al. [82], and Clausnitzer and Hopmans [83] on the size and number of particles for suitable REVs.
5.4 DEM Parameters Calibration and Validation
The modeling framework of this study incorporates five parameters. Among these, the particle elastic modulus and Poisson's ratio directly influence the mechanical behavior of individual particles. These parameters, as described by Equations (6) and (7), are essential in defining the normal and tangential forces that act between particle pairs. The dimensionless parameters and are utilized in this study to account for the rolling resistance. As discussed earlier, these parameters are used to model the roughness between particles. Parameter calibration can be performed by different approaches; in this study, the method recommended by Aboul Hosn et al. [78] was adopted. To assess the influence of each parameter, the simulated results from drained triaxial tests on Hostun sand were compared with the experimental data reported by Lancelot et al. [84], while the influence of each parameter was captured by varying its input value while keeping the other parameters constant, allowing its specific impact on the results to be assessed. Using this approach, calibrated contact parameters were obtained. The particle elastic modulus, indicating the stiffness of each particle, inversely affects the initial slope of the two-dimensional deviatoric stress versus axial strain curve. Therefore, the particle elastic modulus was selected so as to match the initial slope of the experimental stress–strain curve. Additionally, following previous studies (e.g., [78]), the rolling friction coefficient () was derived based on the maximum laboratory-measured friction angle (). Table 2 displays the calibrated parameters based on the results of the triaxial experiment simulations.
| Parameters | Value |
|---|---|
| Particle stiffness (MPa) | 350 |
| Interparticle friction angle φc (°) | 21 |
| Poisson's ratio | 0.1 |
| Rolling stiffness coefficient () | 2.0 |
| Plastic rolling coefficient () | 0.55 |
| Particle density () | 2600 |
| Number of particles | 15,000 |
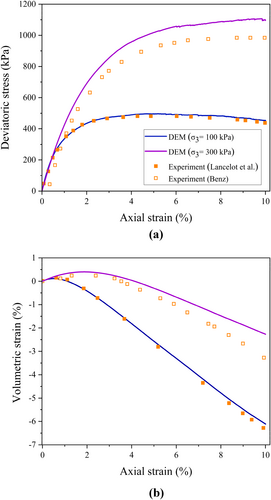
The validation of the model calibration was performed through deviatoric stress-axial strain results and volumetric response of the sample Hostun sand under triaxial drained condition based on other experimental datasets of Hostun sand, from Benz [85] performed under a different stress level (i.e., ). Figure 3 presents the results of the triaxial test simulation based on the calibrated parameters, indicating fairly reasonable agreement between the simulation and the experimental data. The calibrated parameters were used to model the oedometric response of an unsaturated sample during drying and wetting tests as well as the post-hysteresis hydromechanical response of the samples (i.e., the unsaturated oedometer tests were simulated after drying–wetting cycles).
6 Result and Discussion
6.1 SWRC
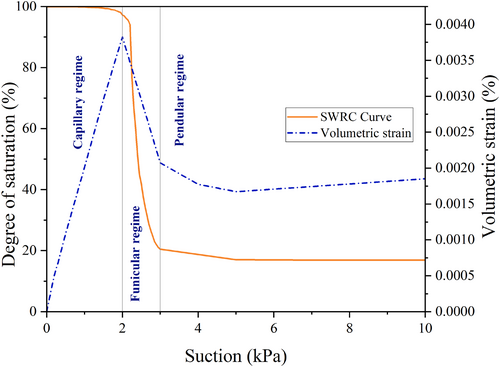
The soil-water retention curve (SWRC) is crucial for analyzing the hydromechanical behavior of unsaturated soils. When the SWRC closely aligns with experimental data, it indicates that the pore network and pore throat distribution within the sample have been accurately represented. A comparison between the simulation results and the experimental data reported by Lins and Schanz [73] is illustrated in Figure 4. The simulation results reasonably reflect the saturation change with suction in the experimental data. Particularly, it gives a good estimation of the air entry value (the transition between capillary and funicular regimes). There is some discrepancy in simulating wetting retention data, which roots in the fact that there are several two-fluid phase displacement mechanisms that have to be carefully incorporated in modeling the wetting curve to achieve the most accurate simulations. Similar to previous studies [38], the so-called snap-off and cooperative filling mechanisms have not been considered [41, 47] to reduce the computational cost and complexity of the model. Furthermore, phenomena such as corner and film flow, which can occur in natural soils, have been disregarded due to simplification in pore and throat shapes. Despite these assumptions, the model shows a relatively good estimation of drainage and wetting curves, particularly in the funicular regime, capturing both air-entry and air-expulsion values.
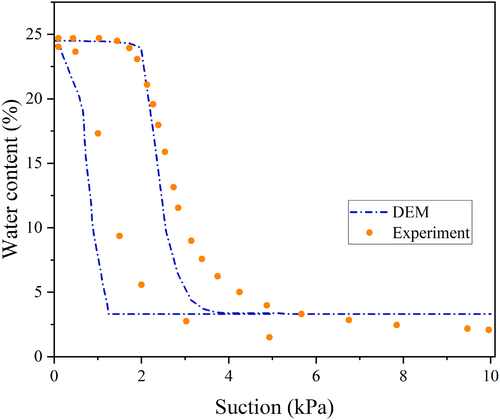
Figure 5 illustrates volume strain variations along the drying path, exhibiting a trend similar to that observed by Yuan and Chareyre [39]. Prior to reaching the air entry value, the sample volume change (with respect to initial sample volume) monotonically increases, noting that contraction has been denoted with the positive sign, implying that by increasing matric suction, sample volume decreases. Before reaching the air entry value, increasing the suction does not lead to air invasion; however, it results in an increase in the effective stress, consequently leading to sample compression. Beyond the air entry threshold, the matric suction work on the sample is devoted to both sample deformation and displacement of the fluid phase, which consequently causes a decrease in induced volumetric strain. With further increases in suction, particularly within the pendular regime, the volume change stabilizes and remains nearly constant. It is noteworthy that the observed changes in volumetric strain with suction are in accordance with the changes in capillary cohesion. It is determined according to the Lu and Likos [24] equation (), in which the friction angle () is considered constant. Accordingly, capillary cohesion is a function of both the effective stress parameter () and suction (). The capillary cohesion increases with suction until a threshold value, after which a sudden decline is observed. The change in capillary cohesion has also been reported by previous studies [86-88].
6.2 Simulation of Unsaturated Oedometer Test
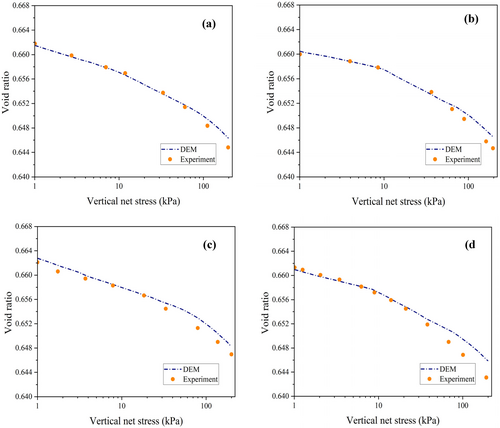
Figure 6 compares the odometer results at different suction values, namely, 1.5, 3, 20, and 50 kPa, with the experimental observations [73]. The changes in void ratio observed during vertical loading agree fairly well with the experimental results reported by Lins and Schanz [73] for Hostun sand, indicating that DEM simulation can be used as a virtual laboratory for estimating the at-rest pressure coefficient at different suction values. Another important aspect of having a digital twin of the oedometer test is that certain aspects, not easily measurable in the laboratory, can be captured through simulations (e.g., horizontal stresses during vertical loading can be monitored, giving valuable insight into the lateral pressure coefficient).
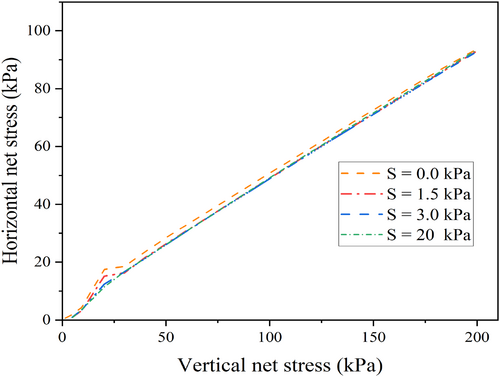
Therefore, the variation in horizontal net stress obtained from saturated and unsaturated oedometer simulations at constant suction values of 1.5, 3, and 20 kPa is presented in Figure 7, showcasing the detailed stress evolution within the sample during oedometer loading. As seen in Figure 7, a nonlinear trend in the stress path is observed initially, after which the stress path approaches linear behavior by increasing vertical stress. This observation illustrates the progression from elastic to elastoplastic behavior. Figure 8 presents the stress path in terms of deviatoric stress versus mean net stress during oedometer loading, where a similar behavior is detected. It is apparent that at low vertical stresses, the path indicates elastic behavior; however, as the load increases, a yield point is reached, signaling the transition to elastoplastic behavior (T point). The stress path transitions appearing in Figures 7 and 8 highlight that at lower vertical stresses, the horizontal net stress within the soil is comparatively high. With increasing vertical net stress, the slope of the stress path diminishes, which is indicative of a reduction in the respective horizontal stress for all suction levels. Additionally, these figures clearly demonstrate the effect of suction on the stress path, as increased suction results in decreased horizontal stress at similar vertical loads. Notably, in the pendular regime, no significant change in horizontal stress is observed (i.e., as seen in Figures 7 and 8, similar results are observed at suction values of 3 and 20 kPa, both in the pendular regime).

The behavior of the stress path under oedometer loading is further elucidated in Figure 9 by comparing at-rest pressure coefficient variations with vertical loading at different suctions. As can be seen in Figure 9, there is a transition point (T), where the at-rest pressure coefficient peaks before stabilizing, suggesting a transition from elastic to elastoplastic behavior, as indicated earlier. This figure demonstrates the reduction in the peak at-rest pressure with the increase in suction, a pattern that correlates with the variation of the stress path shown in Figure 7, where horizontal stress shows a slight decline with increased suction. In addition, Figure 9 indicates that as suction increases, the elastic region broadens, implying that greater vertical stress is required to reach the non-elastic zone. In other words, as the suction level rises from 0 to 20 kPa, the transition point (T) shifts rightward, requiring greater vertical stress to reach the non-elastic region.

It should be noted that the K0 values reported in this figure are plotted after sample construction and suction imposition (during the K0-loading condition where vertical stress is increased incrementally).
6.3 Drying-Wetting Cycles and At-Rest Pressure Coefficient
Hysteresis effects on the soil oedometric response have rarely been investigated in previous studies. However, drying–wetting cycles, common in natural conditions, may significantly impact the at-rest pressure coefficient (K0). To gain a deeper understanding of at-rest pressure behavior in an unsaturated oedometer test, the behavior of a soil sample after drying–wetting cycles was examined. Therefore, Figure 10 compares the oedometer test results for a fully saturated sample and a sample that has undergone two drying–wetting cycles. As can be seen, the variation range in void ratio significantly decreases after the two cycles, indicating an increase in soil stiffness. Also, the unloading slopes for these two conditions exhibit distinct slopes from the reloading one, potentially attributed to kinematic hardening, as discussed by Esfandiari et al. [89].
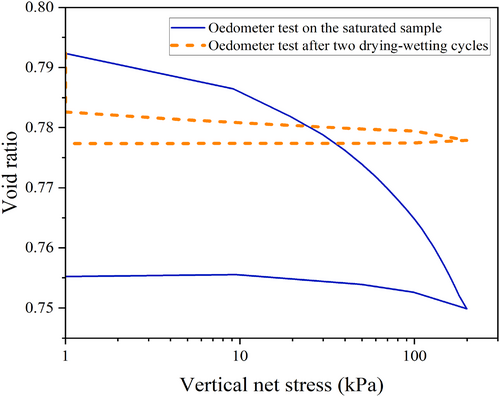
Figure 10 indicates that as the sample experiences drying–wetting cycles, the preconsolidation stress increases, and the elastic behavior range widens. The results clearly demonstrate that the occurrence of two drying–wetting cycles enhances soil stiffness. It is, therefore, expected to have differences in at-rest pressure coefficient values after wetting–drying cycles.
Figure 11 illustrates the variation in the at-rest pressure coefficient throughout the two considered drying–wetting cycles. The overall trend reveals a progressive decrease in the at-rest pressure coefficient over the course of these two cycles. Prior to reaching the air entry value for Hostun sand (2 kPa), the coefficient decreases sharply. Upon entering the pendular regime, the at-rest pressure exhibits a slight increase and then stabilizes, remaining constant thereafter. The declining trend of the at-rest pressure coefficient with suction in the drying path can be explained based on the results of volumetric strain with suction, presented earlier in Figure 4. From this figure, one can understand that before reaching the air entry value, a reduction in volume leads to a lower at-rest pressure coefficient. However, as suction increases beyond this point, minor volume expansion occurs, causing a slight increase in the coefficient.
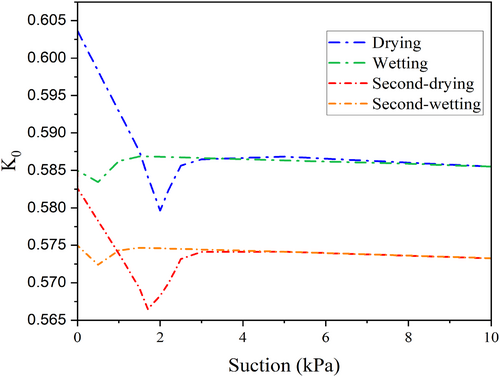
The effect of the wetting path is also simulated, as shown in Figure 11. As clear from this figure, the variation of the K0 coefficient with suction is generally the same after the 1st drying, 2nd drying, 1st wetting, and 2nd wetting paths. However, during the second cycle, the variation in K0 is reduced compared to the first cycle, suggesting an increase in sample stiffness due to the effects of suction. This figure highlights the dependency of the at-rest pressure coefficient on the hysteresis phenomenon, a topic that has rarely received much attention in previous research.
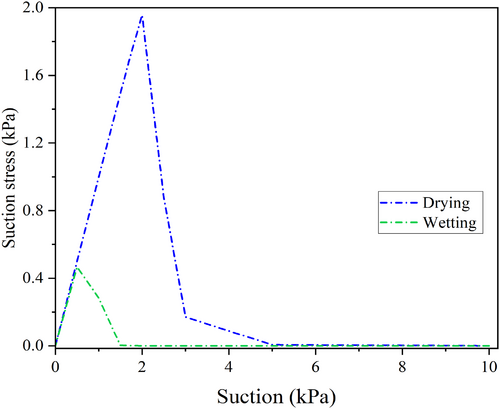
Given that both the first and the second cycles follow a similar pattern, it is sought to explain the reasoning behind the observed trend in Figure 11. For this purpose, suction stress is calculated by multiplying suction with the effective stress parameter (χ), assuming this parameter is equal to the effective saturation (). Figure 12 presents the relationship between suction stress () and suction for the first cycle. According to Figure 12, suction stress increases initially before the air entry value is reached; beyond this point, it begins to decrease sharply, a pattern consistent with the behavior of sandy soils as described by Lu and Likos [24]. Prior to air entry, the at-rest pressure coefficient shows a downward trend. It is attributed to an increase in the suction stress within the sample, causing a decrease in the at-rest pressure coefficient. On the contrary, as suction stress begins to decrease, the at-rest pressure exhibits an upward trend. This increase can be interpreted as a response to the reduction in suction stress, as the sample saturation regime transits from the capillary regime to the funicular regime. During the wetting path, the at-rest pressure coefficient experiences a slight decrease, correlating with the initial increase in suction stress shown in Figure 11 (from 2 to 0.5 kPa), until a peak value in suction stress is reached. Eventually, by increasing saturation, a sudden drop in suction stress is observed (as suction approaches zero), which explains the ultimate slight increase in the unsaturated K0 at low values of suction in the wetting path.
A detailed discussion of the results is thoroughly performed in the subsequent section, where the underlying mechanisms are explored, and the results are compared with existing literature to further highlight the effect of hysteresis on the oedometric response of unsaturated soils and the implications of these findings in real-world applications.
6.4 Discussion
6.4.1 Nonlinear K0 Stress Path
The nonlinear K0 stress path identified in the simulations of this study (Figures 7-9) can also be observed in the experimental data of oedometric behavior reported in the literature [10, 12, 26, 90, 91]; however, it has often been overlooked. The observed trend indicates that the change in horizontal stress does not linearly vary with vertical stress under at-rest pressure conditions, particularly at small strain levels. Such knowledge would be of importance in designing earth structures experiencing small strains.
6.4.2 Impact of Suction on K0: Drying Path
As can be seen in Figure 11 (section 5.2), the at-rest pressure coefficient in the unsaturated condition attains lower values than the saturated state, which agrees well with the limited experimental data present in the literature [26, 92]. Zhang et al. [28] calibrated the parameters of the Barcelona Basic Model (BBM) using the experimental results of Rampino et al. [93] from unsaturated oedometer tests for silty sand and predicted the at-rest pressure coefficient. The results of their study exhibit a remarkable similarity to those of the current research, in which the initial or elastic zone can clearly be discerned from the final elastoplastic zone, separated through a transitional zone. These three stages, as observed in the current study, are highlighted in Figure 13.
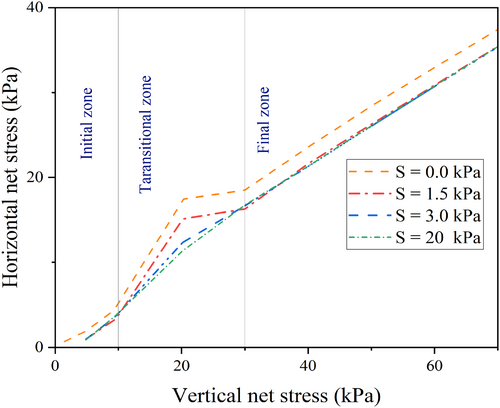
The observed reduction in the at-rest pressure coefficient (Figure 13) may be attributed to an increase in the hardness of the sample. Furthermore, Lu and Likos [24] have also demonstrated the trend of changes in the at-rest pressure coefficient under different suction levels for sand, which is similar to the results of this study. The reverse relationship between suction and the at-rest pressure coefficient exhibits significant implications for engineering applications, particularly where the changes in the water table behind the retaining walls are concerned. Such changes in the water table are more frequent due to rapidly changing climatic conditions.
6.4.3 Impact of Suction on K0: Wetting Path and Hysteresis Phenomenon
6.4.4 Scope of Application of the Method, Limitations, and Future Research
This paper studied the at-rest pressure coefficient under unsaturated conditions and the effect of the hysteresis phenomenon. The results indicated that the at-rest pressure coefficient depends on the degree of saturation, and taking it constant in the design of geotechnical structures can cause errors in the calculations. Furthermore, it demonstrated that soil stiffness changes during drying–wetting cycles eventually affect the K0 coefficient, potentially influencing design scenarios. Although some studies, such as Kumar et al. [96], have recently indirectly examined the effect of saturation change on the at-rest pressure coefficient, noting that ignorance of the examination of the at-rest pressure coefficient with the change of degree of saturation causes a lot of error in calculating value and reciprocity in the design, it can be generally noted that this issue has not received the attention it deserves, and further research needs to be performed. Last but not least, this study investigated the at-rest pressure of a coarse-grained soil, namely, Hostun sand. Numerical modeling of the unsaturated at-rest pressure in fine-grained soils is encouraged, which needs to account for peculiarities pertinent to such soils, particularly their considerable volume change under drying–wetting and the presence of adsorbed water and capillary water.
This study considered the effect of particle shape through rolling coefficient, as it is a computationally efficient and widely accepted approach to approximate the mechanical response of non-spherical sand grains in DEM simulations. However, it should be acknowledged that rolling resistance alone does not fully replicate all shape-dependent behaviors, such as compressibility and non-coaxiality. Future studies based on imaging data of real particle shapes and approaches, such as particle clumping, are encouraged.
The method used in this study does not suit very loose soil samples (with a relative density of lower than 20%), as these soils often include several macro-pores adjacent to each other, which are not suitably characterized by the tessellation technique used in the current study. Therefore, findings are not generalized to soils of very loose structure.
Finally, it is notable that K0 coefficient values analyzed in the study are determined based on the total stress definition. They are, therefore, suitable for geotechnical engineering applications to evaluate in situ total stresses for at-rest conditions—by considering these stresses as boundary conditions for construction engineering. However, an effective stress-based definition for K0 would be the most proper and rigorous form for constitutive relationships. Although experimental studies indicate that the K0 coefficient values obtained using an effective stress-based definition can take similar variations with suction to those defined based on total stress [26, 92], such findings may hold true in experimental and field conditions, where suction values are much lower than the applied net stress. Therefore, further studies based on the effective stress definition of K0 are highly encouraged.
7 Conclusion
This study investigated the oedometric response of unsaturated soil using the discrete element method (DEM) and pore network modeling (PNM) frameworks. The soil pore network obtained from the discrete element model was employed to simulate cycles of drying and wetting, and the pore-scale hydromechanical model allowed us to examine the effect of hysteresis on the at-rest pressure coefficient (K0). The effects of hysteresis on the at-rest pressure coefficient have rarely been studied in the literature. For this purpose, triaxial tests on Hostun sand were used for discrete element model calibration. Next, air invasion into the soil pore network was simulated, and at each experimental suction level, the constant suction unsaturated oedometer tests on Hostun sand were simulated, which indicated the reasonable accuracy of the model for capturing experimental results. Subsequently, the soil packing was subjected to cycles of drying and wetting, and the oedometric response of the soil was investigated.
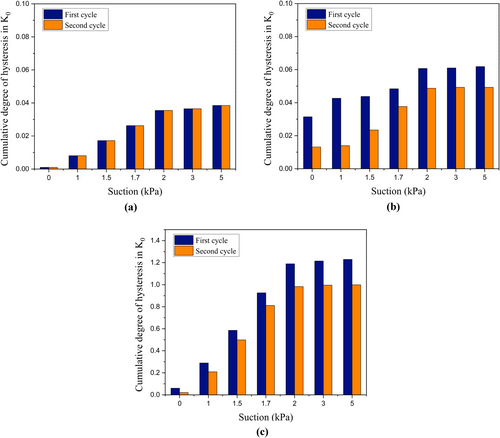
The results highlighted the dependency of the at-rest pressure coefficient on the saturation. In addition, hysteresis (path dependency) was observed in the values of at-rest pressure during different hydraulic paths and cycles. A new quantity, the so-called degree of hysteresis in K0, was proposed, which revealed the reduction in hysteresis in K0 by increasing cycle numbers. It was speculated that as the sample undertakes drying–wetting cycles, the net effect is sample stiffening and, thereby, a reduction in K0 hysteresis. This reduction is more pronounced at low suction values.
- The at-rest pressure coefficient, interpreted by the slope of lateral stress versus vertical stress, does not extend linearly during oedometer loading and can be examined by a different slope. In other words, the results of the unsaturated K0 stress path simulation demonstrated three zones in the at-rest pressure stress path.
- Due to the increase in suction level in the soil, changes in soil behavior from elastic to elastoplastic occur at higher stresses.
- When soil stiffness increases in the sample owing to the increase of suction level, lateral stress and, correspondingly, the at-rest pressure coefficient decrease.
- The drying path results in a reduction of the at-rest pressure coefficient, while the wetting path at comparable suction levels leads to an increase.
- As the sample undergoes drying–wetting cycles, hardening occurs, which reduces volume changes and lowers at-rest pressure variation after a single cycle.
This research focused on hysteresis effects on the at-rest pressure behavior of sandy soils, a subject that has received limited numerical attention in the literature. While a pore-scale hydromechanical model utilizing DEM and PNM models gave valuable insight into the variation of the at-rest pressure coefficient under different hydraulic paths, a comprehensive understanding of this phenomenon, which is prevalent in numerous engineering contexts, requires further experimental and numerical exploration. Particularly, the extension of the model to fine-grained soils, which requires accounting for their mineralogy and distinguishing between adsorbed and capillary water, is encouraged for future studies.
Author Contributions
Hossein Ansari: software, visualization, investigation, validation, formal analysis, writing – original draft, writing – review and editing. Ghassem Habibagahi: supervision, writing – review and editing. Ehsan Nikooee: supervision, conceptualization, methodology, software, formal analysis, writing – original draft, writing – review and editing, project administration.
Acknowledgments
The authors would like to pay tribute to late Professor Tom Schanz of Ruhr-University Bochum for his lifelong dedication to unsaturated soil mechanics and several experimental datasets left after his studious, rigorous, and valuable experimental research.
Conflicts of Interest
The authors declare no conflicts of interest.
Open Research
Data Availability Statement
The data that support the findings of this study are available from the corresponding author upon reasonable request.


