Interface-Based Parallel and Multi-Rate Real-Time Simulations for Thermal-Electric Systems
Funding: This work was supported by Science and Technology Project from the Powerchina Huadong Engineering Corporation Ltd., China (KY2023-XNY-02-25).
ABSTRACT
The integrated energy system (IES) comes out with significant advantages in reducing carbon emissions and improving energy efficiency. However, the complicated electrothermal couplings in the IES operations pose significant challenges to dynamic process simulation. To inquire into the dynamic electrothermal coupling characteristics, a bidirectional coupling multi-rate real-time simulation method for the thermal-electric systems (TESs) based on the functional mechanism is proposed to depict the dynamic interaction process between the subsystems. The stability of the multi-rate simulation method is proved by small signal analysis. Then, a real-time dynamic simulation platform for the TESs is developed, which is utilized to verify the effectiveness of the proposed method in thermal power tracking and electrical power tracking modes. The simulation results validate that the proposed multi-rate simulation method for the TESs in this paper can effectively reflect the dynamic process and enhance the simulation efficiency.
1 Introduction
1.1 Background and Motivation
Integrated energy systems (IES) are a renewed concept of power systems, which efficiently utilize multiple energy sources, such as gas energy [1], thermal energy [2], and so forth, reduce carbon emissions, and also improve the reliability of energy supply [3]. Recently, heat-electricity IES [4] composed of multiple interconnected microgrids with combined heat and power (CHP) and renewable energy systems has been proposed. In a practical thermal-electric IES (TE-IES), different operational modes, such as the thermal power tracking mode and the electrical power tracking modes [5], will bring about dynamic and multi-time scale interactions between heat and electricity systems. In determining power by heat mode, the generated electric power of CHPs is transmitted to the electric systems, which are governed by the thermal controllers. In the determined heat-by-power mode, the CHP will reabsorb the heat power through a heat recovery steam generator (HRSG), and the air conditioner/the electric heat pump can transfer the electric power into the heat power hereafter [6]. However, to study the interactions between heat and electricity systems, the parallel and multi-rate simulations, even the real-time simulations of multiple thermal and electric components in a TE-IES become an urgent requirement.
1.2 Related Work
Previously, many research works on IESs mainly focused on the steady-state analysis of IESs, the optimization model of the IESs [7], and the market mechanism analysis of IESs [8], and so forth. Specifically, a game theory-based optimization model is established in References [9, 10] to improve the bidding scheme on the energy supply side. In References [11, 12], the probabilistic optimization technology is applied in multi-energy modeling for IESs. Only in Reference [13], the dynamic model of the thermal pipeline is modeled as a constraint of the optimization model, where the interactions between different thermal nodes are reflected by the thermal nodal equations.
Recently, the pursuit of accurate dynamic simulations of TE-IES has attracted many researchers' attention. For example, in Reference [14], a typical component in IESs, or the proton membrane battery, is completely modeled in PSCAD/EMTDC by being represented as discrete control units. However, the computational burden will become amazingly unacceptable if we would like to simulate such a single component in PSCAD/EMTDC for several minutes due to the tiny timestep, such as 50 μs. Of course, if we simulate complicated TE-IESs containing gas turbines, heat pipelines, and so forth, such a methodology will not be an ideal solution. In Reference [15], the thermo-dynamic pipeline model is realized based on the discretization of the partial differential equations. However, the simulation results are only utilized for the steady-state simulation results, instead of the required dynamic simulations. In References [16, 17], the dynamic multi-domain simulation based on TRNSYS and MATLAB is realized for heating, ventilating, air conditioning (HVAC) systems, and purely heating systems. However, the interface models between target commercial software TRNSYS and any electric software have never been touched before. In Reference [18], a decoupling algorithm for a large-scale thermoelectric coupling network to improve the calculation efficiency is proposed. Unluckily, the required dynamic responses between different thermal components are not reflected. The multi-rate calculation is an efficient method for stiff ODEs [19, 20], and many attempts at multi-rate simulations have been adopted for electric power systems [20], such as multi-rate electromagnetic transient (EMT) simulations [21, 22], to accurately and efficiently simulate the multi-time scale dynamics of electric power systems.
1.3 Limitations
- Previous research works mainly focus on the steady-state simulations of the TE-IES, instead of reflecting the required mutual heat–electric interactions. In other words, the interactions between thermal and electric systems require accurate thermal system-to-electric system interfaces (T-to-E Interfaces) and electric system-to-thermal system interfaces (E-to-T Interfaces).
- The salient multi-time scale dynamics of the so-called TE-IES require an accurate and efficient multi-rate simulation methodology. Admittedly, the so-called multi-rate simulation models have not yet been applied to co-simulations of multiple energy systems.
- Whether the dynamics of the heat supply network will have an impact on the power grid dynamics is an emerging research topic, which attracts both the academic and industry's attention. Very few studies have evaluated the coupling mechanism of dynamic responses in integrated energy systems [23-25].
1.4 Contributions
- The functional and coupled thread interfaces between thermal and electric systems are realized, where T-to-E interfaces and E-to-T interfaces are represented as flexible functions, and parameters are calculated in the different and coupled thread to realize the real-time efficiency.
- The multi-rate interface models are set up between heat and electric systems to accurately reflect the dynamic interactions between different systems, where different interface models are proposed to indicate various coupling mechanisms.
- The overall parallel and multi-rate real-time simulations are realized through the proposed multi-rate interface models, combining the simulator of the thermal systems with the RT-LAB by the message bus-based co-simulation communications.
The rest of the paper is introduced as follows: Section 2 details the multi-time scale modeling of the thermal systems; in Section 3, the functions for paralleled and multi-rate real-time heterogeneous simulations are realized and proposed; in Section 4, the real-time dynamic simulation of the TES based on the independent simulation platform provided by this paper and RT-LAB. Section 5 briefs the conclusion.
2 Multi-Time Scale Modeling of Thermal Systems
- The multiple physical processes of energy conversion in TE-IES should be modeled, including complicated ordinary differential and partial differential equations, algebraic equations, and so forth.
- The time scale of the TE-IES can range from a few seconds to tens of minutes, or even hours. The multi-time scale property of the TE-IES will increase the stiffness of the calculations of the whole coupled thermal and electric systems.
- Different coupling mechanisms between thermal and electric systems co-exist, which complicates the modeling of the multi-rate interface models between different systems.
In the TES (see Figure 1), the thermal system mainly includes a gas turbine, a HRSG, a heat exchanger, circulating water pumps, pipelines, and so forth. The mixture of air and natural gas (NG) is burned in the gas turbine. The thermal system operates with a comprehensive energy transfer process: After gas and air are mixed and burned in the gas turbine, the high-temperature gas generated drives the turbine to work and generate electricity. The exhaust gas, as the main heat source of the thermal system, enters the two-stage steam turbine to provide mechanical energy and heat energy for the industrial park. At the same time, the heat energy can be cooled by the absorption refrigerator. The last target of heat energy utilization is to provide heat for the building. When the heat energy is insufficient, the electric boiler will be operated to compensate for the required heat energy.
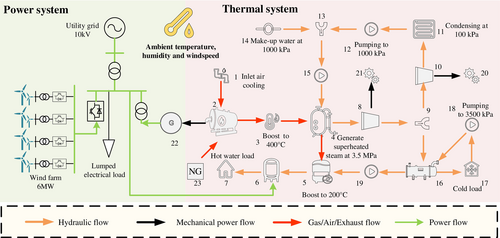
In the electric power system, distributed wind power, synchronous machines, and heat-dominated sources/loads are contained to improve the utilization efficiency of heat and electric energy. The wind turbines are connected to the distribution grid in parallel with maximum power point tracking (MPPT) and PQ control controllers. Thereby, the wind turbines convert the wind energy into electric energy with maximum efficiency.
To realize the overall simulations of TE-IES and further evaluate the coupling mechanism of TE-IES, an industrial zone combining the thermal and electric systems in Figure 1 is taken as an example, where the related multi-time scale modeling of the thermal systems is first detailed below.
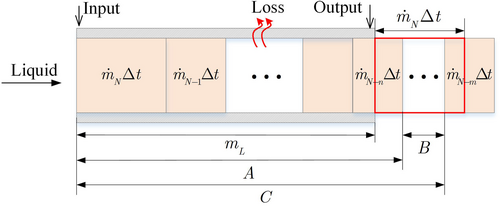
2.1 Pipeline
2.2 Gas Turbine
Many mechanical, electric, and heat components are contained in a gas turbine, such as compressors, turbines, turbochargers, intercoolers, internal combustion engines, and so forth. The mechanical power output by the gas turbine drives the generator rotor, and the exhaust is used as the heat source in the following sections (Figure 2).
- Intercooler model

- Compressor model
For the compressor, the gas in the turbine cylinder is discharged after combustion. The exhaust gas with high temperature and high pressure drives the turbine. The compressor connected with the coaxial turbine compresses the fresh air, which increases the temperature and pressure of the air.
- Turbine model
- Cylinder model
- Turbocharger model
- Turbine dynamics model
3 Functions for Paralleled and Multi-Rate Real-Time Heterogeneous Simulations
The adoption of the TE-IES is a solution with economic and environmental benefits; however, combined modeling and analysis of the dynamics of the heat and electric systems is a tricky and unresolved issue due to the stiff property of the TE-IES. Therefore, this paper aims to provide an efficient, accurate, and reliable method for fast calculation of energy flow in a large-scale TE-IES based on the concept of paralleled and multi-rate real-time heterogeneous simulations. In this section, the whole simulation process is first detailed, and then the key part of realizing the real-time TES multi-rate simulation interface modeling is illustrated. Finally, the stability criterion of how to choose the parameters of the multi-rate interfacing is given.
3.1 Paralleled and Multi-Rate Simulation Process
In the simulations of a stiff system, the unanimous and tiny timestep will lead to unacceptable computational consumption. So, the purpose of the multi-rate interface is to dramatically improve computational efficiency. This paper extends the multi-rate interface model of the power system to the TESs to meet the simulation requirements of the stiff scenario.
Figure 4 shows the structure of multi-rate TES co-simulation. After the heating network and power grid parameters are first initialized, the thermal system and power system are simulated with the large step and small step , respectively, where . The speed and accuracy of the simulation co-simulation can be adjusted by changing the value of n. The interfaces between the thermal system and the power system are realized by a multi-rate one, and the data exchange is carried out in units of thermal system steps.
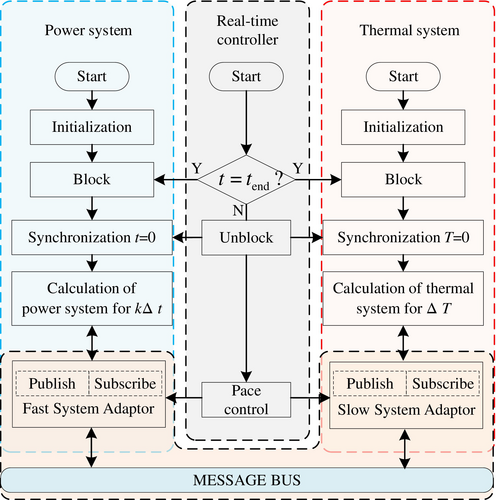
- The simulation data is initialized, and then the communication module is blocked to realize the synchronization of the two systems.
- After the slow system and the fast system receive the unblocking signal, the slow system simulation program sends the initial information at the time of t0 to the fast system simulation program and reads the information from the fast system network.
- After the fast system simulation program obtains the information of the slow system network, it simulates from time t0 to time t1 − te.
- Exchange data at t = (t1 − te) + Δte before re-starting the calculation. The fast system sends the information of t1 − te to the slow system; at the same time, the slow system sends the information of t0 to the fast system.
- The fast system starts the simulation at time t after receiving the information from the slow system at L[t0, 0], and gradually simulates to t2 − te; at the same time, the slow system receives the information of the fast system at t1 − te, then simulates from t0 to t1.
- Repeat (3–5) until the simulation ends.
3.2 Multi-Rate Simulation Interface Modeling for the TESs
In TESs, the energy passing through an interface can be either from the thermal system to the electric system or from the electric system to the thermal system. Therefore, the coupling mechanism can be divided into two types according to the direction of thermal system to electric system interfaces and electric system to thermal system interfaces. Besides, there are several operational mechanisms for coupling equipment in TESs; for example, resistance devices are based on the Joule effect, thermocouples are based on the Peltier effect, and thermoelectric power generation devices are based on the Seebeck effect, and so on. Table 1 shows the thermoelectric coupling mechanisms widely used in industries, which are generally described by differential-algebraic equations, as shown in Equation (17).
| Energy direction | Coupling device | Coupling mechanism |
|---|---|---|
| T-to-E | Gas-Turbine generator unit | Swing equation |
| Thermocouple | Seebeck effect | |
| E-to-T | Boiler | Joule effect |
| Heat pump | Compressor | |
| Semiconductor cooler | Peltier effect |
To observe the bidirectional influence in the TESs, this paper establishes the multi-rate interface models for T-to-E interfaces and E-to-T interfaces, based on the two most common couplings in the TESs, resistance-based coupling and rotor-based coupling.
The models discussed above need to be discretized to perform the digital simulation; besides, the resolution of variables passed by the interfaces needs to be adjusted to match the target subsystem resolution.
When the thermal system and the electric system are coupled with the rotating device, such as a generator, the discrete interface model based on the explicit Euler method is modeled as Equations (27) and (28) in the time range .
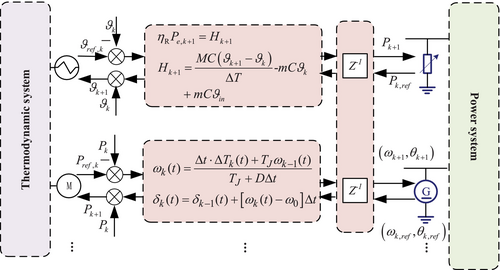
Figure 5 shows the multi-rate model of the control strategy based on two common coupling mechanisms, including the bi-directional control modes.
3.3 Realization of System Co-Simulation Communication
When subsystems are connected to each other in a point-to-point manner, the number of communication threads increases squarely with the number of couplings. For the potential expansion requirements, after establishing the dynamic model of the thermal system, the message bus ZeroMQ is used to communicate with RT-LAB, which facilitates the access of thermal and power hardware, other simulation subsystems, and the supervisory control and data acquisition (SCADA). The subsystems with the message bus do not communicate with each other directly and only need to publish and subscribe to the topics concerned through the adapters. Therefore, when the IES is further expanded, each subsystem only needs to modify subscription contents. The overall communication structure is shown in Figure 6.
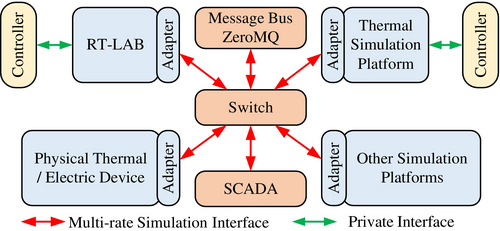
In the TES multi-rate simulation, the thermal system publishes the mechanical power generated by the steam turbine and the electric power value of the electric boiler and subscribes to the real-time synchronization signal of RT-LAB. What RT-LAB subscribes to is the mechanical power and the electric power value of the electric boiler and publishes the real-time synchronization signal.
4 Numerical Tests and Discussion
In this section, the multi-rate functional interfaces are validated in the simple case at first, attached with the necessary explanations, which are presented in Section 4.2, and then in Section 4.3, the parallel and multi-rate real-time simulations are performed for the TESs as shown in Figure 1 with the bi-directional coupling interfaces. The relevant parameters are provided in Appendix A, where Tables A1–A7 present the building parameters, pipeline parameters, electric boiler parameters, gas turbine parameters, generator parameters, heat exchanger parameters, and heating coil parameters, respectively.
4.1 Introduction to Calculation Examples
The multi-rate simulation is based on a practical TES case presented in Figure 1. In the thermal power tracking mode, the electric power system coordinates with the thermal system to consume the mechanical energy of the turbine as much as possible through the generator. While in the electrical power tracking mode, the thermal system coordinates with the electrical system to satisfy the fluctuation of electrical load and reduce reliance on the distribution network.
The main workflow of the HRS is introduced in the second part. The key parameters of the devices are given in Appendix A.
4.2 Verification of the Correctness of the T-to-E Interfaces and E-to-T Interfaces
In this part, the multi-rate interfaces based on the boiler and generator are tested to validate. For the E-to-T interface, the power of the electric boiler drops from 60 to 15 kW at the 30 s. For the T-to-E interface, the mechanical power rises from 2.78 to 3.5 MW at 20 s, and drops to 2.5 MW at 40 s. The test results are presented in Figures 7 and 8.


According to Figure 7, the temperature of water out of the boiler varies with electrical power. When the electric power changes, the temperature changes slowly with the former, which is presented in Figure 7a,b. Besides, the change of power consumed by the electric boiler affects the connected bus voltage, as shown in Figure 7c; the voltage rises when the heat power decreases.
Similarly, the changes in machine power from the thermal system will affect the electric power delivered by the CHP, as shown in Figure 8a, when the mechanical power rises or falls sharply, the electrical power sent to the power grid fluctuates and stabilizes gradually. The effects on power and current are similar.
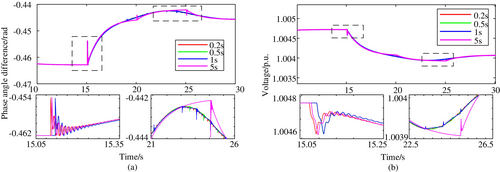
To figure out the influences of iterative timesteps on the electric system as well as the thermal system, the functional interfaces are tested under four timesteps, that is, 0.2, 0.5, 1, and 5 s. Figure 9 presents the electric power system results, where the angle difference between the generator and utility grid is shown in Figure 9a. The voltage of the generator bus is shown in Figure 9b. As we can see, the co-simulation with a bigger iterative timestep fluctuates much more severely at the interaction time. Figure 10 shows the interface test results in the thermal system. Figure 10a gives the mechanical power delivered by the gas turbine. Figure 10b presents the exhaust temperature of the gas turbine under different timesteps. As we can see from Figure 10a,b, compared with the other three timesteps, the results under 0.2 s are the smoothest, and the delays of data exchange are the smallest. Therefore, on the computable premise, the smaller the timestep, the higher the simulation accuracy and the more stable the system.

4.3 Heating Network Dynamics and Power Grid Dynamics Simulation and Analysis
In the real-time simulation example, the heating grid step size is set to 2 s, and the grid step size is set to 50 μs. Thus, the step ratio is 40,000, which satisfies the requirement of Equation (29). The simulation of two operating modes of electric heating and heating is briefly introduced as follows:
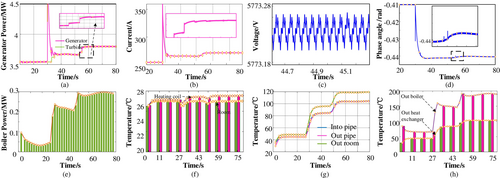
Case 1, the TES operates on thermal power tracking mode, which means that electricity is determined by heat. The ambient temperature suddenly drops from 20°C to 5°C in 30 s.
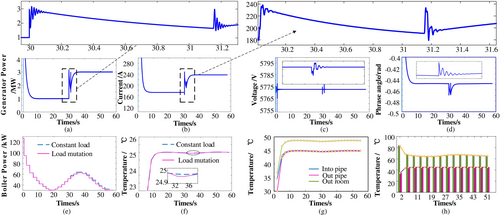
Case 2, the TES operates on electrical power tracking mode, which means that the gas turbine operates to meet the electrical requirements. The electric load suddenly rises from 1 to 3 MW in 30 s.
In both of the two modes, when the ambient temperature fluctuates, the power of the electric boiler under PI control changes to track the required thermal load, thereby maintaining the indoor temperature at 25°C.
The simulation results under two typical working conditions are shown in the figure below.
The results of case 1 are shown in Figure 11a–h. There are transient processes from 0 to 10 s in all the results shown because the TES transitions from an initial state to a steady state. Due to the temperature decrease at the 30 s, the combustion efficiency of the gas turbine increases, and the output power and current increase significantly, as shown in Figure 11a,b. Voltage decreases with ambient temperature shown in Figure 11c. Due to the electric system connected to the distribution network, the voltage decrease is tiny. Figure 11d shows the voltage phase angle difference between the generator and the wind farm. The absolute value of the difference increases to output more power. Figure 11e,f shows the boiler power, output air temperature, and indoor temperature of the indoor heater. The decrease in ambient temperature leads to an increase in the room's heat dissipation power to the environment; thus, the boiler power increases to maintain the room temperature at 25°C, so the air temperature difference output by the heating device in the room is larger than the previous temperature difference. Figure 11g shows the inlet water temperature, outlet water temperature, and temperature leaving the heater. It can be seen that the temperature drops significantly after being transported over the pipe and drops further after the heat is dissipated to the room. Figure 11h shows the output water temperature of the electric boiler and the output water temperature of the heat exchanger. Because of the decrease in ambient temperature, the boiler temperature rises significantly. Since the mass flow of water in the heating network is greater than that in the boiler, its temperature is lower than that of the boiler. Overall, when the state of the thermal system changes, the power system will change significantly because the TES operates in the thermal power tracking mode.
The electrical power tracking mode results of case 2 are shown in Figure 12a–h. The sudden increase in electrical load causes significant voltage fluctuations in the 30 s. The gas turbine power increases to meet the sudden increase in electrical load, as shown in Figure 12a. Thus, the current from the generator increases. Due to the support of the distribution network, the voltage of the power system will quickly return to the constant level, but has declined in Figure 12c. Similarly, the difference in phase angle has increased power, which is shown in Figure 12d. The power consumed by the boiler is shown in Figure 12e; compared with the constant electrical load, the boiler power is relatively lower due to the inadequate power supply. Figure 12f shows the change of indoor temperature, when the perturbation occurs, the indoor temperature declines, and thanks to the distribution grid, it can recover to the setpoint. Compared with the constant load condition, the indoor temperature is lower in the transient process. According to Figure 12g,h, the temperature of the boiler increases after the 30 s due to the decrease of indoor temperature.
5 Conclusions
- A thermal-power system dynamic simulation model based on the coupled-thread co-simulation framework is developed, which includes the basic equipment models. The proposed method realizes the dynamic simulation of TESs with flexibility and variety.
- Based on the functional mechanism of the rotor and resistance devices, the multi-rate parallel interface models are established for the TESs, through which the bidirectional interactions between the thermal system and electric system can be reflected with fast dynamics and high efficiency.
- Through the co-simulation of RT-LAB and independent thermal, multi-rate real-time simulation of TESs is performed through multi-rate functional interfaces under the two typical modes. According to the simulation results, the system studied in this paper has higher simulation accuracy and stability at a step size of 0.2 s. The increase in timestep ratios will decrease computational costs and increase simulation fluctuations in TES co-simulation.
At present, this research focuses on the scope of thermal systems and power systems. In the future, further research will be conducted on dynamic co-simulation of integrated energy systems with more energy subsystems; further apply multi-rate simulation methods in practical systems; And explore the influence of time step size in simulations at different time scales.
Nomenclature
-
- CHP
-
- combined heat and power
-
- EMT
-
- electromagnetic transient
-
- E-to-T Interfaces
-
- electric system-to-thermal system interfaces
-
- HRSG
-
- heat recovery steam generator
-
- HVAC
-
- heating, ventilating, air conditioning
-
- IES
-
- integrated energy systems
-
- MPPT
-
- maximum power point tracking
-
- NG
-
- natural gas
-
- SCADA
-
- supervisory control and data acquisition
-
- SOC
-
- state of charge
-
- TE-IES
-
- thermal-electric IES
-
- TES
-
- thermal-electric systems
-
- T-to-E Interfaces
-
- thermal system-to-electric system interfaces
Parameters and Variables
-
- mL
-
- the fluid mass in the pipe
-
-
- fluid mass flow
-
- A
-
- the fluid mass flowing into the pipe in NΔt
-
- B
-
- the mass of the complete segment flowing out at the tth period
-
- C
-
- the fluid mass flowing into the pipe from t − mt to t
-
-
- the temperature of the fluid outflowing at the tth period
-
- c
-
- the specific heat capacity
-
- R
-
- the thermal resistance of pipeline
-
-
- the surrounding temperature
-
-
- the outlet temperature of the intercooler
-
-
- the pressure of the intercooler
-
-
- the cooling water flow
-
-
- the inlet temperature of the cooling water
-
-
- the outlet temperature of the cooling water
-
-
- the cooling efficiency of the intercooler
-
-
- the pressure drop of the intercooler under designed conditions(300–500 Pa)
-
-
- the designed mass flow of the intercooler (kg/s)
-
-
- air mass flow in the turbine
-
-
- the turbine inlet temperature
-
-
- the turbine outlet temperature
-
-
- the temperature of the exhaust at the entrance of the compressor
-
-
- the pressure of the exhaust at the outlet of the compressor
-
-
- the pressure of the exhaust at the outlet of the compressor
-
- p0
-
- the pressure of the exhaust at the entrance of the compressor
-
- ηc
-
- the compressor efficiency
-
- πc
-
- the compressor compression ratio
-
- ka
-
- the adiabatic air coefficient
-
- Mqtc
-
- the compressor torque consumption
-
- nc
-
- the compressor speed
-
- Rg
-
- the gas constant (287 J/(kg K))
-
- Mttc
-
- the turbine torque
-
- πt
-
- the expansion ratio of cylinder exhaust in the turbine
-
- nt
-
- the turbine speed
-
- ηt
-
- the turbine efficiency
-
- Z
-
- the turbine exhaust temperature factor
-
-
- the cooling loss of the turbine
-
-
- the moment of inertia of the rotating shaft of the turbocharger (kg m2)
-
-
- the mechanical efficiency of the turbocharger
-
-
- turbine indicated torque
-
-
- friction torque
-
-
- load torque
-
- J
-
- turbine moment of inertia
-
- ηR
-
- the electric heating efficiency
-
- RR
-
- variable resistance in the electrical simulation
-
- U
-
- the voltage of the variable resistor bus
-
- M
-
- the mass of fluid heated
-
- cl
-
- the specific heat capacity of the heated liquid
-
-
- the liquid temperature
-
- soc(t)
-
- the state of charge of heat storage
-
- δ
-
- the rotor angle
-
- ω
-
- the rotor angular velocity
-
- ω0
-
- the rated angular velocity
-
- TJ
-
- the rotational inertia
-
- PT
-
- the mechanical power
-
- PE
-
- the electrical power
-
- D
-
- the damping factor
-
-
- the average voltage value in the kth thermal simulation cycle
-
- L
-
- the linear interpolation operator
Author Contributions
Yanbo Jia: funding acquisition, software, data curation. Pengfei Han: methodology, conceptualization, writing – original draft, writing – review and editing. Zhaohui Shi: validation, writing – review and editing. Lei Zhang: funding acquisition, visualization.
Conflicts of Interest
The authors declare no conflicts of interest.
Appendix A
| Parameters | Units | Values |
|---|---|---|
| Heat capacity | kJ/K | 6000 |
| Loss coefficient | kJ/h m2 K | 5 |
| Air density | kg/m3 | 1.2 |
| Specific heat of air | kJ kg/K | 1.007 |
| Building area | m2 | 200 |
| Parameters | Units | Values |
|---|---|---|
| Pipeline length | m | 150 |
| Loss coefficient | kJ/h m2 K | 3 |
| Pipeline diameter | m | 0.3 |
| Fluid density | kg/m3 | 1000 |
| Fluid specific heat | kJ kg/K | 4.19 |
| Initial temperature | °C | 0 |
| Parameters | Units | Values |
|---|---|---|
| Rated capacity | kW | 500 |
| Fluid specific heat | kJ kg/K | 4.19 |
| Boiler efficiency | — | 0.8 |
| Inlet temperature | °C | 20 |
| Max temperature | °C | 120 |
| Parameters | Units | Values |
|---|---|---|
| Rated capacity | MW | 4 |
| Rated speed | rpm | 1500 |
| Total displacement | L | 357 |
| Compression ratio | — | 9:1 |
| Parameters | Units | Values |
|---|---|---|
| Rated capacity | MW | 3.6 |
| Moment inertia | L | 357 |
| Rated speed | rpm | 1500 |
| Damping coefficient | — | 0.05 |
| Terminal voltage (line to line) | kV | 10 |
| Parameters | Units | Values |
|---|---|---|
| Efficiency | — | 0.9 |
| Specific heat of source side | kJ kg/K | 4.19 |
| Specific heat of load side | kJ kg/K | 4.19 |
| Parameters | Units | Values |
|---|---|---|
| Total capacity | kW | 50 |
| Efficiency | — | 0.9 |
| Specific heat of source side | kJ kg/K | 4.19 |
| Inlet air flow | kg/s | 6.8 |
Open Research
Data Availability Statement
The data are available from the corresponding author upon reasonable request.


