Finite Element Analysis and Machine Learning-Based Prediction of Oil Tank Behavior Under Diverse Operating Conditions
Funding: This research is supported by the National Research Foundation of South Africa under the Unique Grant No: PMDS22070431246 and the University of Johannesburg, South Africa.
ABSTRACT
Ensuring the structural integrity and operational reliability of oil storage tanks is critical to preventing catastrophic failures, including environmental pollution and economic losses. This study integrates Finite Element Analysis (FEA) and Machine Learning (ML) to predict the behavior (structural) and useful life of oil tanks under diverse operating conditions. The methodology involves applying FEA simulation (using Abaqus) to model the strain, stress, and buckling behavior of the oil storage tank. Thereafter, fe-safe postprocessing software was used to post-process the FEA results to estimate the useful life of the tank. These FEA and fe-safe outputs were trained using Artificial Neural Networks (ANN) and Adaptive Neuro-Fuzzy Inference Systems (ANFIS) to predict unknown tank operating scenarios. The study revealed that the filled tanks experienced higher stress (485.4 MPa) and reduced life expectancy (1429 h) compared to half-filled tanks (388.7 MPa and 3551 h). For the ML, ANFIS excelled in predicting stress and strain with R2 values of 0.999, while ANN proved superior for useful life predictions with R2 values of 0.998. This hybrid FEA-ML approach enables efficient and precise analysis, thereby facilitating design optimization and maintenance strategies for industrial applications.
1 Introduction
The oil and gas sector, along with the power generation industry, has traditionally depended on large storage tanks to hold crude oil and its by-products, thus making these tanks a critical component of industrial infrastructure [1, 2]. Ensuring the structural integrity and operational reliability of these oil storage tanks is paramount, given the potentially catastrophic consequences of failure, such as environmental pollution, economic losses, and safety hazards [3]. The behavior of oil tanks under diverse operating conditions, such as variations in operating pressure and external loading, has been a focal point of engineering research aimed at improving design and maintenance strategies [4, 5]. However, traditional analytical methods face significant challenges in addressing the complexity and variability inherent in these systems [6].
Finite Element Analysis (FEA) has emerged as a powerful computational tool for simulating the structural behavior of oil tanks across different conditions [7]. By discretizing the tank geometry into smaller finite elements, FEA allows for the detailed analysis of stresses, strains, and deformations arising from both internal and external forces [8]. This method has proven effective for evaluating the performance of tanks under static and dynamic loading, as well as for identifying regions susceptible to structural failure. Despite its robustness, FEA can be computationally expensive and time-intensive, especially when dealing with large-scale tanks and complex loading scenarios [9]. Moreover, the accuracy of FEA depends on the quality of the input data and the assumptions made during model development [8].
Over the years, extensive research has been conducted on the structural analysis and performance prediction of oil storage tanks, with a significant focus on computational and data-driven methodologies. In a number of studies, the FEA method has been a cornerstone of the research, as it provides detailed insights into stress, strain, and deformation patterns in the storage tank structures. Studies, such as those by Zhang et al. [10], established foundational principles for analyzing cylindrical storage tanks under internal pressure and external loading. Subsequent works have expanded these principles to account for more complex conditions, including seismic loading [11] and thermal effects [12].
Further advancement of computational tools has enabled the application of FEA to larger and more intricate models. For instance, Zhao and Lin demonstrated the use of nonlinear FEA to assess the buckling behavior of storage tanks subjected to wind loads [13]. Their findings highlighted the importance of incorporating geometric imperfections and material nonlinearities for accurate predictions. Similarly, Liu et al. [14] investigated the thermal-mechanical characteristics of fluid sloshing in cryogenic storage tanks, thus emphasizing the role of gravity acceleration on fluid sloshing. Despite these advancements, the computational cost of FEA remains a limitation, particularly for scenarios involving transient or dynamic analyses. Also, the method typically requires extensive computational resources and lacks adaptability for new scenarios without re-modeling.
Complementing FEA, machine learning (ML) has gained traction as a promising approach for predicting the behavior of engineering systems. By leveraging large datasets, ML models can identify patterns and relationships that are difficult to capture using traditional methods [15]. For oil storage tanks, ML can be used to predict key performance metrics, such as stress distribution, deformation, and failure probability, based on historical data and simulation results. ML models have the advantage of providing rapid predictions once trained, thus making them suitable for real-time monitoring and decision-making. However, the application of ML in this domain is still in its infancy, with challenges including the need for high-quality training data and the interpretability of model outputs.
The integration of FEA and ML offers a novel framework for addressing the limitations of each individual approach. While FEA provides a physics-based foundation for understanding tank behavior, ML can enhance predictive capabilities by learning from simulation outputs and experimental data. This hybrid approach has the tendency to improve the efficiency and accuracy of predictions; therefore, enabling more effective design optimization, condition assessment, and risk management.
For example, Mandal et al. [16] used ANNs to estimate the buckling load in cylindrical tanks based on uniaxial load. Their results demonstrated that ML models could achieve high accuracy while significantly reducing computation time. Similarly, Micheli et al. [17] applied SVMs to estimate induced seismic damage in a steel tank, thus showcasing the potential of the ML technique for risk assessment.
The integration of FEA and ML has been explored in recent studies to leverage the strengths of both approaches [18]. Ogaili et al. [18] proposed a hybrid framework combining FEA simulations with ML models to predict the failure modes of a small composite blade. Their approach achieved a balance between accuracy and efficiency, thus making it suitable for real-time applications. Additionally, Alrsai et al. [19] employed integrated FEA and ML for the prediction of pressure in hybrid Steel-CFRP subsea, and the approach proved to be effective, thereby enabling their application to real-world scenarios with limited experimental data.
In this study, FEA is used to simulate the structural response of oil storage tanks after which the FEA-generated responses are trained using two ML models “Artificial Neural Networks (ANN) and Adaptive Neuro-Fuzzy Inference Systems (ANFIS)” to predict the key performance matrices and evaluate the effectiveness of the hybrid approach in capturing complex interactions and providing actionable. It is hypothesized that integrating FEA with ML techniques, specifically ANN and ANFIS can accurately and efficiently predict the structural performance and useful life of oil storage tanks under diverse operating conditions. Also, it is further hypothesized that ML models, once trained on high-fidelity FEA-generated data, can replicate complex stress–strain responses and lifespan estimates with minimal deviation, thereby offering a reliable alternative to traditional, computationally intensive simulations.
2 Methodology
To model the structural behavior (strain, stress, and buckling) of the tank during operation, FEA software, Abaqus was employed. To compute the storage tank's useful life under the different operating conditions, postprocessing software (fe-safe) was used to post-process the Abaqus-generated results. For the machine learning ML, two different models: ANN and ANFIS were used. During the ML analysis, the FEA inputs and post-processed results from fe-safe were used for training ML algorithms.
2.1 FEA Model Development
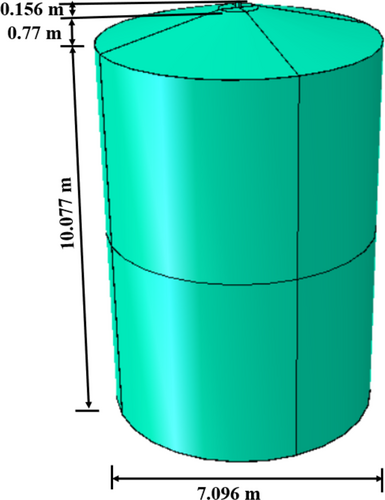
Commercial FEA software, Abaqus was employed in the development of the model of the oil storage tank. The developed oil tank model, shown in Figure 1 and dimensions shown in Table 1 is similar to those used in the electrical power generation companies for the storage of oil. This oil storage tank is made of low-carbon steel (S355) with material properties as depicted in Table 2. Also depicted in Table 2 are the properties (materials) of the stored oil (diesel) (Table 3).
| Parts of the tank | Height (m) | Diameter (m) | Thickness(m) | |
|---|---|---|---|---|
| Outer | Inner | |||
| Cylindrical part | 10.077 | 7.096 | 7.076 | 0.01 |
| Cone-like section (top) | 0.770 | 1.015 | 0.975 | 0.01 |
| Vent | 0.156 | 0.120 | 0.100 | 0.01 |
| Material property | Value |
|---|---|
| Elasticity (GPa) | 202.60 |
| Poisson's ratio | 0.28 |
| Density (kg/m3) | 781.30 |
| Yield strength (MPa) | 355.00 |
| Thermal conductivity (W/(mK)) | 14.90 |
| Thermal expansion () | |
| Specific heat capacity (J/kg K) | 531.40 |
| Material property | Value |
|---|---|
| Density (kg/m3) | 840.0 |
| Specific volume (m3/kg) |
2.2 Mesh Convergence Study
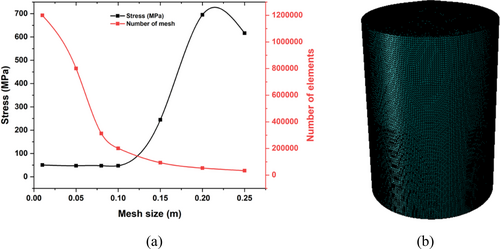
In FE analysis, the accuracy of simulated results is not only dependent on the correctness of the boundary condition and applied load, but it also depends on the size of the mesh used and the density of the elements used in the analysis [6, 22-24]. Thus, it is paramount to conduct a mesh convergence study and verify the independence of the mesh with respect to the model. In this study, a mesh convergence study was performed. This was achieved by decreasing the mesh size of the model gradually from the default mesh size specified by Abaqus until a mesh size suitable for the analysis (with a high degree of accuracy) is achieved, at a reasonable computational time. Figure 2a is a plot obtained after conducting an appropriate mesh convergence study on the tank using the values of the stress developed on the tank, while Figure 2b depicts the meshed model of the tank settled for after conducting the study. From the result of the study (mesh convergence) conducted, 400,872 nodes, 201,023 quadratic tetrahedral elements (Type: C3D10) free text mesh type with 0.10 m mesh size was discovered to be suitable for the simulation, and the choice of this combination helped to minimize the computational while retaining the integrity of the results generated.
2.3 Tank Loading and Boundary Conditions (BC)
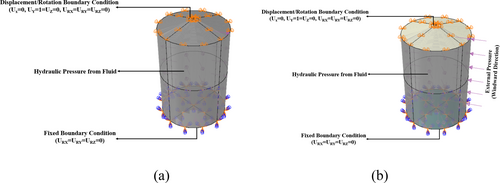
In this study, the appropriate loading and boundary conditions similar to those a typical tank (oil storage) is exposed to in a power generation company were specified. Displacement/rotational BC was specified at the top of the tank such that the top is allowed to move or be displaced in the Y axis, but in the X and Z axis, it is constrained. Also, the base or bottom of the tank is constrained (fixed) such that it is not allowed to be displaced, as depicted in Figure 3. In the interior or inner surface of the tank, the appropriate pressure corresponding to that exerted due to the analysis under study (i.e., hydrostatic pressure due to oil level in the tank, hydrostatic plus induced pressure due to oil discharge or faulty valves), while on the tank's exterior surface, pressure corresponding to that exerted by the wind (250 Pa) in the windward direction is specified.
2.4 Analysis Steps
Since the oil storage tank is classified as thin-walled which is prone to failure due to buckling, two steps namely: static general (SG) and buckling were specified in Abaqus. The SG step was specified to determine the strain and stress developed across the tank during operation while a buckling step was specified to determine the possible buckling patterns and mode shapes due to the loading regime the tank is subjected to during service. In the buckling step, subspace eigensolver was used since only 20 eigenvalues and eigenvectors are required, and for the static analysis, the direct equation solver method was used by employing the full Newton–Raphson solution technique/algorithm with a minimum increment of and a maximum number of increments of 10,000.
2.5 Useful Life
To determine or estimate the tank's useful life under the different conditions specified, FEA postprocessing software, fe-safe was employed, and the result obtained from the static analysis performed on the tank was imported into fe-safe, where the nodal stress and strain developed on the tank were used to compute the lifespan of the tank for the different conditions of operation.
2.6 FEA Model Validation Expressions
2.7 Machine Learning (ML) Methodology
To predict the behavior of the oil storage tank when subjected to diverse operating conditions, and also to reduce the long computational time associated with the use of the FEA technique whenever a new scenario arises, machine learning techniques were employed. ANN and ANFIS were used to understand the behavior patterns of the storage tanks and to predict the structural performance based on datasets obtained from finite element analysis (FEA) and fe-safe post-processing software after simulating real case scenarios.
2.7.1 ML Data Acquisition
The datasets used for the ML analysis were obtained from the FE analysis (structural analysis) conducted on the tank using FEA software Abaqus and the post-processing software, fe-safe. The FE-analysis data used for the machine learning were obtained by structural simulation of the storage tank, where different tank thicknesses and loading scenarios (e.g., internal pressure and external loads) were considered and their corresponding stress, strain, and useful life determined by fe-safe post-processing software. These stress, strain, and useful life datasets were used during the training, testing, and validation of the ML algorithms.
2.7.2 Data Preprocessing
The FEA data obtained for the stress and strain analysis in Abaqus and their corresponding useful life predicted by fe-safe (being the significant features that influence the behavior of the tank during service) are subjected to data cleaning in order to remove any inconsistencies or outliers in the obtained dataset. Thereafter, the cleaned data are normalized to ensure all features contribute equally to the model training process.
2.7.3 Machine Learning Model Development
For the ANN analysis, a multi-layer feedforward neural network with an appropriate number of hidden layers and neurons was used for the analysis. In the analysis, a total of 100 datasets obtained from FEA were used, and 70% of the total datasets were used for training, 15% was used for testing, while 15% were used for validation. Due to the dataset size of this study, the Levenberg–Marquardt algorithm was used [26]. This algorithm uses a second-order optimization method that combines gradient descent and the Gauss-Newton method, as it provides fast convergence and is well-suited for smaller networks.
Just like the ANN model, a total of 100 datasets were used in the analysis, out of which 80% were used for training the ANFIS model by adjusting the membership functions and rules to fit the data, while 20% was used for testing the model to ensure its predictive accuracy and robustness. The membership functions (MF) in ANFIS play an important role in converting crisp inputs into fuzzy values, thus enabling the system to handle uncertainty and imprecision while defining the conditions under which rules are activated. During the training phase, the hybrid optimization method was used such that ANFIS adjusts the parameters of the membership functions to minimize error and enhance the prediction accuracy of the model. Depicted in Table 4 are the input and output variables used for the ML analysis for the two models (ANN and ANFIS).
| Input variables | Output variables |
|---|---|
| Thickness of tank | Stress developed |
| Internal pressure | Strain developed |
| External pressure | Useful life |
| Oil level |
2.7.4 Model Evaluation
In order to evaluate the ML models used in this study, certain performance metrics such as Mean Squared Error (MSE), Root Mean Squared Error (RMSE), R-squared (R2), and Mean Absolute Error (MAE) are used [27-29]. The R2 metric quantifies how well the ML models (ANN and ANFIS) replicate the actual FEA results. This metric ranges from 0 to 1, such that R2 = 1 indicates that the model predicts the FEA results perfectly with no errors, R2 = 0 implies that the model fails to explain any variability in the data (no better than a random guess), and R2 > 0.9 specifies excellent predictive accuracy, with most predictions closely matching the true values. Also, cross-validation is implemented to assess the generalizability of the models and prevent overfitting.
3 Results and Discussion
3.1 FEA for Static Analysis
Figure 5 presents the results of the FEA, and it offers essential insights into the structural behavior of the filled and half-filled tanks subjected to combined external and internal loading conditions. It is worth noting that different operating conditions and tank thicknesses were considered in this study and the stress developed due to these conditions was simulated in Abaqus. Due to the large volume of simulations conducted with just changes in the tank thickness and operating conditions, only selected contour plots showing the FEA results are present here. Nevertheless, the results obtained from the simulations are used for the ML prediction. The contour plot in Figure 4 shows the developed stress and strain in the tank when filled oil (diesel) as depicted in Figure 4a and half-filled with(oil) diesel as illustrated in Figure 4b, and with 250 Pa external pressure applied in the windward direction and 0.5 MPa internal pressure applied to the interior surface of the tank. The filled tank filled, it experienced a notably high stress (von Mises) of 485.4 MPa and strain of in the windward direction as depicted in Figure 4a, and the value of the stress developed surpasses the tank material's yield strength. These elevated stress and strain levels suggest a significant risk of plastic deformation under the given operating conditions [30, 31]. Thus, indicating that when subjected to an internal pressure of 0.5 MPa and a relatively low external wind pressure of 250 Pa, the tank experiences significant mechanical strain, primarily driven by the internal pressure. Also, the stress concentration observed in the contour plot on the windward side confirms that this area undergoes the maximum combined impact of internal and wind pressures, thus, leading to the high stress and strain levels recorded in this region [32, 33]. Additionally, the stress and strain distribution pattern reveals that the lowest stress occurs on the part of the tank opposing the windward direction, thus, highlighting the influence of wind pressure on the strain and stress experienced by the filled tank [34].
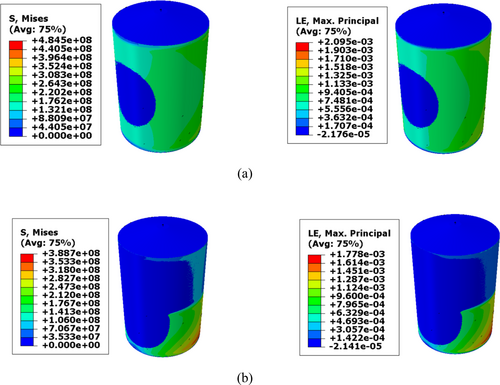
For the half-filled tank subjected to similar operating conditions as the filled tank, as illustrated in Figure 4b, the stress distribution contour plot shows that maximum stress with a value of 388.7 MPa was obtained at the lower part or base of the tank in the windward direction. This shows the susceptibility of this tank region to failure, particularly when the maximum stress exceeds the material's yield strength of 355 MPa under the specified loading conditions. Similar to the stress distribution, the strain contour plot shows the optimal strain () occurring at the lower/base of the tank. The regions where the stress and strain concentrations were observed align with theoretical predictions for pressure vessels (i.e., thin-walled cylinders), where the windward side of the vessel faces increased external pressure, which leads to an outward deformation and elevated stress and strain, while the deformation in the opposite side is minimal [5, 34].
A comparison of the FEA results for the tank revealed notable discrepancies in strain and stress distributions under the specified loading conditions. Both tanks show noticeable mechanical strain resulting from the wind load and internal pressure. Nevertheless, the filled tank developed higher stress with a value of 485.4 MPa as compared to the half-filled whose highest value is 388.7 MPa. Similarly, the maximum strain (principal) of the filled tank () is slightly higher than that of the half-filled tank (). Despite these variations in their stress and strain values, the highest stress concentration in both tanks is in the windward direction, thus, illustrating the effect of combined external and internal pressure on the tank.
3.2 Validation of FEA Stress Results
Validating the FEA results of tanks (storage) is challenging, especially during service. This is due to its shape and operating conditions. To validate the developed tank model used in this study accurately, it was necessary to simplify the operating conditions. Therefore, the hydrostatic-induced stress in the tank by the internal hydrostatic pressure of the contained liquid was used as the model validation basis.
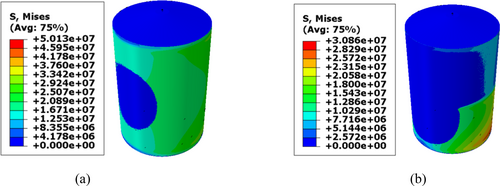
Illustrated in Figure 5a,b are the contour plots and results for the developed hydrostatic stress in the filled and half-filled tank. In the filled tank, the developed hydrostatic stress is 50.13 MPa, while in the half-filled tank, the stress is 30.86 MPa. Using analytical techniques based on the expressions (Equations 1 and 2) for the stress developed due to the hydrostatic pressure exerted on the thin-walled cylinders, the stress developed on the tank was analytically computed, and the obtained results were compared with those obtained from FEA shown in Figure 5. The compared results, as depicted in Table 5 show a percentage deviation of less than 10%, thus signifying the successful validation of the FEA model.
| Oil level in tank | FEA prediction (MPa) | Analytical calculation (MPa) | % Deviation |
|---|---|---|---|
| Filled | 50.13 | 49.89 | 0.48 |
| Half-filled | 30.86 | 29.35 | 5.14 |
The successful validation helps increase the confidence, reliability of the technique used, and accuracy of the computational model. Furthermore, the strong agreement between the FEA and analytical results further gives credence to the findings of the study.
3.3 Tank Buckling Behavior
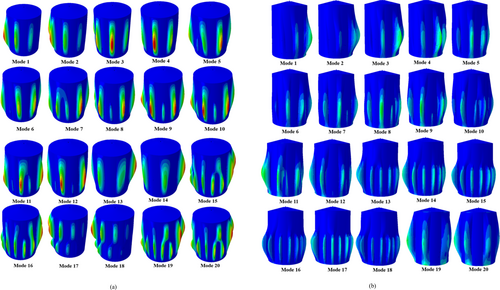
Presented in Figure 6 are the FEA buckling mode shapes for the first 20 eigenvalues for the filled and half-filled tanks. These plots provide details about the behavior (buckling) of the tanks under the stated operating conditions. The simulation reveals that both tanks are prone to buckling, with initiation predominantly occurring on the windward side. The first 20 modes offer valuable information about the deformation patterns at the two oil levels. As anticipated, modes 1–4 display prominent outward bulging on the windward side, caused by the pressure gradient between the internal pressure (high) and the wind velocity-induced external pressure (low) [5]. This gradient creates an effective force acting on the walls of the tank, which drives deformation toward the region of higher pressure. Specifically, the tank's interior surface experiences an outward force exerted by the high internal pressure, while the exterior surface experiences an inward force exerted by the low wind-induced external pressure. The resulting net outward force on the windward side leads to bulging as the tank seeks to alleviate the pressure differential [5]. The initial deformation the tank experiences under both loading scenarios generates stress concentrations, and these propagate through the tank in higher (subsequent) modes, producing more intricate buckling patterns observed in higher modes (modes 5 through 20).
3.4 Estimation of Useful Life
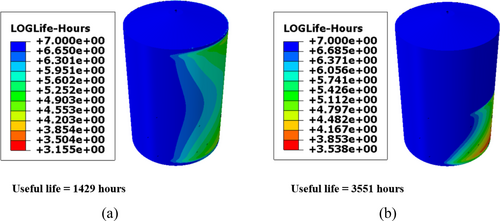
Accurately determining the useful life of tanks under diverse service conditions is essential for maintaining safety, reliability, and cost efficiency in industrial operations. To estimate the service life of the tank under the stated conditions, the data for the static general analysis (stress and strain) were exported and processed using fe-safe software. The fe-safe processed results indicate that the filled tank is expected to last 1429 h before failure, whereas the half-filled tank would survive 3551 h, as depicted in Figure 7. The useful life contour plot of both tanks reveals that the shortest lifespan occurs near the lower end of the tank on the windward side. However, the difference in useful life between the tanks highlights the significant impact of internal and external stress distributions on the integrity (structural) and durability of the tanks [35].
3.5 ANN Performance
The performance of the Artificial Neural Network (ANN) in predicting the behavior of the tanks was evaluated using the dataset generated from the FEA, and the outcome of the analysis demonstrated excellent predictive capability, as reflected in the regression plots shown in Figure 8.
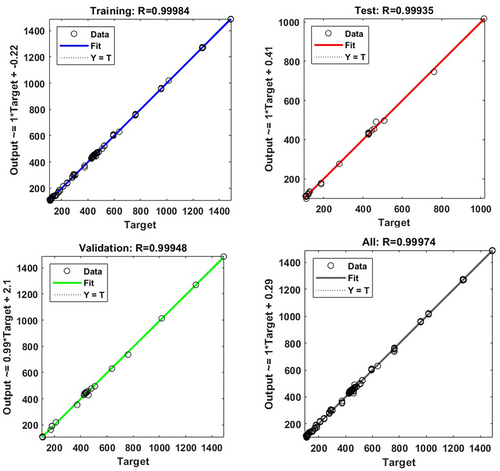
The regression plots provide a detailed assessment of the relationship between the target values (obtained from FEA) and the ANN predictions for the training, testing, validation, and overall datasets for the stress. From the plot, the R-values for these subsets were 0.99984 for training, 0.99935 for testing, 0.99948 for validation, and 0.99974 for all data. These R-values are very close to 1, thus indicating a nearly perfect correlation between the predicted and actual values [36]. The nearly perfect correlation shows the ability of ANN to accurately model the nonlinear relationships inherent in the dataset. In addition to the high R-values, the Mean Squared Error (MSE) was used to quantify the performance of the ANN model. The training dataset exhibited an MSE of 31.4851, thus indicating minimal error during the learning phase. Furthermore, the regression lines in Figure 8 show that the predicted outputs closely align with the ideal Y = Target line, where the predicted values are equal to the target values. This alignment further confirms the high accuracy of the ANN model.
The regression plots for strain prediction using ANN are presented in Figure 9. These plots show the strong predictive capability of the model for this specific output parameter. The plots illustrate the correlation between the target strain values obtained from FEA simulations and the predicted strain values generated by the ANN for the training, testing, validation, and combined datasets. Similar to the stress analysis, the regression analysis for strain demonstrates the ANN's proficiency in capturing the complex nonlinear relationships present in the dataset.
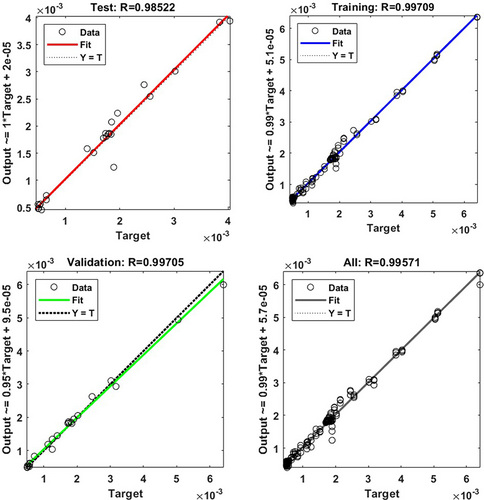
For the training data, the ANN achieved a high R-value of 0.9971, which indicates an excellent agreement between the predicted and actual strain values during the training phase. This phase also yielded a remarkably low MSE of , thus, confirming minimal error and the ability of the model to learn the underlying patterns effectively. For the validation dataset, which measures the capability to generalize unseen data, an even higher R-value of 0.9997 was obtained, with an associated MSE of . These results indicate that the ANN maintained its accuracy when applied to data not used during training, thus, demonstrating its robustness. The testing dataset, which provides an independent evaluation of the predictive performance of the model, yielded an R-value of 0.9852 and an MSE of . Although the testing MSE is slightly higher than those for the training and validation datasets, the R-value remains exceptionally high, thus, indicating that the ANN predictions closely align with the actual strain values. This small increase in error for the testing dataset may be attributed to the inherent variability in the dataset or the relatively small testing sample size compared to the training dataset.
Furthermore, the regression plots (as shown in Figure 9) for all data points exhibit an almost perfect alignment of the predicted strain values along the “Y = Target” line, where the target and predicted values are identical.
The regression plots for useful life prediction using the ANN model are illustrated in Figure 10, and they highlight the high predictive accuracy achieved by the model for this parameter, as they show the relationship between the target values of the useful life of the tank obtained from the FEA and the ANN-predicted values for the training, testing, validation, and overall datasets. Just like the strain and stress analyses, the results for useful life prediction demonstrate the capacity of the ANN to model complex nonlinear behavior of oil storage tanks under varying operating conditions.
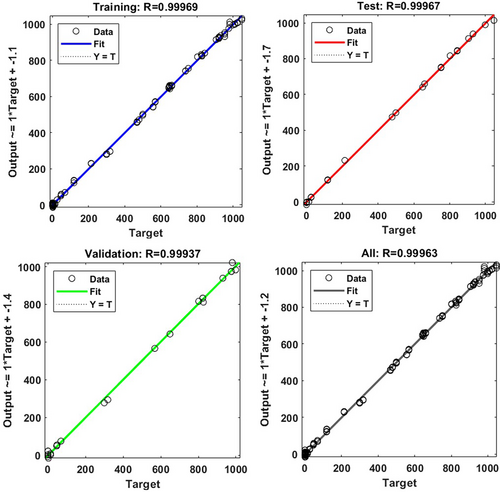
For the training dataset, the ANN achieved a near-perfect R-value of 0.9997, thus indicating an almost exact match between the predicted and actual useful life values during the learning phase. The MSE for the training data was 97.1082, and this further confirms the ability of the model to accurately capture the underlying patterns in the data with minimal error. On the other hand, the validation dataset exhibited a slightly lower R-value of 0.9994 and an MSE value of 220.8524. These results demonstrate that the model generalized well to new data, with a slight increase in error that is expected due to the exposure of the model to previously unseen samples. Similarly, the testing dataset, which independently assesses the predictive ability of ANN, achieved an R-value of 0.9997 with an associated MSE of 101.5271. This high correlation and low error for the testing data further confirm the robustness and reliability of the ANN in predicting the useful life of oil storage tanks across diverse conditions. Just like the predicted stress and strain, the regression plots for all data points for the useful life, as shown in Figure 10, show the accuracy of the model as the predicted values closely align along the Y = Target line. This alignment indicates a strong agreement between the ANN-predicted and actual values across the entire dataset, with minimal deviations, and the minor discrepancies observed can be attributed to natural variability in the dataset, but this remains negligible in the context of the overall performance of the model.
3.6 ANFIS Performance
The Adaptive Neuro-Fuzzy Inference System (ANFIS) model was employed to predict the behavior of oil storage tanks, focusing on stress, strain, and useful life under varying operating conditions. Similar to the ANN, the ANFIS model was trained using FEA-generated data, with 80% of the data used for training and 20% for testing.
Depicted in Figure 11 are the regression plots for the ANFIS stress, strain, and useful life predictions where the results revealed strong predictive performance characterized by their high R2 values and minimal deviation from the actual FEA values.
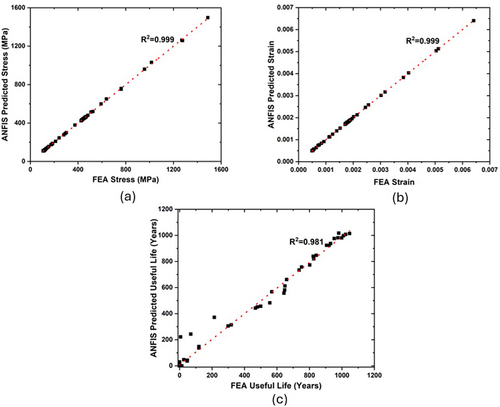
The stress regression plot shown in Figure 11a illustrates an exceptional agreement between the FEA-predicted and ANFIS-predicted stress values as represented by the R2 of 0.999, which signifies a nearly perfect linear correlation between the target and predicted values [36, 37]. This high correlation shows the ability of the ANFIS model to accurately learn and replicate the complex stress behavior of oil storage tanks across varying conditions and geometries.
For strain prediction, the regression plot as depicted in Figure 11b reveals an R2 value of 0.999, similar to the stress prediction results. This value reflects a very strong correlation between the FEA target values and the ANFIS predictions. The red-dotted regression line closely follows the Y = Target line, and the data points remain tightly clustered along this line, indicating minimal errors in the predictions and the effectiveness of the ANFIS model in capturing the strain behavior of the tanks.
The regression plot for useful life prediction, depicted in Figure 11c, demonstrates an R2 value of 0.981, which is considered to be high and confirms the ability of the model to predict the useful life of oil storage tanks under diverse operating conditions. However, the R2 of the predicted useful life is not as high as that of the ANFIS-predicted stress and strain. The lower R2 of the useful life compared to stress and strain could be attributed to the inherently smaller magnitude and sensitivity of useful life values.
3.7 Comparison of ANN and ANFIS for Stress Prediction
For stress prediction, both ANN and ANFIS exhibited excellent performance with extremely high R2 values, indicating a near-perfect correlation between the predicted and FEA target stress values. ANN achieved an R2 value of 0.998, while ANFIS slightly outperformed with an R2 value of 0.999 as depicted in Figure 12a,b. The marginally better performance of ANFIS can be attributed to its ability to integrate fuzzy logic with neural networks, thus allowing it to better handle nonlinear and complex relationships in the stress data. Although the ANN model demonstrated exceptional accuracy and generalization capabilities, the hybrid structure of ANFIS provided a slight edge in learning and predicting stress under varying operational conditions.
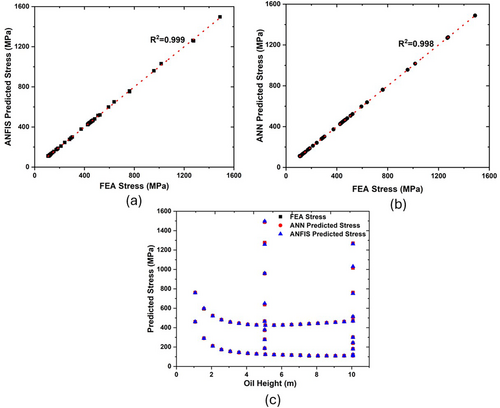
For stress predictions of selected operating conditions (Figure 12c), ANN and ANFIS closely match the FEA results across the entire range of oil heights considered. Both models effectively capture the nonlinear trend observed in the FEA data, including the dip in stress values at mid-level oil heights and the rise at higher levels. However, ANFIS predictions show a slightly tighter clustering around the FEA results, particularly at critical transition points where stress begins to rise or fall significantly. This suggests that ANFIS, with its fuzzy logic capabilities [37], is better at modeling the highly nonlinear and complex stress patterns resulting from diverse operating conditions. ANN also performs well, but slight deviations from the FEA data at certain points highlight its reduced sensitivity compared to ANFIS in handling abrupt variations in stress.
3.8 Comparison of ANN and ANFIS for Strain Prediction
In strain prediction, the ANFIS model (regression plots shown in Figure 13a,b) significantly outperformed the ANN model. The R2 value for ANFIS was 0.999, reflecting an almost perfect correlation between the predicted and FEA strain values. In contrast, the ANN model achieved a slightly lower R2 value of 0.990, indicating robust but comparatively less precise predictions. This difference in performance suggests that ANFIS is better equipped to handle the smaller magnitude and nonlinear variability inherent in strain data, as its fuzzy inference mechanism provides greater flexibility in modeling such subtle fluctuations. While the ANN model performed well, its slightly lower accuracy in strain prediction indicates that it may be less sensitive to these finer-scale variations compared to ANFIS.
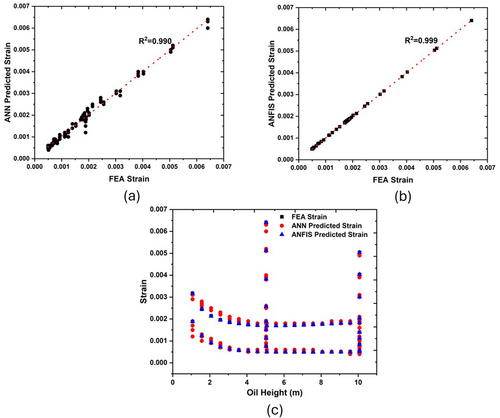
For strain prediction of selected operating conditions (Figure 13c), both ANN and ANFIS demonstrate strong agreement with the FEA results, as they both accurately follow the nonlinear behavior of strain as oil height varies. Similar to the stress prediction, ANFIS achieves a slightly better alignment with the FEA results, particularly in regions where strain exhibits subtle fluctuations. These regions, which are more prone to variability, are better captured by the adaptive nature of ANFIS, which combines fuzzy logic and neural networks to address such complexities. While the ANN prediction is close to FEA results, it shows minor discrepancies at points of abrupt changes in strain; thus, reflecting its slightly lower precision in capturing these sensitive variations.
3.9 Comparison of ANN and ANFIS for Useful Life Prediction
In predicting the useful life, ANN outperformed ANFIS by achieving an R2 value of 0.998 compared to ANFIS's R2 value of 0.981, as depicted in Figure 14a,b. This result shows ANN's superior ability to model parameters with higher variability and complex patterns, such as useful life, that exhibit inherent sensitivity. The slightly lower performance of ANFIS in this area may be due to its reliance on predefined membership functions [38], which might not fully adapt to the variability and smaller scale of useful life data. In contrast, ANN's deep learning architecture allowed it to capture the intricate relationships within the data more effectively, leading to higher accuracy in useful life prediction.
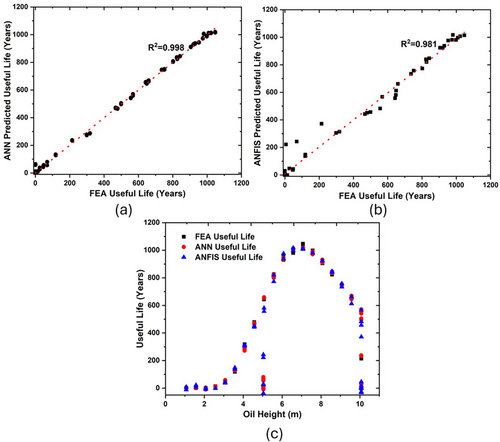
For the useful life predictions of diverse operating conditions (Figure 14c), ANN predictions are more closely aligned with the FEA results compared to ANFIS. Both models successfully capture the bell-shaped trend of useful life as a function of oil height, with the life expectancy peaking at mid-range oil levels and decreasing at lower and higher levels. However, ANFIS predictions exhibit minor deviations from the FEA results, particularly at the peak and the extremes of the oil height range. This could be attributed to ANFIS's reliance on predefined membership functions, which may struggle to fully adapt to the complex and highly sensitive variations in useful life data. In contrast, ANN's deep learning structure appears to be more flexible in handling these intricacies, thus resulting in predictions that are more closely aligned with the FEA data across the entire oil height range.
Generally, both ANN and ANFIS demonstrate exceptional predictive capabilities for stress, strain, and useful life, as they closely replicate the FEA results as shown by the R2 values of the models in Table 6.
| Parameter | ANN R2 | ANFIS R2 | Best model |
|---|---|---|---|
| Stress | 0.998 | 0.999 | ANFIS |
| Strain | 0.990 | 0.999 | ANFIS |
| Useful life | 0.998 | 0.981 | ANN |
4 Conclusion
This study successfully integrates FEA and ML to predict the structural performance and useful life of oil storage tanks under varying operating conditions. The study provided crucial insights into the effects of loading scenarios, filling levels, and external pressures on tank behavior, and the results revealed that filled tanks experience significantly higher stress (485.4 MPa) and reduced useful life (1429 h) compared to half-filled tanks, which exhibited lower stress levels (388.7 MPa) and an extended life expectancy (3551 h). Stress and strain were found to concentrate primarily in the windward direction and at the tank base, thus highlighting these regions as critical for structural failure under combined internal and external pressures. Validation of FEA results against analytical methods demonstrated strong agreement, thus confirming the reliability of thesimulations.
Machine Learning models, Artificial Neural Networks (ANN) and Adaptive Neuro-Fuzzy Inference Systems (ANFIS) were trained using high-fidelity data from FEA and fe-safe post-processing software. ANFIS outperformed ANN in predicting stress and strain, achieving near-perfect R2 values of 0.999, while ANN excelled in useful life prediction with an R2 value of 0.998. Both models demonstrated exceptional accuracy, reducing computational costs compared to standalone FEA by enabling rapid predictions once trained. These findings validate the potential of hybrid FEA-ML methodologies to enhance prediction capabilities and decision-making processes for complex engineering systems.
Furthermore, this hybrid approach used in this study addresses the inherent limitations of FEA, such as its computational intensity, by leveraging the speed and adaptability of ML. The methodology provides actionable insights for optimizing design, enabling real-time monitoring, and facilitating predictive maintenance. The ability to accurately predict critical performance metrics, such as stress distributions and useful life, ensures improved safety and reliability in industrial operations.
The results obtained validate the potential of the FEA-ML framework to transform industrial tank management by enabling rapid and reliable assessments of tanks without costly FEA iterations. For broader adoption, future work should incorporate dynamic loads (e.g., seismic activity) and real-time sensor data, while extending the methodology to other pressure vessel designs to optimize safety and maintenance across energy infrastructure.
In addition to advancing research on oil storage tanks, the results obtained validate the potential of the FEA-ML framework to transform industrial tank management by enabling rapid and reliable assessments of tanks without costly FEA iterations. For broader adoption, future work should incorporate dynamic loads (e.g., seismic activity) and real-time sensor data while extending the methodology to other pressure vessel designs to optimize safety and maintenance across energy infrastructure. Also, the integration of FEA with ML models offers considerable advantages for various engineering industries, including aerospace, automotive, biomedical, and manufacturing, especially in the design and prototyping phases, where the trained ML models can be leveraged to rapidly predict structural responses under different loading conditions.
Author Contributions
Themba Mashiyane: conceptualization, methodology, software, data curation. Lagouge Tartibu: supervision, writing – review and editing. Smith Salifu: software, writing – review and editing, data curation.
Acknowledgments
This research is supported by the National Research Foundation of South Africa under the Unique Grant No: PMDS22070431246, and the University of Johannesburg, South Africa. The authors also appreciate the support of the Sound and Vibration Laboratory at the Tshwane University of Technology, South Africa, and Eskom Power Plant Engineering Institute (Republic of South Africa).
Ethics Statement
The authors have nothing to report.
Consent
The authors have nothing to report.
Conflicts of Interest
The authors declare no conflicts of interest.
Open Research
Data Availability Statement
All data generated or analyzed during this study are included in this article.


