Numerical Simulation Study of CO2 Injection for Enhanced Recovery in Depleted Gas Reservoirs
Funding: This work was supported by Study on Enhanced Recovery by CO2 Drive and Its Effective Sequestration in Hydrous Gas Reservoirs in Sichuan Basin and Effective Sequestration of CO2 Drive in Water-Bearing Gas Reservoirs in the Sichuan Basin (Project No.: U23A2022); Technical Study on the Mechanism of Carbon Dioxide Driven Gas Recovery Enhancement and Evaluation of Geological Burial Potential in Sichuan Basin (Project No.: JS2022-184).
ABSTRACT
The Sichuan Basin is rich in gas reservoirs, most of which are in the middle to late stages of development and have significant potential for CCUS (Carbon Capture, Utilization, and Storage). To reduce CO2 emissions and assess the feasibility of CCUS-EGR, Wells 47 and 67 in the Maokou Formation of the Wolonghe Gas Field were selected for CO2 injection tests. Drawing on gas storage operation and reservoir development experiences, numerical simulation was used to design parameters such as CO2 injection mode, timing, and injection-production well pattern. Simulations were conducted on the CO2 storage mechanism in the depleted gas reservoir of Well 47 and the numerical model study of CO2 injection and storage at Well 67. Firstly, Well 47 was analyzed to assess changes in reservoir temperature and pressure under varying CO2 injection rates, timings, and temperatures, revealing the CO2 migration distribution within the formation. Then, a comparative analysis of Well 67 evaluated cumulative natural gas production under different injection gases, production rates, and injection-production ratios, involving Wells 67, 83, and 47. Finally, the optimal injection-production parameters and CO2 injection scheme were determined: (1) Well 067-C1 and Well 067-C2 were injected with CO2 at 150,000 m3/day; (2) Well 47, Well 67, and Well 83 produce gas at 100,000 m3/day; (3) Well 83 and Well 47 were closed immediately after the breakthrough. The scheme can cumulatively recover 530 million m3 of natural gas, accounting for 9.64% of dynamic reserves, accounting for 8.03% of geological reserves, and can store 3.686 million tons of CO2. This simulation test is the first new energy project of Southwest Oil & Gas Field Company on CO2 injection to enhance oil recovery. This simulation test provides support for the gas field company to explore the scientific development path of low-carbon new energy through the pilot test of CCUS-EGR.
1 Introduction
Climate change is the focal issue globally in the 21st century, and achieving carbon peak and carbon neutrality is the essential path to addressing climate change. China is also adopting more robust policies and measures, striving to peak CO2 emissions by 2030 and achieve carbon neutrality by 2060 [1-3]. Currently, CCUS (Carbon Capture, Utilization, and Storage) technology is considered one of the most effective means of reducing CO2 emissions. This is achieved by injecting the captured CO2 in a supercritical state into underground reservoirs, where a series of geological reactions lead to the permanent sequestration of CO2 [4]. This technology has become a primary choice for the decarbonization and zero-carbon utilization of fossil energy [5, 6]. Among these, CCUS-EOR (Enhanced Oil Recovery) and CCUS-EGR (Enhanced Gas Recovery) are the primary methods for large-scale CO2 utilization and are key technologies for significantly improving the recovery rates of low-permeability oil and gas fields [7, 8]. With the continuous development of CO2 flooding technology, it has been widely applied in low-permeability reservoirs [9, 10], and CO2 flooding has become one of the main oil recovery technologies in China's low-permeability oil fields [11-14]. However, China has significant potential for CCUS-EOR, and integrating CO2-enhanced oil recovery with storage is certain to be a future development trend [15]. Currently, CCUS-EOR technology has been widely applied in oil fields both domestically and internationally, but CCUS-EGR technology remains at the theoretical research stage [16]. Research has shown that injecting CO2 into shale can effectively increase shale gas recovery rates compared to not injecting CO2 [17]. However, the earlier the CO2 breakthrough occurs, the lower the recovery rate [18]. The complex geometry of fractures has a significant impact on the performance of continuous CO2 injection [19]. A comparison between vertical and horizontal continuous injection techniques shows that continuous horizontal CO2 injection is more effective, leading to higher injection rates and benefiting the long-term improvement of natural gas recovery rates [20, 21]. The earlier the timing of gas injection, the greater the potential increase in the recovery rate of the reservoir. Additionally, the mechanisms of molecular diffusion and adsorption significantly contribute to the CO2 storage capacity [22, 23]. Experimental and numerical simulation studies conducted on natural gas from unconventional resources have yielded positive results, highlighting the great potential of this technology in enhancing recovery rates through CO2 injection [24, 25]. Due to the diverse types of gas reservoirs in the Sichuan Basin, most of which are in the mid-to-late stages of development, there is significant potential for CCUS. To further study the feasibility of CCUS-EGR technology, a numerical simulation study on enhanced gas recovery through gas injection was conducted on the depleted reservoirs of Wells Wo 67 and Wo 47 in the Maokou Formation of the Sichuan Basin. The simulation set various parameters such as different CO2 injection methods, injection timing, and injection temperatures. Comparisons and optimizations were made based on CO2 migration patterns, formation temperature and pressure, and changes in gas reservoir production to determine the optimal CO2 injection plan. This plan not only improved the recovery rate of the gas reservoirs but also enhanced the efficiency and feasibility of CO2 sequestration. It provides strong support for stabilizing production in mature gas reservoirs, increasing recovery rates, and maximizing the comprehensive benefits of gas reservoirs.
2 Geological Profile
2.1 Geographic Location
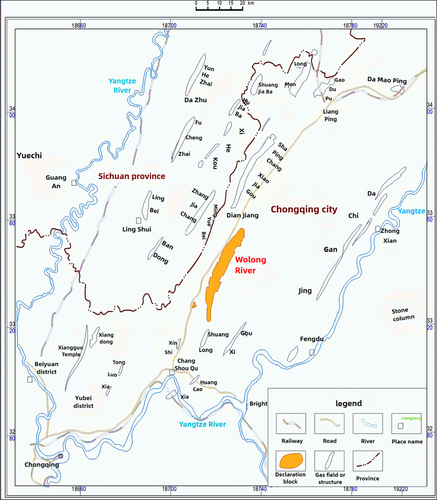
The Wolonghe Gas Field is located within the jurisdictions of Changshou District and Dianjiang County in Chongqing, with a direct distance of 26.5 km northeast of Changshou District. Its geographical location is illustrated in Figure 1. Structurally, it lies in the central part of the high and steep fault-fold belt of the ancient Chongqing uplift within Eastern Sichuan, forming a gentle anticline within the Dianjiang Syncline. It features steep slopes to the west and gentle slopes to the east, bordering the Huangnitang structural saddle to the north and the Shuanglong structural saddle to the south, separated from the Goujiacang structure by the Bashansi Syncline to the east, and adjacent to the Mingyue North structure with the Dianjiang Syncline to the west. The terrain is higher in the north and lower in the south, with an elevation ranging from 320 to 1183 m above sea level. The area of the gas field has a subtropical humid monsoon climate, characterized by long summers and short winters, with distinct seasons. The climate is mild with abundant rainfall, an average annual temperature of 17.1°C, and an average annual precipitation of 1200 mm.
2.2 Sedimentary Phase Characteristics
According to the characteristics and sedimentary phase signatures of the Lower Permian in the work area, as well as the analysis of the regional geotectonic and paleogeographic backgrounds, the sedimentary phase of the Lower Permian Maokou Formation in the work area is mainly an open-sea carbonate terrace phase, which is subdivided into four microphases, as shown in Figure 2.
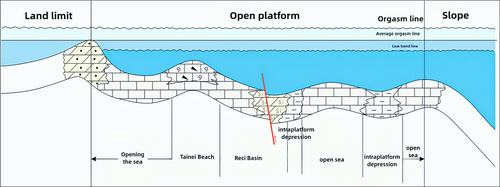
Open seas constitute the main depositional microfacies of open platforms. These environments feature good water circulation, relatively low energy, and normal salinity. In contrast, intraplatform depressions have a higher clay content and are mainly located in lower-lying areas below the average low-tide level. During periods of marine transgression and the early stages of regression, intraplatform shoals can form, characterized by the development of various cross-bedding structures. In the work area, the Lower Thermogenic Subbasin microfacies is primarily influenced by SiO2 anhydride-type hydrothermal fields and Mg-rich brine-type hydrothermal fields, resulting in the formation of siliceous rocks and siliceous dolomites.
2.3 Reservoir Characteristics
The average porosity of the reservoir rocks in the Maokou Formation is low, generally less than 1%, but there are still a small number of high-quality reservoirs. It is mainly dominated by dissolution holes and caves such as intergranular holes, and the reservoir type is fracture-porosity type, which is mainly composed of crystalline dolomite and siliceous dolomite, with strong nonhomogeneity, and the development of the reservoir is related to the rock types of granular tuffs, biotite, crystalline dolomite, and siliceous dolomite, etc. The permeability of the reservoirs mainly ranges from 0.01 to 0.1 mD, which accounts for 48.2%, and those with permeabilities from 1 to 10 mD account for only 2.4%.
2.4 Fluid Properties
The natural gas composition of the Mao 2 gas reservoir in the Well 67 area is primarily methane, which is typical medium sulfurous dry gas, as shown in Table 1. The relative density of natural gas is 0.575 ˜ 0.603, with an average of 0.587; the critical temperature is 193.6 – 197.8 K, with an average of 195.3 K; the critical pressure is 4.670 – 4.773 MPa, with an average of 4.712 MPa. The reservoir water is of two types: stratum water and condensate, and the target reservoir is condensate.
| Well | Relative density of natural gas | Natural gas components(%) | Critical temperature/K | Critical pressure/MPa | |||||
|---|---|---|---|---|---|---|---|---|---|
| CH4 | C2H6 | C3H8 | N2 | CO2 | H2S | ||||
| w47 | 0.575 | 97.31 | 0.29 | 0.02 | 0.21 | 1.63 | 0.52 | 193.6 | 4.670 |
| w67 | 0.582 | 96.57 | 0.29 | 0.02 | 0.23 | 2.11 | 0.77 | 194.6 | 4.694 |
| w83 | 0.579 | 96.85 | 0.30 | 0.02 | 0.35 | 1.78 | 0.67 | 194.0 | 4.679 |
| w86 | 0.571 | 97.88 | 0.25 | 0.02 | 0.23 | 1.35 | 0.24 | 192.7 | 4.649 |
3 Simulation of CO2 Sequestration Mechanism in Depleted Gas Reservoir of Wo 47 Wells
3.1 Numerical Modeling
The sequestration mechanism simulation conducted for Well Wo-47 is based on the TOUGH numerical modeling software. This program is designed for simulating multiphase, multicomponent, and nonisothermal fluid flow, heat transfer, and contaminant transport in porous or fractured media. It utilizes different governing equations for numerical modeling studies. The basic equations are as follows:
-
Mass conservation equation:
-
Flow equations:
-
Cumulative porosity term:
-
Residual term:
-
Iterative process:
-
Convergence conditions:
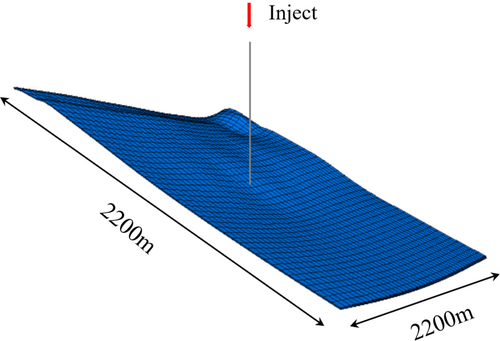
Based on the fundamental equations of the TOUGH model, an initial geological model was established, as shown in Figure 3. The model includes an initial 15% bound water and 95% CH4 content. The formation temperature is approximately 85°C, with a geothermal gradient of 2.3°C/100 m. The pressure in the depleted gas reservoir is 2 MPa, and the model's permeability ranges from 2.5 to 5.1 mD (referencing the permeability model of the Well 67 area). The gas injection rate is 1 kg/s, and the injection temperature is 20°C. The porosity and water saturation for different layers are specified in Table 2.
| Layer number | 1 | 2 | 3 | 4 | 5 | 6 | 7 | 8 | 9 |
|---|---|---|---|---|---|---|---|---|---|
| (%) | 2.10 | 2.80 | 3.88 | 4.30 | 3.70 | 4.00 | 7.50 | 6.00 | 3.60 |
| SW (%) | 22.0 | 19.8 | 18.3 | 10.7 | 8.20 | 7.50 | 6.10 | 6.90 | 9.20 |
3.2 Wellbore CO2 Temperature and Pressure Variation Curve
Injecting into a depleted gas reservoir with a reservoir pressure of 2 MPa at an injection rate of 1 kg/s, the CO2 temperature and pressure variation curves in the wellbore were obtained, as shown in Figure 4. It was observed that the pressure within the wellbore continuously increased with both depth and injection time. This is because CO2 continued to accumulate in the wellbore, leading to a gradual increase in CO2 pressure. Since the injection rate and initial injection temperature were the same, the heat exchange between CO2 and the rock during the injection process was essentially consistent. As a result, the temperature of CO2 upon reaching the bottom of the well was essentially the same at different times. Therefore, while the CO2 temperature in the wellbore increased with depth, it showed very little change over time.

3.3 Formation Pressure Change
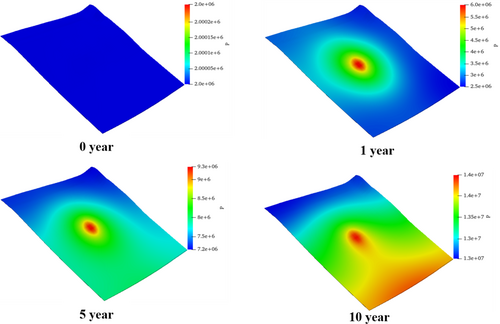
As shown in Figure 5, before the formation pressure rises to the critical pressure of CO2 (within 1 year), the injected CO2 diffusely spreads relatively evenly around the injection point, forming a distinct diffusion ring, and the formation pressure rises uniformly. However, after the formation pressure exceeds the critical pressure of CO2, due to the significant density difference between supercritical CO2 and CH4 in the reservoir, the CO2 tends to migrate toward the lower part of the formation, eventually causing a more rapid increase in pressure in the lower layers.
3.4 Formation Temperature Change
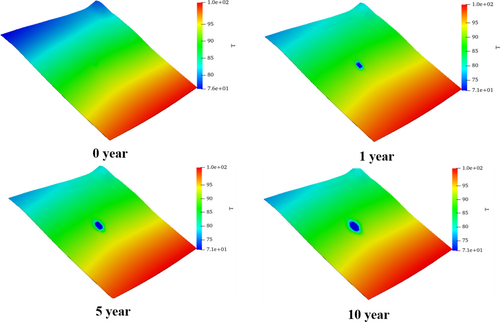
After CO2 injection, due to the low thermal conductivity of the formation, the response of formation temperature changes is slow, resulting in the impact of CO2 on formation temperature being relatively limited. This means the diffusion rate of temperature impact is much slower than that of pressure. Even after 10 years, significant temperature changes are observed only within a 100-m radius around the injection point. This indicates that, compared to pressure effects, the effective distance of temperature transmission in the formation is very limited, as shown in Figure 6.
3.5 Distribution of CO2 in the Reservoir
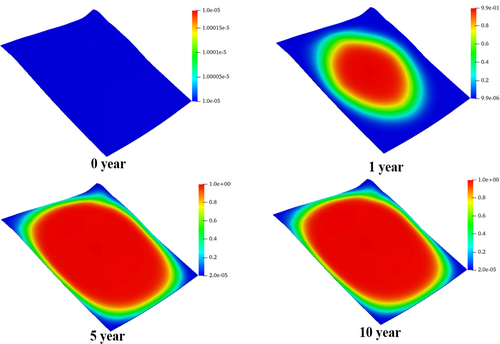
After CO2 is injected into the reservoir, it continuously diffuses and migrates outward at a relatively fast rate, reaching near the boundary (2000 m) 1 year after injection. Over time, CO2 continues to diffuse within the reservoir, gradually saturating the entire formation. This forms a continuous CO2 phase that displaces CH4, with a noticeable displacement effect, as shown in Figure 7.
3.6 The Impact of Injection Rate
3.6.1 Wellbore Temperature and Pressure
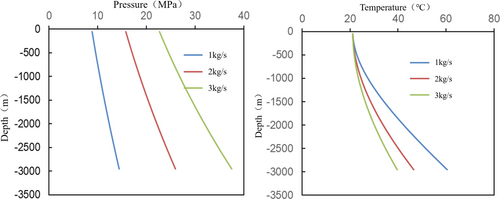
The pressure within the wellbore gradually increases with depth. When injecting CO2 at rates of 1, 2, and 3 kg/s, the temperatures of CO2 upon reaching the bottom of the well are 60.5°C, 46.6°C, and 39.7°C, respectively. The higher the gas injection rate, the shorter the heating process experienced in the wellbore, resulting in a lower temperature at the well bottom. Meanwhile, the pressure also increases with a greater variation as the injection rate increases, as shown in Figure 8.
3.6.2 Reservoir Temperature and Pressure
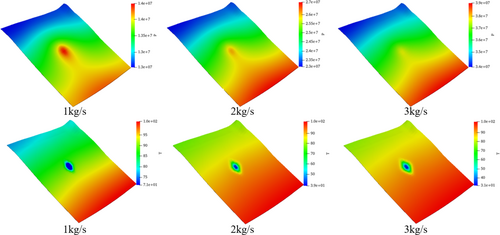
As shown in Figure 9, low-rate CO2 injection has a minimal impact on formation pressure. However, during high-rate injection, the reservoir pressure increases more rapidly. This is because once the reservoir pressure reaches the critical pressure of CO2, there is a tendency for it to migrate to deeper layers, causing the pressure in the lower layers to rise quickly. Meanwhile, the faster the CO2 injection rate, the larger the area affected by temperature changes, but the extent of the temperature impact is still significantly lower than that of the pressure impact. This is because temperature is inherently difficult to change under formation conditions.
3.7 Impact of Gas Injection Timing
3.7.1 Wellbore Temperature and Pressure
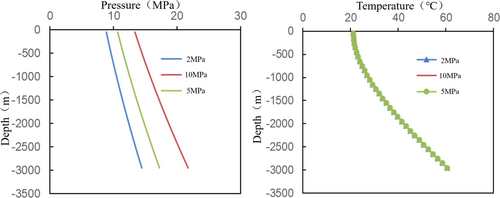
To study the impact of gas injection timing, gas was injected when the reservoir pressures were at 2, 5, and 10 MPa, respectively. The results showed that the higher the remaining pressure in the depleted gas reservoir at the time of injection, the higher the wellbore pressure during the gas injection process. At the same injection rate, since the process of CO2 traveling from the wellhead to the bottom of the well is the same, the temperature of CO2 inside the wellbore is essentially consistent, as shown in Figure 10.
3.7.2 Reservoir Temperature and Pressure
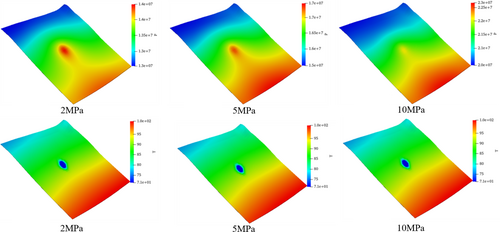
Similarly, when gas injection begins at reservoir pressures of 2, 5, and 10 MPa, once the reservoir pressure rises to the critical pressure of CO2, there is a tendency for it to migrate toward the lower layers. This phenomenon is more pronounced in reservoirs with higher formation pressures. The impact of CO2 injection timing on the temperature range of the reservoir is relatively small, about 100 m, which is significantly less than its impact on the pressure range, as shown in Figure 11.
3.8 Impact of Gas Injection Temperature
3.8.1 Wellbore Temperature and Pressure
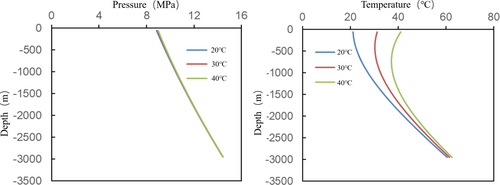
As shown in Figure 12, the simulation found that the pressure of CO2 within the wellbore is not significantly affected by the gas injection temperature; the wellbore pressure remains almost unchanged across different injection temperatures. However, the wellbore temperature will be affected to some extent. If the injection temperature is relatively high, the CO2 temperature within the wellbore will initially decrease and then increase with depth, since the shallow formation temperature is lower than the injection temperature. Eventually, the bottom-hole temperature will reach equilibrium.
3.8.2 Reservoir Temperature and Pressure
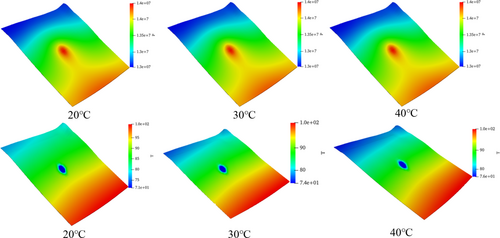
As shown in Figure 13, the pressure increases and the temperature decreases at the CO2 injection point. The injected CO2 diffuses from the well bottom to the lower reservoir, increasing the pressure. However, the impact on reservoir pressure is not significant under different injection temperature conditions. The effect of injection temperature on the reservoir temperature is even smaller, around 100 m, which is much less than its impact on the reservoir pressure. This is because as CO2 diffuses from the well bottom to the lower reservoir, it undergoes heat exchange with the reservoir, resulting in almost no change in reservoir temperature.
4 Numerical Modeling Study of CO2 Injection for Enhanced Gas Recovery and Storage in Wo 67 Wells
4.1 Numerical Model Parameters
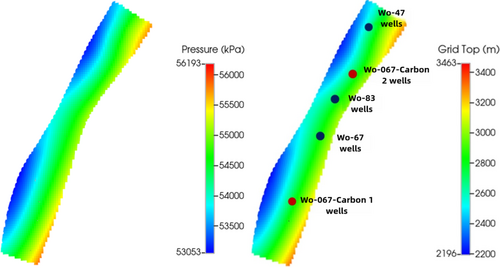
Using CMG software, a compositional model was established with an initial average reservoir pressure of 54.6 MPa and a dynamic reserve of 5.5 billion m3, as shown in Figure 14. Currently, there are five production wells. For CO2 injection for enhanced recovery, the injection wells are Well Wo 067-Carbon1 in the south and Well Wo 067-Carbon2 in the north. The production wells are Well Wo67, Well Wo83, and Well Wo47.
4.2 History Matching
Using a constant gas production regime to match historical production volumes and wellhead pressures, the fitting results show a good history match, indicating the model's reliability. The cumulative gas production is 4.579 billion m3, and the remaining dynamic reserves are 0.931 billion m3, as shown in Figures 15 and 16.


4.3 Current Pressure Distribution Characteristics
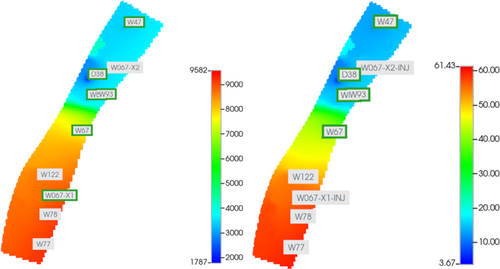
The formation pressure in the southern part of the gas reservoir is significantly higher than in the northern part, with an average formation pressure of 9.3 MPa in the south compared to 3.5 MPa in the north. The overall average formation pressure of the gas reservoir is 6.8 MPa. Additionally, the remaining reserves are mainly located in the southern part of the reservoir, amounting to approximately 6 billion m3, which is about six times that of the northern part, as shown in Figure 17.
4.4 Comparison of Effects of Different Injected Gases
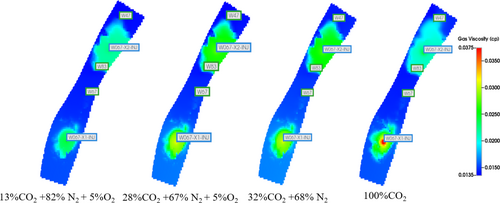
By injecting different gases such as boiler flue gas (13%CO2 + 82%N2 + 5%O2), oxidative absorption tail gas (28%CO2 + 67%N2 + 5%O2), hydrodesulfurization tail gas (32%CO2 + 68%N2), and 100%CO2, the simulation results indicate that the higher the impurity content in the injected CO2, the lower the density and viscosity of CO2. This makes it more difficult to achieve a favorable mobility ratio for displacement, resulting in poorer natural gas displacement efficiency. Pure CO2 offers the best displacement performance, while boiler flue gas with an impurity content of 87% yields the worst displacement result, as shown in Figures 18 and 19.

4.5 Optimization of Gas Production Rate
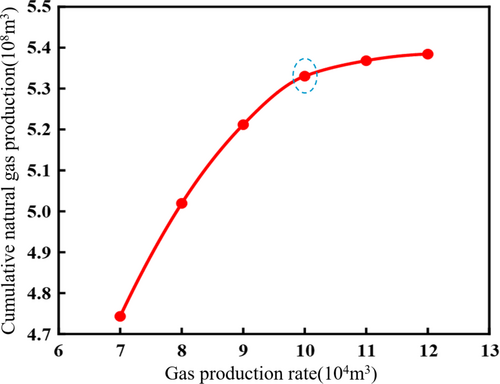
The CO2 injection rate is set at 150,000 m3/day, while the gas production rate ranges from 70,000 to 120,000 m3/day. The simulation reveals that the cumulative natural gas production gradually decreases as the gas production rate increases. When the production rate exceeds 100,000 m3/day, the increase in cumulative natural gas production becomes insignificant, as shown in Figure 20. Therefore, a gas production rate of 100,000 m3/day is recommended.
4.6 Optimization of Injection–Production Ratio
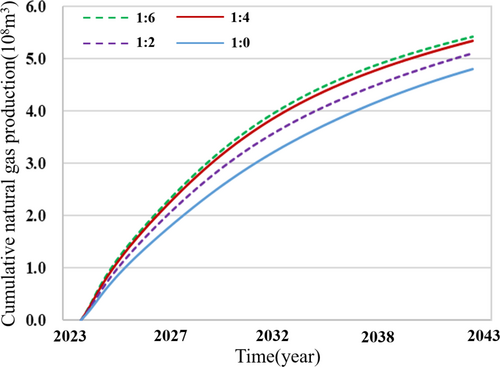
With a gas production rate of 100,000 m3/day, the injection–production ratio is set between 1:0 and 1:6. Simulation results indicate that when the injection–production ratio exceeds 1:4, the increase in cumulative natural gas production becomes negligible, as shown in Figure 21. Therefore, an injection–production ratio of 1:4 is recommended.
4.7 Final Recommendation
- For wells Wo 067-Carbon1 and Wo 067-Carbon2, inject CO2 at a rate of 150,000 m3/day. For wells Wo47, Wo67, and Wo83, produce gas at a rate of 100,000 m3/day;
- After breakthrough in wells Wo83 and Wo47 (with a CO2 content of 10%), the CO2 content in the produced gas increases rapidly, whereas in well Wo67, the CO2 content rises more slowly. Therefore, inject CO2 into wells Wo 067-Carbon1 and Wo 067-Carbon2 at a rate of 150,000 m3/day, and produce gas from wells Wo47, Wo67, and Wo83 at a rate of 100,000 m3/day;
- After the breakthrough, shutting in wells Wo83 and Wo47, compared to continuing production from these two wells, results in a similar cumulative natural gas production, with 530 and 533 million m3 respectively. However, the final CO2 sequestration rates differ significantly between the two scenarios, at 90.36% and 52.93% respectively, as shown in Figure 22. Therefore, the decision is to shut in wells Wo83 and Wo47 earlier.
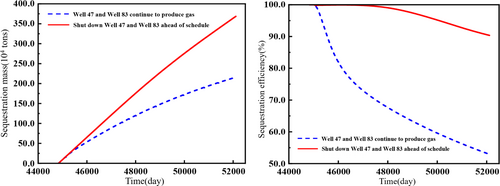
This plan can cumulatively produce 530 million m3 of natural gas, accounting for 9.64% of the dynamic reserves and 8.03% of the geological reserves. It can sequester 3.686 million tons of CO2.
5 Conclusion
- The higher the CO2 injection rate, the lower the temperature at the bottom of the well, and the greater the fluctuation in wellbore pressure. Meanwhile, the reservoir pressure increases more rapidly with high-speed injection, affecting a larger temperature range; however, the range of temperature influence is much smaller than the range of pressure influence;
- The higher the remaining pressure in the depleted gas reservoir, the higher the wellbore pressure during the gas injection process, while the temperature within the wellbore remains relatively consistent. Once the reservoir pressure rises to the critical pressure of CO2, there is a tendency for it to migrate toward the lower formations, with the effect being more pronounced at higher pressures, but with relatively little impact on the reservoir temperature;
- The gas injection temperature has a minimal impact on the bottom-hole pressure. However, during high-temperature gas injection, since the shallow formation temperature is lower than the injection temperature, the temperature of CO2 in the wellbore initially decreases with depth and then increases, eventually reaching uniformity at the bottom. The injection temperature has little effect on reservoir pressure, and the range of its influence on reservoir temperature remains relatively small;
- Different impurity gases have varying impacts on natural gas production. Boiler flue gas with an impurity content of 87% has the least effective displacement, while pure CO2 provides the best displacement effect and results in the highest production.
-
When the gas production rate exceeds 100,000 m3/day and the injection-production ratio is greater than 1:4, the increase in cumulative natural gas production is not significant. Therefore, it is recommended to maintain a gas production rate of 100,000 m3/day and an injection-production ratio of 1:4.
Author Contributions
Mengyu Wang: conceptualization. Yu Luo: validation. Zihan Zhao: visualization. Yulong Zhao: methodology. Yu Li: software. Xia Wang: project administration. Nan Qin: data curation. Cheng Cao: writing – original draft. Ruoyu Mu: writing – review and editing.
Conflicts of Interest
The authors declare no conflicts of interest.
Open Research
Data Availability Statement
The data that support the findings of this study are available on request from the corresponding author. The data are not publicly available due to privacy or ethical restrictions.


