Robust Expansion Planning of Distribution Network in Presence of Electric Vehicles to Improve Economic Parameters and Reduce Energy Consumption
ABSTRACT
First-world countries and underdeveloped countries share concerns regarding global warming, climate change, and climate migration. Hence, one of the greatest issues faced by governments in the present day is to effectively control the escalating pace of climate change and achieve equilibrium since it directly impacts the future. The fate of the human race hinges on this matter. One of the contributors to the production of pollutants and global warming is the use of cars based on nonrenewable fuel. Consequently, most governments must eliminate fossil fuel vehicles and substitute them with electric vehicles (EV) as part of their short-term and long-term goals. However, the growing adoption of EVs has made it crucial for operators and network designers to strategically plan for electric power consumption, adapt the distribution network structure, and accurately determine the optimal number and positioning of charging stations. Thus, this paper utilizes a convex solution method based on integer linear programming to effectively plan the expansion of the distribution network considering the availability of EV charging stations, compensators, substations, resources, and new lines. This article aims to minimize the long-term expenses associated with constructing network infrastructure, subtransmission substations, EV charging stations, building sources, capacitor banks, and procuring power from the upstream network. The YALMIP toolbox in MATLAB software was utilized to model and solve the objective function of this problem, which is expressed in both deterministic and nondeterministic versions. The MOSEK solver was employed as the problem-solving tool. Three scenarios were implemented to plan the growth of the network on the 18-bus bus system. The results indicate that having EV charging stations in the network can be advantageous as it improves reliability and reduces network costs.
1 Introduction
1.1 Problem Description
With escalating population growth and the subsequent surge in energy demand, especially for electricity, governments worldwide are increasingly focused on ensuring reliable energy supplies. To meet this growing demand, it's crucial to enhance the energy distribution network infrastructure. This development must adhere to the network's technical and operational constraints while also remaining economically viable. Simultaneously, international environmental agreements have pushed nations to reduce their dependence on fossil fuels and minimize pollution through stricter regulations. As a result, there has been a significant shift toward integrating renewable energy sources and electric vehicles (EVs) into energy systems. These factors have driven energy operators to seek advanced Distribution Network Expansion Planning (DNEP) strategies that effectively incorporate these new resources.
1.2 Literature Review
1.2.1 Research on Combining DNEP With New Technologies Placement
Considerable research has explored the integration of DNEP with optimal placement problems. For example, [6] investigates the optimal placement of renewable-based Distributed Generation (DG) and energy storage devices in distribution networks. This is formulated as a stochastic, multistage conic programming problem, ensuring the achievement of an optimal solution. Article [7] focuses on modeling and analyzing the location of EV charging stations within the DNEP framework, considering both technical and economic aspects. The integration of these considerations leads to reduced power losses and improved network voltage profiles. Economically, it also lowers the overall system cost. The problem is formulated as a convex optimization. Paper [8] discusses the incorporation of EV charging stations and DGs into DNEP, driven by the utilization of renewable energy sources, the provision of reliable network load, and the promotion of sustainable development in distribution networks. The problem is formulated as a two-stage optimization and solved using a hybrid genetic algorithm and particle swarm optimization. The results highlight a continuous and significant growth in EV adoption through this approach. Article [9] introduces a stochastic–probabilistic model, combining probability distribution and fuzzy membership functions, for determining the placement of EV parking lots in DNEP. The problem is solved using a Pareto-based optimization method. The study focuses on the 24-bus radial network of Qale'ganj town in Kerman, Iran. This approach not only reduces charging station investment costs but also ensures adequate energy supply for EV drivers.
1.2.2 Various Solution Models for the DNEP Problem
Extensive research has focused on developing solution models for DNEP. For instance, [10] explores integrating emergency storage systems into DNEP, formulating the problem as a mixed-integer nonlinear multistage program for peak shaving. Solved using a particle swarm algorithm, this approach effectively reduces costs and enhances line loading and voltage profiles. Paper [11] evaluates the incorporation of EV charging stations into DNEP through a multi-objective optimization framework. The results demonstrate a successful balance between technical and economic objectives, with the framework also serving as a charging coordination tool for urban transportation. Paper [12] investigates the integration of coordinated EV charging management with DNEP, employing a scenario-based approach to integrate vehicles, limit peak network strain, and minimize expansion costs.
Paper [13] presents a mixed-integer linear programming approach for DNEP, specifically addressing high wind turbine penetration. Paper [14] introduces a stochastic mixed-integer convex programming model aimed at reducing greenhouse gas emissions. The findings highlight improvements in environmental objectives and reduced network construction costs, promoting wind energy generation. Paper [15] proposes a mixed-integer linear programming model that incorporates network reliability indicators into DNEP through linear reliability constraints. Paper [16] introduces a multi-objective programming model for all-renewable distribution systems, balancing technical and economic considerations. Solved using a Pareto-based method, this approach facilitates the growth of solar power plants. Paper [17] presents a flexible, two-stage dynamic model for DNEP, investigating the impact of synchronized EV charging in parking lots and the potential conflict between parking lot owners and network operators. Paper [18] introduces a flexible, two-stage integer linear programming model for active DNEP, incorporating DGs and storage while focusing on economic risk minimization. Finally, [19] examines a three-stage dynamic DNEP for private power systems, successfully solved using Benders' decomposition.
1.2.3 Research on the Management of Uncertainty in DNEP
Paper [20] investigates the integration of solar panel installation into DNEP, considering both technical and economic aspects, as well as the challenges posed by load and DG uncertainties. The study employs innovative approaches to enhance network flexibility, accommodating annual demand growth. Paper [21] presents a comprehensive optimization methodology for DNEP, explicitly addressing load uncertainty. The results demonstrate reduced line congestion, lower losses, improved reliability, and deferred network line expansion. Authors in [22] propose a two-stage stochastic mixed-integer conic programming model, accounting for load and wind turbine resource uncertainties. The primary advantage of this approach lies in its accurate modeling of uncertainty, closely mirroring real-world conditions. However, the method suffers from relatively low computational efficiency. Paper [23] introduces a nonconvex nonlinear DNEP model that incorporates uncertainties associated with wind, EVs, and demand response programs. An enhanced bee algorithm is utilized for solving this model, resulting in reduced losses and costs. Paper [24] presents a robust two-level programming framework for active distribution networks, addressing renewable energy source uncertainties. The model is formulated as a quadratic mixed-integer conic programming problem. In summary, uncertainty is a critical factor in DNEP, necessitating robust and adaptable planning methodologies. Paper [25] explores multistage expansion planning for active distribution networks, addressing uncertainties related to load, EVs, and renewable resources. An uncertainty matrix is developed to demonstrate the correlation between these uncertainties. Study [26] investigates the integration of renewable energy source uncertainties into a linear multi-objective optimization model, focusing on maximizing renewable energy integration. Paper [27] introduces a conic quadratic multi-objective model for DNEP that incorporates stochastic uncertainty. The results demonstrate that random scenario weighting leads to reduced operating costs and enhanced network reliability and stability. The uncertainty of EVs in DNEP is modeled using a scenario-based stochastic technique in [28]. The problem is formulated as an integer linear programming problem, resulting in decreased line congestion and improved network reliability. Paper [29] considers the uncertainty of EV driver behavior in DNEP, leading to increased EV driver participation in demand response programs. Study [30] examines a four-stage DNEP, incorporating electricity market uncertainties in the upstream network and their impact on downstream electricity pricing and demand response programs. The investigation reveals that this approach results in energy savings.
1.3 Research Gaps and Necessity
Based on the review of research presented in the field of modern DNEP, it can be concluded that with the increase in the level of penetration of sources of uncertainty in distribution networks, such as renewable production, EVs, load fluctuations, and changes in the electricity market, DNEP encounters new challenges and evolutions. The discussion of the reliability of distribution networks, network security constraints, and economic exploitation of distribution networks has attracted great attention in recent years. According to the studies that were examined in the previous section, the research gaps of the studies conducted in this field can be examined in the form of Table 1. By examining the comparison Table 1, it can be clearly observed that many previous studies have addressed different aspects of DNEP separately. For example, some studies have focused solely on the placement of capacitors or energy storage devices, while others have addressed the planning of transmission lines or EV charging stations. Furthermore, many studies have used classical or metaheuristic solution methods, which may perform poorly in the face of uncertainties. As seen in the table, the use of robust optimization methods to manage uncertainty in DNEP research has received less attention. Also, few studies have simultaneously addressed the planning of EV charging stations and distribution network infrastructure. This indicates a gap in the existing research, as the mutual effects of these two aspects on the energy system performance are significant. In contrast, the present study addresses these gaps by providing an integrated and robust modeling approach. As shown in the table, this research simultaneously addresses the planning of capacitors, transmission lines, EV charging stations, and uncertainty management and uses robust optimization methods to solve the problem.
| Solution method | |||||||||||
|---|---|---|---|---|---|---|---|---|---|---|---|
| Reference no | Capacitor banks | Storage devices | Electricity substations | Source construction | Lines | EV charging stations | Uncertainty | Robust | Classic | Metaheuristic | Hybrid |
| [6] | ✗ | ✓ | ✗ | ✓ | ✗ | ✗ | ✗ | ✗ | ✓ | ✗ | ✗ |
| [7] | ✗ | ✗ | ✗ | ✗ | ✗ | ✓ | ✗ | ✗ | ✓ | ✗ | ✗ |
| [8] | ✗ | ✗ | ✗ | ✓ | ✗ | ✓ | ✗ | ✗ | ✗ | ✗ | ✓ |
| [9] | ✗ | ✗ | ✗ | ✗ | ✗ | ✓ | ✗ | ✗ | ✗ | ✓ | ✗ |
| [10] | ✗ | ✓ | ✗ | ✗ | ✗ | ✗ | ✗ | ✗ | ✗ | ✗ | ✓ |
| [11] | ✗ | ✗ | ✗ | ✓ | ✓ | ✗ | ✓ | ✗ | ✗ | ✓ | ✗ |
| [12] | ✗ | ✗ | ✗ | ✗ | ✓ | ✓ | ✗ | ✗ | ✗ | ✗ | ✓ |
| [13] | ✗ | ✗ | ✗ | ✗ | ✓ | ✓ | ✗ | ✗ | ✓ | ✗ | ✗ |
| [14] | ✗ | ✗ | ✗ | ✓ | ✗ | ✗ | ✗ | ✗ | ✓ | ✗ | ✗ |
| [15] | ✗ | ✗ | ✗ | ✓ | ✓ | ✗ | ✗ | ✗ | ✓ | ✗ | ✗ |
| [16] | ✗ | ✗ | ✗ | ✗ | ✓ | ✗ | ✓ | ✓ | ✗ | ✗ | ✗ |
| [17] | ✗ | ✗ | ✗ | ✗ | ✓ | ✗ | ✗ | ✗ | ✓ | ✗ | ✗ |
| [18] | ✗ | ✗ | ✗ | ✓ | ✗ | ✗ | ✗ | ✗ | ✗ | ✓ | ✗ |
| [19] | ✗ | ✗ | ✗ | ✗ | ✗ | ✓ | ✗ | ✗ | ✗ | ✗ | ✓ |
| [20] | ✓ | ✗ | ✗ | ✓ | ✓ | ✗ | ✗ | ✗ | ✓ | ✗ | ✗ |
| [21] | ✗ | ✗ | ✗ | ✓ | ✗ | ✗ | ✓ | ✗ | ✓ | ✗ | ✗ |
| [22] | ✗ | ✗ | ✗ | ✓ | ✗ | ✓ | ✓ | ✗ | ✗ | ✓ | ✗ |
| [23] | ✗ | ✗ | ✗ | ✓ | ✓ | ✗ | ✓ | ✗ | ✓ | ✗ | ✗ |
| [24] | ✗ | ✓ | ✗ | ✓ | ✗ | ✓ | ✓ | ✗ | ✓ | ✗ | ✗ |
| [25] | ✗ | ✗ | ✗ | ✓ | ✗ | ✗ | ✓ | ✗ | ✓ | ✗ | ✗ |
| [26] | ✗ | ✗ | ✗ | ✓ | ✗ | ✗ | ✓ | ✗ | ✓ | ✗ | ✗ |
| [27] | ✗ | ✗ | ✗ | ✗ | ✓ | ✓ | ✓ | ✗ | ✓ | ✗ | ✗ |
| [28] | ✗ | ✗ | ✗ | ✗ | ✓ | ✓ | ✓ | ✗ | ✗ | ✓ | ✗ |
| [29] | ✗ | ✓ | ✗ | ✓ | ✓ | ✗ | ✓ | ✗ | ✗ | ✗ | ✓ |
| [30] | ✗ | ✗ | ✓ | ✓ | ✓ | ✗ | ✗ | ✗ | ✓ | ✗ | ✗ |
| Proposed solution | ✓ | ✗ | ✓ | ✓ | ✓ | ✓ | ✓ | ✓ | ✓ | ✗ | ✗ |
- Lack of coordinated planning of the distribution network in the presence of EV charging stations: Many studies have addressed the planning of the distribution network and the placement of charging stations separately, without considering their mutual effects.
- Use of metaheuristic methods or nonrobust classical methods to solve the problem: These methods may lead to local optimal results and perform poorly in the face of uncertainties.
- Ignoring the uncertainty parameter in most studies: Uncertainty in EV charging patterns, electrical load, and electricity prices significantly impacts DNEP decisions and must be considered.
- Examining DNEP from a limited perspective (lines, DG, or charging stations): Many studies have examined these aspects separately, and an integrated model that considers all of these factors is lacking.
1.4 Novelties and Contributions
- Integrated and Robust Modeling: Unlike previous research that addressed the planning of charging stations and the distribution network separately, this research provides an integrated model that considers their mutual effects. Furthermore, robust optimization methods are used to manage uncertainties in EV charging patterns, electrical load, and electricity prices. This integrated modeling directly answers the reviewer's question about integrated modeling and identifies the main innovation of the research.
- Coordinated Infrastructure Planning: This research addresses the coordination of EV charging station construction with DNEP, which leads to improved economic and technical performance of the system. This approach effectively responds to the increasing use of EVs and provides optimal decisions for upgrading network equipment.
- Mathematical Optimization for Efficient Solutions: This research uses integer linear programming to solve the complex problems of network expansion and EV integration, which lead to optimal decisions for building or strengthening network equipment. This method, compared to metaheuristic methods, leads to more accurate and reliable results.
This research provides a comprehensive framework for distribution network planning that addresses the challenges in this field by integrating coordinated EV charging and uncertainty modeling.
1.5 Paper Organization
In Section 2, the authors provide a model for the coordinated planning problem of network expansion and the development of charging stations. Section 3 provides a detailed explanation of the proposed model, Section 4 carries out simulations, and Section 5 presents a concise overview of the results.
2 Modeling the Network Expansion Planning
2.1 Objective Function
- The investment cost of branches (investment on lines): which is obtained from the product of the three parameters of line length, line type price, and its construction status in Equation (1):
(1)
- Substation investment cost: which is the result of the product of the two expressions of substation investment rate and its construction status, defined according to Equation (2).
(2)
- The cost of capacitor banksincludes two costs: one is the cost of building the bank, and the other is the cost of installing each module of that capacitor, defined according to Equation (3):
(3)
- The cost of DG units: which only includes the construction rate of that DG unit and the construction status, defined according to Equation (4):
(4)
- Energy-related costs: This cost is the amount of energy purchased from the upstream network and the cost of power generation by the DG unit, which is defined according to Equation (6):
(6)
- The cost of substation operation: In fact, this is the cost of apparent power supplied by the substation. This cost is omitted here because it is a very small amount compared to the cost of constructing a substation, which is zero according to Equation (7):
(7)
2.2 Constraints of the Problem
2.2.1 Constraints of Continuous Variables
There are many boundary constraints for the DNEP problem, and compliance is mandatory in the problem and leads to the achievement of correct and logical solutions, which will be presented in the following equations.
2.2.1.1 Constraints of Power Flow
- Balancing reactive power: It should be noted that DGs here are also capable of producing reactive power, and in other words, all DGs are considered fixed power factor types. This adverb is following Equation (10):
(10)
- Calculating the amplitude of the current flowing through the line: In the case of the relationship between voltage and current, the definition of the power flowing through the lines can be used. The prime sign used on voltage shows that the voltage of the bus was estimated so that the problem preserves its linear form, and it is expressed as Equation (11):
(11)
- Calculation of the voltage drop on the line: Regarding this relationship, it can be said that usually in distribution networks, the voltage drop has a relationship with active and reactive power in the form of Equation (12). In some research, it is even observed that the term multiplied by the impedance is also omitted.
(12)
Another crucial aspect of Equation (12) is that when a line is not established, this relation remains unchanged. However, if a line is constructed, the outcome of the absolute value will be equal to or smaller than zero. Since the absolute value always yields a non-negative result, the term within the absolute value must be zero in this scenario. This leads to the convergence of the problem toward the relationship of the voltage drop in the radial network.
2.2.1.2 Operation Constraints
- Bus voltage limit: The bus voltage must always be within the predetermined allowed range according to Equation (13):
(13)
- Limitation of the current flowing through the lines: the current passing through the lines must always be less than its nominal value according to Equation (14):
(14)
2.2.2 Conditions of Discrete Variables
- The constraint related to preventing the implementation of more than one type of investment in each stage (i.e., in each stage, only one power capacity can be selected for construction or reinforcement according to Equation (15)):
(15)
- Investment in the substation according to Equation (16) is done only once in the planning period:
(16)
- Substation reinforcement according to Equation (17) can only be done when there is a substation in the circuit in the previous stage.
(17)
- The constraint that guarantees the operation of the substation will be activated when it has already been invested in is defined according to Equation (18):
(18)
2.3 Model of the Charging Station
- Constraint (25) is a condition that guarantees that the EV charging station is placed only once in each bus:
(25)
- Constraint (26) is a condition that allows the charger to be installed only when there is already a charging station there.
(26)
- Constraint (27) is a condition that limits the number of working chargers in each stage:
(27)
- Constraint (28) is a condition that relates the number of EVs of a specific type that need charging to the number of vehicles assigned to each node:
(28)
- Constraint (29) is a condition that guarantees that the energy supplied by the charging station can meet the needs of the vehicles:
(29)
- Constraint (30) is a chance-based expression, which includes the stochastic behavior of traditional loads and EV loads.
(30)
- Constraint (32) expresses the relationship between the power passing through the substation based on the injected power from DGs and the required load of EVs:
(32)
- The standard deviation of apparent power is expressed according to Equation (33):
(33)
2.4 Uncertainty and Robust Optimization Modeling
2.4.1 Uncertainty Modeling
The parameters μi and σi2 represent the mean and variance of the load demand variations at bus i, respectively. These parameters can be estimated using historical load demand data and EV charging patterns. In the mathematical programming model, di is considered a stochastic variable.
2.4.2 Scenario Generation
To solve the model, a Monte Carlo simulation approach is employed to generate samples of di. Monte Carlo simulation is a stochastic sampling method used to solve complex problems with uncertainty. Using the probability density function f(di), 1000 random samples of di are generated. These samples are denoted as di1, di2, …, di1000. The inverse transform sampling method is used for sample generation.
2.4.3 Sample Generation With Inverse Transform Sampling
Since solving the network expansion planning model for a large number of scenarios is computationally intensive, this paper employs scenario reduction techniques to reduce the number of scenarios and find the worst-case scenario more efficiently.
2.4.4 Distance-Based Scenario Reduction
In this method, scenarios that are close to each other are merged. The distance between scenarios can be calculated based on various metrics, such as Euclidean distance or Manhattan distance. This method helps to eliminate redundant and closely related scenarios.
2.4.5 Solving the Robust Optimization Objective Function
3 Solution Method and Optimization Problem
- Definition of variables and parameters: Precise definition of decision variables (such as the capacity of charging stations, their installation locations, and network line expansion) and input parameters (such as network load, EV charging profiles, and technical network constraints).
- Definition of objective functions and constraints: Accurate formulation of objective functions (such as minimizing network development and operational costs) and technical and operational constraints (such as bus voltage limits, line capacity limits, charging station limits, and unsupplied load limits).
- Conversion of the problem into a format understandable by optimization solvers: YALMIP converts the optimization problem into a standard format that can be understood and solved by optimization solvers such as MOSEK.
- Management of discrete and continuous variables: YALMIP effectively manages discrete variables (such as charging station installation locations) and continuous variables (such as station capacities) and enforces their associated constraints.
MOSEK, as a powerful optimization solver, has been used to solve the convex optimization problem with continuous and discrete variables. This software uses branch-and-cut algorithms to solve Mixed-Integer Optimization problems.
3.1 Detailed Description of Problem-Solving Steps
- Modeling the problem in YALMIP: The optimization problem is defined and prepared using YALMIP syntax.
- Sending the model to MOSEK: The model prepared by YALMIP is sent to the MOSEK solver.
-
Solving the problem by MOSEK: MOSEK solves the optimization problem using branch-and-cut algorithms and calculates the optimal values of the decision variables.
Branch-and-cut algorithm:
- Linear Programming Relaxation (LP Relaxation): Initially, the integer constraints are ignored, and the problem is solved as a continuous linear programming problem. This provides a lower bound (for minimization problems) or an upper bound (for maximization problems) for the optimal solution.
- Branching: If the solution obtained in the previous step does not have integer values, a variable with a fractional value is selected, and the problem is divided into two subproblems. In one subproblem, the selected variable is constrained to the nearest integer below its fractional value, and in the other subproblem, it is constrained to the nearest integer above its fractional value. This branching process creates a search tree.
- Cutting: At each node of the search tree, the algorithm attempts to eliminate noninteger solution regions by adding cutting planes (additional constraints). Cutting planes are constraints that do not remove integer solutions but do remove fractional solutions. MOSEK uses various types of cutting planes, such as Gomory cuts, Chvátal-Gomory cuts, and Mixed-Integer Rounding (MIR) cuts.
- Bounding: At each node, the algorithm calculates a lower or upper bound for the optimal solution. If the lower bound of a node is greater than the best integer solution found so far, or if the node is infeasible, the node is pruned (bounded).
- Iteration: Steps 2 to 4 are repeated until an optimal integer solution is found.
- Receiving results from MOSEK: The results of the problem solution are received from MOSEK and returned to YALMIP.
- Analysis of results: The obtained results are analyzed and interpreted.
3.2 Description of the Methods
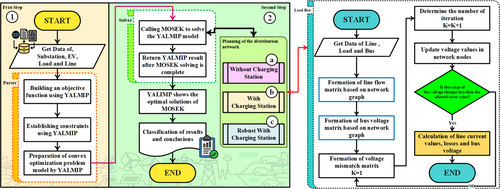
This study addresses the simultaneous planning of distribution networks, integrating EVs and charging stations, formulated as a Mixed-Integer Programming (MIP) problem. To tackle this complex optimization challenge, a hybrid approach leveraging YALMIP and MOSEK software suites is employed. The flowchart depicted in Figure 1 provides a comprehensive visualization of the key stages in this methodology:
3.2.1 Phase 1 (First Step): Problem Formulation With YALMIP
- Data Acquisition (Get Data): The process commences with the acquisition of network data, encompassing information on substations, transmission lines, load profiles, and EV parameters. This data serves as the foundational input for the optimization model.
- Parser Module: The input data undergoes processing and analysis by the YALMIP parser, ensuring compatibility with the modeling framework.
- Objective Function Construction (Building an objective function): Utilizing YALMIP's modeling capabilities, the objective function, typically involving the minimization of investment and operational costs, is precisely defined.
- Constraint Implementation (Establishing constraints): Technical and operational constraints, including voltage limits, line capacity restrictions, EV charging power constraints, and unserved load limitations, are mathematically formulated within YALMIP.
- Convex Optimization Model Preparation (Preparation of convex optimization problem model): YALMIP transforms the MIP problem into a convex optimization formulation, facilitating its solution by the MOSEK solver.
3.2.2 Phase 2 (Second Step): MOSEK-Driven Solution and Power Flow Analysis
- MOSEK Invocation (Calling MOSEK): The YALMIP-prepared optimization model is transmitted to the MOSEK solver.
- Solution and Result Retrieval (Return YALMIP result): MOSEK employs branch-and-cut algorithms to solve the MIP problem, returning the optimal solutions to YALMIP.
-
Distribution Network Planning (Planning of the distribution network): The MOSEK-generated results are utilized as inputs for distribution network planning, encompassing three distinct scenarios:
- ○
Scenario A (Without Charging Station): Network planning devoid of charging station integration.
- ○
Scenario B (With Charging Station): Network planning incorporating charging station infrastructure.
- ○
Scenario C (Robust with Charging Station): Network planning considering uncertainties in charging station operation.
- ○
- Line, Load, and Bus Data Retrieval (Get Data of Line, Load, and Bus): Data pertaining to lines, loads, and buses is collected for power flow calculations.
- Line Flow Matrix Formation (Formation of line flow matrix): The line flow matrix is constructed based on the network's topological structure.
- Bus Voltage Matrix Formation (Formation of bus voltage matrix): Utilizing the line flow matrix and line impedances, the bus voltage matrix is computed.
- Voltage Mismatch Matrix Formation (Formation of voltage mismatch matrix): The voltage mismatch matrix quantifies the discrepancies between calculated and reference bus voltages.
3.2.3 Phase 3 (Third Step): Iteration and Convergence
- Iteration Count Determination (Determine the number of iteration): The iteration count is managed by the counter K.
- Bus Voltage Update (Update voltage values): Bus voltages are updated based on the power flow analysis results.
- Convergence Evaluation (Is the range of bus voltage changes less than the allowed error value?): The convergence criterion is assessed by comparing bus voltage variations against a predefined error threshold. If convergence is achieved, the solution process terminates.
- Line Current, Loss, and Bus Voltage Computation (Calculation of line current values, losses and bus voltage): Upon convergence, the final line current, loss, and bus voltage values are computed.
4 Analysis and Simulation
4.1 Parameter Settings and Network Data
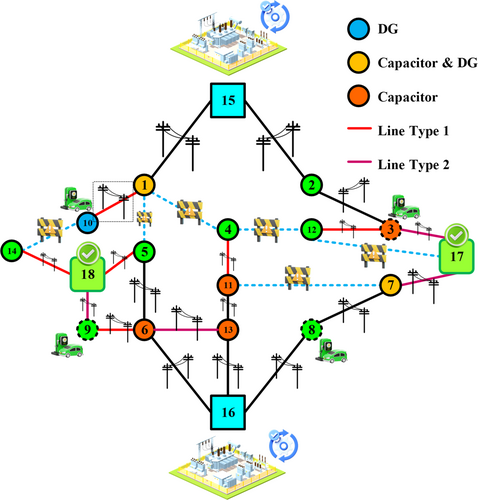
The network under investigation in this paper is an 18-bus network, which is depicted in Figure 2. The graphic depicts the distribution substations as blue squares, the network nodes as green circles, the branches in the network as dark lines, and the proposed branches to be installed in the network as blue dotted lines.
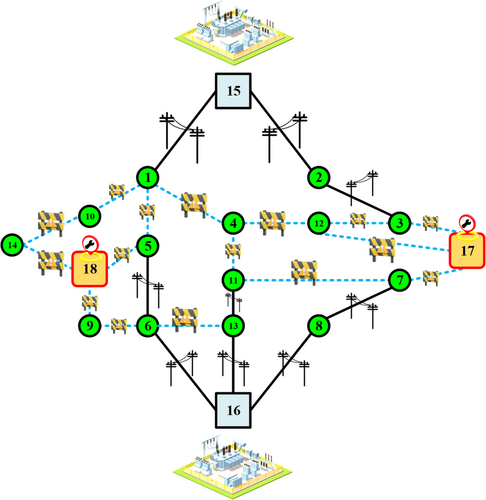
Also, Figures 3 and 4 show the network graph and length. The impedance of each line is 0.02 + j03 Ω/km.
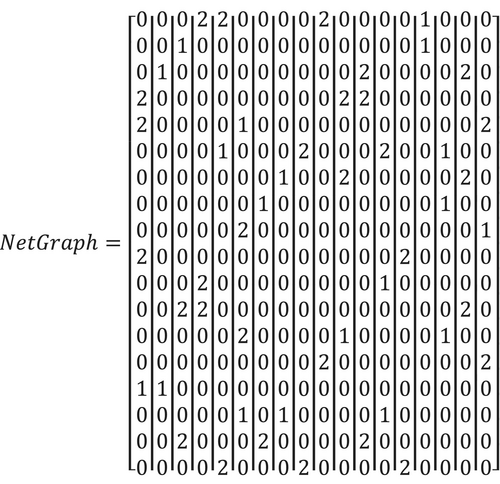
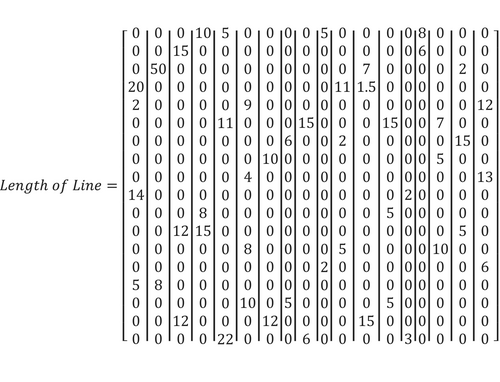
Table 2 additionally displays the costs associated with constructing or reinforcing the substations.
| Construction of a new unit | Unit reinforcement | |||||
|---|---|---|---|---|---|---|
| From type | To type | Price | From type | To type | Price | |
| Branch | Crude | 1 | 1 M$ | 1 | 1 | 0 |
| Crude | 2 | 1.8 M$ | 1 | 2 | 0.8 M$ | |
| Substation | Crude | 1 | 25 k$ | 1 | 1 | 0 |
| Crude | 2 | 35 k$ | 1 | 2 | 30 k$ | |
Type 1 substations possess an 8 MVA capacity, while type 2 substations possess a 12 MVA capacity. Additionally, there is no operational cost for the substation. Branch type 1 has a capacity of 197 A, whereas branch type 2 has a capacity of 314 A. table 3 [32] displays technical and economic data about DGs and energy storage systems. Table 4 shows suggested MOSEK parameter settings.
Table 4 presents suggested settings for key parameters of the MOSEK software, used for solving Mixed-Integer Programming (MIP) problems. These parameters influence the performance and accuracy of the branch-and-cut algorithm employed by MOSEK. The ‘Default Value’ column shows the parameter values in the software's default state, while the ‘Suggested Value’ column provides values recommended for improved performance in complex MIP problems. The descriptions in the last column briefly explain the function of each parameter.
4.2 Simulation Test Case Definition
- Case 1: Deterministic planning of the distribution network in the absence of charging stations
- Case 2: Planning the distribution network in the presence of charging stations
- Case 3: Robust planning of the distribution network in the presence of charging stations
The significance of incorporating charging stations into the planning of distribution networks will become evident when comparing the first and second scenarios. Furthermore, the comparison between the second and third cases emphasizes the necessity of employing the robust approach instead of the deterministic method.
4.2.1 Case 1
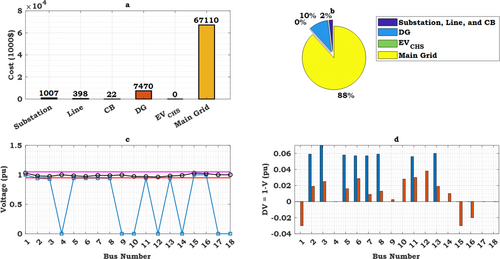
In the first scenario, it is assumed that all EVs are charged exclusively at residential locations, with no consideration given to the use of public charging stations. This scenario is designed to investigate the impact of home charging of EVs on the maximum network load and, consequently, the most unfavorable operational conditions for the distribution network. The results pertaining to the distribution network expansion in this scenario are presented in Table 5 and Figure 5. Table 5 illustrates the construction status of each piece of equipment at every level of network planning, along with the total installation cost for each piece of equipment. Figure 5 provides a visual representation of the network status after the expansion.
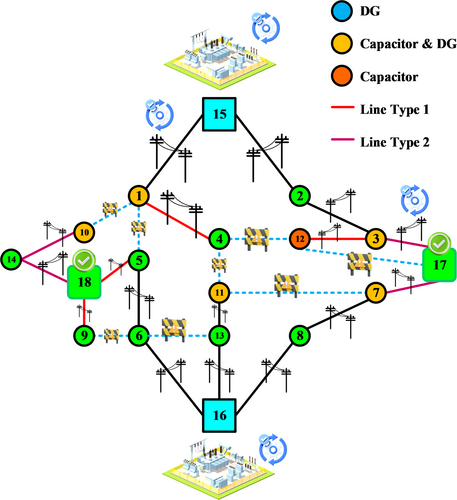
In this scenario, the increased load due to home charging of EVs has led to an overall increase in demand for both traditional load and EV load across all buses. This increased load necessitates investment in distribution network expansion. The primary planning costs in this scenario have included the expenses of constructing substations, installing DG units, and purchasing electricity from the upstream grid at various planning stages.
Figure 6 illustrates the share of each equipment type in the overall DNEP costs in the form of a pie chart. According to this chart, 88% of the costs are associated with energy supply from the upstream grid. In contrast, only 10% of the costs are allocated to electricity supply from DG units. Additionally, approximately 1% of the costs are related to the construction of substations, and 2% are related to other sectors. Table 3 shows the progression of substation construction across different planning stages to optimize energy exchange with the upstream grid.
| DGs | EV storage | ||
|---|---|---|---|
| Type | Type 1 | Vehicle type | Two types: Tesla and Nissan |
| Charging station type | Two types: Fast and normal | ||
| Investment cost | 2.2 M$ | Investment cost of charging station | 500$ |
| Capacity | 3000 kVA | Vehicle capacity | 25 and 50 kWh |
| Capacity of charging station | 10 and 50 kW | ||
| Power factor | 0.95 | Energy level coefficient | 0.5 |
| Proposed locations | Node 1, 3, 7, 8, 9, 10, 11, and 12 | Proposed locations | Node 3, 8, 9, 10, and 11 |
| Allowed influence level | 35% | Allowed influence level |
Stage 1: 2% Stage 2: 11% Stage 3: 30% |
| Number of vehicles charged in the charging station |
Stage 1: 201 Stage 2: 1688 Stage 3: 5521 |
||
The results indicate that in this scenario, energy supply from the upstream grid plays the main role in load fulfillment. This could be due to the high installation costs of DG units compared to purchasing electricity from the upstream grid. With a reduction in the initial installation costs of DG units, the possibility of wider integration of these resources into the network will arise. To more accurately evaluate the impact of increased load on network performance, bus voltage profiles are presented in Figure 6c,d. The bus voltage profiles range from 0.95 to 1.05 per unit (p.u.). Furthermore, Figure 6d shows that the voltage deviation from the reference value of 1 p.u. has been significantly reduced.
- Bus Voltage Profiles: The results show that the bus voltage profiles range from 0.95 to 1.05 per unit (p.u.). This range indicates relative voltage stability in the network. However, in some buses, the voltage drop is close to the permissible limit of 0.95 p.u., which may indicate network sensitivity to load increases.
- Energy Supply from the Upstream Grid: In this scenario, 88% of the costs are related to energy supply from the upstream grid. This indicates that the distribution network is highly dependent on the upstream grid, and any disruption in the upstream grid can lead to a decrease in the reliability of the distribution network.
- DG Unit Installation Costs: Only 10% of the costs are allocated to electricity supply from DG units. This indicates that the use of DG units is limited in this scenario. DG units can act as backup sources in emergency situations and help increase network reliability.
- Need for Network Reinforcement: The load increase due to EV home charging necessitates investment in distribution network expansion. This indicates that the current distribution network may not be able to withstand the load increase and needs reinforcement.
- ○
Wider use of DG units as backup sources
- ○
Investment in reinforcing the distribution network to withstand load increases.
- ○
Smart load management to reduce peak load
- ○
Use of energy storage systems to supply energy in emergency situations
4.2.2 Case 2
In Case 2, the DNEP has been strategically designed to integrate EV charging stations. This integration has resulted in significant changes in the problem's results, as shown in Table 6 and Figure 7. In this scenario, the research on EVs has focused solely on specific locations within the network, namely the locations where charging stations are installed. The results indicate that in Case 2, the overall expansion costs have decreased by approximately 2% compared to Case 1. This reduction highlights the economic benefit of the proposed simultaneous planning approach. Furthermore, in this scenario, the results related to the construction and expansion of network equipment at different planning stages vary compared to Case 1. Generally, the number of substations constructed using this approach is lower than in Case 1. Additionally, several transmission lines have been reinforced or constructed, and the installed line capacity in Case 2 is lower than that in Case 1. Varying outcomes have been achieved regarding the status of DG units and capacitor banks. In this case, only three DG units have been installed, whereas in Case 1, about five DG units were constructed.
| MOSEK Parameter | Default Value | Suggested Value | Description |
|---|---|---|---|
| MSK_IPAR_MIO_MAX_NUM_BRANCH | 100,000 | 200,000 | Maximum number of branched nodes |
| MSK_DPAR_MIO_TOL_ABS_GAP | 1.00E-06 | 1.00E-08 | Absolute tolerance for optimality gap |
| MSK_DPAR_MIO_TOL_REL_GAP | 1.00E-04 | 1.00E-06 | Relative tolerance for optimality gap |
| MSK_IPAR_MIO_CUTS | MSK_MIO_CUTS_AUTO | MSK_MIO_CUTS_AGGRESSIVE | Control of cut generation |
| MSK_IPAR_MIO_HEURISTICS | MSK_ON | MSK_ON | Control of heuristic usage |
| Vmin | 0.95 pu | Vmax | 1.05 pu |
| S_Max | 1000 KVA | ||
| Equipment | Stage 1 | Stage 2 | Stage 3 | Cost (1000$) | |
|---|---|---|---|---|---|
| Substations | 15 and 16 | 18 | 17 | 1007 | |
| Lines | Type 1 | 1–4 |
5–18 9–18 |
3–12 | 398 |
| Type 2 | — |
3–17 10–14 14–18 1–15 |
3–17 7–17 |
||
| Capacitor banks | Buses 1, 3, 7, and 11 | Bus 10 | Bus 12 | 22 | |
| DGs | Buses 1 and 7 | Bus 3 | Buses 10 and 11 | 7470 | |
| Charging stations | Not expanded | Not expanded | Not expanded | 0 | |
| Energy supply cost | 67,110 | ||||
| Equipment | Stage 1 | Stage 2 | Stage 3 | Cost (1000$) | |
|---|---|---|---|---|---|
| Substations | 15 and 16 | — | 17 | 385 | |
| Lines | Type 1 |
3–12 4–12 |
1–10 6–9 |
4–11 10–14 |
355 |
| Type 2 | — |
1–15 13–16 |
3–17 7–17 |
||
| Capacitor banks | Buses 1, 2, 6, 7, and 11 | Bus 10 | — | 24 | |
| DGs | Buses 3 and 7 | Bus 10 | — | 5760 | |
| Charging stations | 3 | 8 | 10 and 11 | 2880 | |
| Energy supply cost | 59,326 | ||||
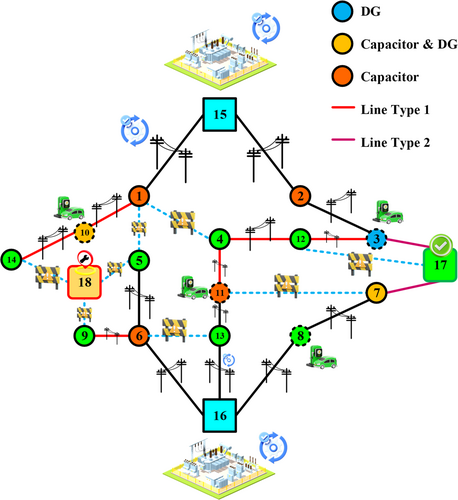
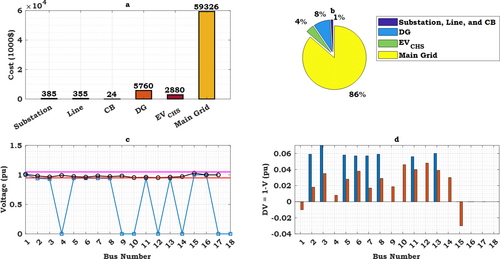
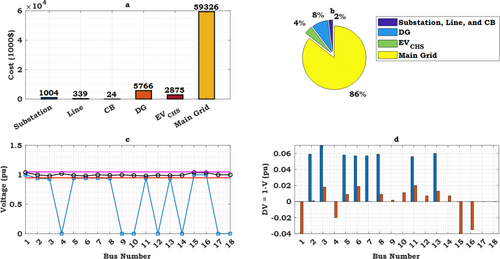
In Case 2, the allocation of network expansion costs differs from Scenario 1, as depicted in the pie chart of Figure 8b. Observations indicate a reduction in the proportion of electricity supplied by the national grid, decreasing from 88% in Scenario 1 to 86% in Scenario 2. This signifies a decreased reliance on electricity supply from the national grid. Conversely, the share of power supply from DG units has decreased from 10% in Scenario 1 to 8% in Case 2, while the share of EV charging stations has increased from zero to 4%. The primary cause of these variations is the concentrated load distribution in specific network buses, necessitating network expansion in these locations. Upon examining Table 4, it is evident that network expansion has primarily focused on buses associated with EV charging stations, namely buses 3, 8, 10, and 11. Capacitor banks have been installed at buses 10 and 11, and DG units at buses 3 and 10, as well as along lines 3–12, 1–10, 10–14, 4–11, and 3–17. These locations are in close proximity to EV charging stations. The network voltage profiles, presented in Figure 8c,d, demonstrate a significant improvement, reaching a suitable level. However, it is noteworthy that due to the omission of a substation (specifically at bus 18) in the network expansion plan, the voltage deviation, as shown in Figure 8d, is comparatively larger than that in Figure 6d. The results reveal that the integration of EV charging stations in Case 2 has led to a reduction in dependence on the national grid and an increased contribution from EV charging stations in load fulfillment. The focused network expansion on buses associated with EV charging stations highlights the direct impact of charging station locations on DNEP. The improved network voltage profiles indicate effective DNEP performance in maintaining voltage stability. However, the omission of the substation at bus 18 suggests potential limitations in the expansion plan. In Case 2, network reliability has improved due to the reduced dependence on the national grid and the increased contribution from EV charging stations. The focus on expanding network capacity at buses linked to EV charging stations indicates attention to critical network points during expansion planning. The enhanced network voltage profiles also reflect effective DNEP performance in maintaining voltage stability. However, the absence of the substation at bus 18 may reduce network reliability in that area.
| Equipment | Stage 1 | Stage 2 | Stage 3 | Cost (1000$) | |
|---|---|---|---|---|---|
| Substations | 15 and 16 | 17 | 18 | 1004 | |
| Lines | Type 1 | 4–11 |
1–10 6–9 |
3–12 5–18 14–18 |
339 |
| Type 2 | — |
3–17 7–17 6–13 |
9–18 | ||
| Capacitor banks | 1, 3, 6, 7, 11, and 13 | — | — | 24 | |
| DGs | 1 and 7 | 10 | — | 5766 | |
| Charging stations | 8 | 3 and 10 | 9 | 2875 | |
| Energy supply cost | 59,320 | ||||
- ○
A thorough review of the need for a substation at bus 18 and its potential inclusion in the network expansion plan.
- ○
Implementation of energy storage systems at EV charging stations for emergency power supply.
- ○
Implementation of smart load management to mitigate peak load and prevent voltage drops at critical buses.
- ○
Deployment of advanced monitoring and control systems to promptly detect and resolve network issues.
4.2.3 Case 3
The results of Scenario 3 are presented in Table 7 and Figure 9. This scenario employs a robust approach, which exhibits significant differences compared to the deterministic approach used in Scenario 2. These differences will be discussed in detail later in this section. In Scenario 3, the behavior of bus loads, due to the presence of stochastic EVs, is considered random. Specifically, it is assumed that the bus loads follow a normal distribution.
From a substation construction perspective, all substations have been constructed according to the robust model. However, in the deterministic model (model 2), the substation associated with node 18 has not been placed. The disparity arises due to the more stringent nature of the robust model compared to the deterministic model. The robust technique incurs a greater overall cost compared to the deterministic method, with a notable difference of 4%. This difference arises from the expenses associated with constructing substations to ensure that their capacity consistently remains below a specific threshold. In contrast to Case 2, we observe the installation of lines with a greater nominal capacity (referred to as type 2 lines) surrounding the constructed charging stations. The allocation of capacitor banks and DGs differs in Cases 2 and 3. The construction configuration of capacitor banks is analogous to Case 1; however, DG units are installed across several buses. Figure 8 displays the proportion of the building cost allocated to each installed equipment in this scenario. It is understood that the proportion of electricity purchased from the upstream network, DGs, and EV stations concerning the total cost remains unchanged compared to Case 2. Nonetheless, the proportion of substation cost has doubled in comparison to Case 2. This demonstrates that when the level of uncertainty in the problem escalates, it becomes imperative to construct additional substations within the network. This is necessary to effectively address fluctuations in network traffic and prevent the congestion of other substations in the network that are operating closer to their optimal capacity. Furthermore, in this particular scenario, it is evident from Figure 10c,d that the robust model exhibits a superior and more uniform voltage profile throughout the network. Additionally, Figure 10d demonstrates that the magnitude of voltage deviation is significantly lower compared to the prior two cases.
In Scenario 3, the robust approach is utilized for DNEP. This approach is specifically designed to manage uncertainties related to bus loads, which arise from the random presence of EVs. The assumption of a normal distribution for bus loads enables the use of statistical methods for analyzing and predicting load behavior.
The results indicate that despite the presence of uncertainties, the bus voltage profiles remain within an acceptable range (0.95 to 1.05 per unit). This demonstrates the effective performance of the robust approach in maintaining network voltage stability. Additionally, a review of Table 7 reveals that the capacities of transmission lines and DG units have been selected in a manner that allows the network to withstand load variations. Specifically, the capacities of transmission lines and DGs have been determined to ensure that the network can supply the load even under the worst-case load conditions. This reflects the attention to network reliability in the robust approach.
Table 8 presents a comparison between the results of the proposed method and the other two methods.
| Case 1 | Case 2 | Case 3 | |||||||
|---|---|---|---|---|---|---|---|---|---|
| Cost (1000 $) | Cost (1000 $) | Cost (1000 $) | |||||||
| Equipment | MOSEK | H-PSO- SCAC [31] | IGWO [33] | MOSEK | H-PSO- SCAC [31] | IGWO [33] | MOSEK | H-PSO- SCAC [31] | IGWO [33] |
| Substations | 1007 | 1155 | 1180 | 385 | 432 | 421 | 1004 | 1154 | 1123 |
| Lines | 398 | 405 | 408 | 355 | 369 | 359 | 339 | 402 | 408 |
| Capacitor banks | 24 | 24 | 26 | 24 | 24 | 26 | 24 | 24 | 26 |
| DGs | 22 | 25 | 27 | 5760 | 6202 | 6103 | 5766 | 5877 | 6018 |
| Charging stations | 7470 | 8561 | 8432 | 2880 | 3026 | 3000 | 2875 | 3020 | 2987 |
| Energy supply cost | 0 | 0 | 0 | 59,326 | 62,147 | 61,125 | 59,320 | 60,020 | 59,825 |
Based on Table 8, the integrated analysis and summary comparison of the numbers are as follows: The comparison is solely based on the performance of the methods in the studied network, as the network under study differs from those examined in references H-PSO-SCAC [31] and IGWO [33]. In the field of substations, the MOSEK method has the lowest cost compared to the H-PSO-SCAC and IGWO methods in all three cases (Case 1, Case 2, Case 3). For example, in Case 1, the cost of substations in the MOSEK method is 1007 units, while in the H-PSO-SCAC and IGWO methods it is 1155 and 1180 units, respectively. On average, the cost of substations in the MOSEK method is about 10 to 15% lower than the references. In the lines section, in Cases 1 and 2, the MOSEK method has lower costs than the H-PSO-SCAC and IGWO methods. For example, in Case 2, the cost of lines in the MOSEK method is 355 units, while in the H-PSO-SCAC and IGWO methods it is 369 and 359 units, respectively. In Case 3, the costs are almost similar, but MOSEK is still slightly better than the H-PSO-SCAC and IGWO methods, and the difference in numbers in this section is very small. The costs in capacitor banks are almost the same in all three methods and in all three cases, indicating similar performance. In the DGs section, in Case 1, the MOSEK method has a lower cost than the H-PSO-SCAC and IGWO methods, but in Cases 2 and 3, the H-PSO-SCAC and IGWO methods have lower costs than the MOSEK method, and the difference in numbers in this section is very large in the second and third cases. For example, in Case 2, the cost of DGs in the MOSEK method is 5760 units, while in the H-PSO-SCAC and IGWO methods it is 6202 and 6103 units, respectively. In charging stations, the MOSEK method has significantly lower costs than the H-PSO-SCAC and IGWO methods in all three cases, and the difference in costs in this section is very significant, indicating the remarkable superiority of MOSEK. For example, in Case 1, the cost of charging stations in the MOSEK method is 7470 units, while in the H-PSO-SCAC and IGWO methods it is 8561 and 8432 units, respectively. In energy supply cost, in Case 1, all methods have zero cost, but in Cases 2 and 3, the MOSEK method has significantly lower costs than the H-PSO-SCAC and IGWO methods, and the difference in numbers in this section is very significant. For example, in Case 2, the energy supply cost in the MOSEK method is 59,326 units, while in the H-PSO-SCAC and IGWO methods it is 62,147 and 61,125 units, respectively. The overall conclusion is that the MOSEK method performs better than the H-PSO-SCAC and IGWO methods in most areas, especially in substations, charging stations, and energy supply cost, but in the field of DGs, the performance of MOSEK is weaker in some cases. In general, the results indicate the superiority of the MOSEK method in optimizing the studied network.
5 Conclusion
- Reduced energy supply costs from the upstream network.
- Enhanced network reliability under critical conditions and improved robustness against sudden changes.
- Increased integration of EV charging stations within the distribution network.
- A two-step solution methodology for coordinated DNEP.
5.1 Future Recommendations
- Considering the presence and uncertainty of other distributed renewable generation sources, including wind and solar sources,
- Considering the failure rate and the uncertainty of the failure rate of lines and equipment, and
- Problem-solving to increase the robustness of the DNEP
Nomenclature
-
-
- The cost of the type of conductor replaced
-
-
- The cost of the type of substation replaced
-
-
- The total cost of capacitor placement
-
-
- The cost of installing each module of capacitors
-
-
- The investment cost of each distributed generation
-
-
- The cost of investing in a charging station
-
-
- The cost of investing in chargers
-
-
- Cost of energy transmitted by substation
-
-
- The cost of operating the substation
-
-
- Maximum number of chargers to install
-
-
- Production energy cost of distributed generation g
-
-
- The required energy of v-type vehicle
-
-
- The linear approximation of the squared value of a variable called ρ written relative to its maximum value if the number of intervals is Γ.
-
-
- The number of u-type capacitors installed in bus i
-
-
- The number of standard operating capacitor units in bus i at time u
-
-
- The number of charging stations type e of the vehicle in bus p and time e
-
-
- The number of chargers of a charging station under operation
-
-
- Number of vehicles of type v connected to charger e at time u
-
-
- The number of electric vehicles of type v at time u
-
- IC
-
- Investment cost of branches
-
- ICB
-
- Investment cost of capacitor banks
-
- IDG
-
- The cost of investing in distributed generation
-
- IS
-
- Substation investment cost
-
-
- The square of the current flowing through line ij of type a at time u
-
-
- The range of current flowing through the type a line
-
-
- Power flowing through the substation
-
-
- Power produced by distributed generation
-
-
- Approximation of the squared active power of the substation
-
-
- Active power flowing through line ij of type a at time u
-
-
- Rated active power of type e charger
-
-
- Active power of the load placed in bus i at time u
-
-
- Approximation of active power of the load placed in bus i at time u
-
-
- Approximation of the squared reactive power of the substation
-
-
- Reactive power flowing through line ij of type a at time u
-
-
- The reactive power of the load placed in bus i at time u
-
-
- Reactive power of each capacitor bank
-
-
- Reactive power of each distributed generation at node i and time u
-
-
- Resistance of type a line relative to the length of that line
-
-
- Substation capacity
-
-
- Apparent random power of the substation at time u
-
-
- Upper limit of voltage
-
-
- Lower limit of voltage
-
-
- Estimated voltage at node i
-
-
- The reactance of type a line relative to the length of that line
-
-
- A binary variable representing the state of investment on the line ij, which was previously in state a and was replaced by type b conductor at time u
-
-
- Binary variable of investment on node s substation which was previously in state h and was replaced by type t at time u
-
-
- Binary variable of installation of u-type capacitor bank in bus i
-
-
- Binary variable of installation of type g distributed generation unit in bus m at time u
-
-
- Binary variable of installation of a charging station at time u in bus p
-
-
- The connection status of the branch type a connecting two buses ij at time u
-
-
- Impedance of type a line relative to the length of that line
-
-
- The length of the line connecting two nodes ij
-
-
- Number of hours in a year
-
-
- load factor
-
-
- Electric vehicle charging level when arriving at the parking lot
-
-
- Maximum charge level of electric vehicle
-
-
- Vehicle charging time
-
-
- Substation loss coefficient
-
-
- Substation power factor
-
-
- Uncertainty reinforcement factor
-
-
- Standard deviation of the number of electric vehicles
-
-
- Apparent power variance
-
-
- Load variance
-
-
- Confidence factor
-
-
- The length of the planning period in terms of years
-
-
- Interest rate
-
-
- The parameter indicating the initial state of the substation at the beginning of the planning horizon
-
- H-PSO-SCAC
-
- Hybrid Particle Swarm Optimizer with Sine Cosine Acceleration Coefficients
-
- IGWO
-
- Improved Gray Wolf Optimization
Author Contributions
Mahyar Abasi: conceptualization, investigation, writing – original draft, visualization, methodology, supervision, validation, formal analysis. Javad Ebrahimi: conceptualization, investigation, validation, methodology, software, formal analysis, writing – original draft. Shirin Besati: conceptualization, investigation, methodology, validation, formal analysis, project administration.
Conflicts of Interest
The authors declare no conflicts of interest.
Open Research
Data Availability Statement
Data sharing is not applicable to this article as no new data were created or analyzed in this study.


