Optimization of Tensile Strength Behavior in 3D-Printed PLA With 10% Terminalia chebula Nanocomposites: Influence of Strain Rate, Orientation, and Infill Percentage
ABSTRACT
This study aims to investigate and maximize the tensile strength behavior of polylactic acid (PLA) 90% and Terminalia chebula nanoparticle (TCNP) 10% composites fabricated using fused deposition modeling (FDM) under varying strain rates (3, 6, 9 mm/min), orientations (0°, 45°, 90°), and infill percentages (30%, 60%, 90%). The tensile strength was analyzed to assess the combined influence of these parameters on the mechanical performance of the composites. At a low strain rate of 3 mm/min, the composites exhibited the highest tensile strength due to enhanced molecular alignment and stress redistribution, achieving maximum values in the 0° orientation across all infill percentages. Increasing the strain rate reduced tensile strength, with the material transitioning from ductile to brittle failure, especially at 9 mm/min, where rapid deformation hindered molecular realignment. The 0° orientation consistently demonstrated superior tensile strength due to efficient load transfer along printed layers, while the 90° orientation exhibited the weakest performance, attributed to stress concentrations at interlayer bonds. Higher infill percentages, 60% and 90%, improved material density, enhancing tensile strength but diminishing under higher strain rates. The study highlights the optimal mechanical performance of a maximum tensile strength of 45.67 ± 2.28 MPa, which was achieved at 90% infill, 3 mm/min strain rate, with 0° orientation, making it suitable for load-bearing applications. The findings provide insights into the tailoring of 3D-printed PLA-TCNP composites for specific applications, balancing strength, ductility, and controlled failure mechanisms.
1 Introduction
Polymer-based additive manufacturing (AM), especially fused deposition modeling (FDM), has brought a drastic change in manufacturing components with complex shapes and desired mechanical characteristics [1]. Among all the materials used in 3D printing, PLA has been singled out because of its biodegradable nature, environmentally friendly and works easily with. However, the mechanical properties of PLA are somewhat low; the tensile strength is around 50–60 MPa, and the flexural strength is 80–90 MPa; this restricts the application of PLA in high-requirement fields [2]. The use of reinforcements like natural fiber and nanoparticles is in the initiation process [3, 4]. Particularly, natural nanoparticles are named to have a bio-sourced origin and are effective in increasing tensile strength, stiffness, and overall mechanical characteristics [5, 6]. Research shows that PLA composites with natural reinforcements not only exhibit enhanced mechanical properties but also environmentally friendly production [7, 8].
To address these issues, previous studies have suggested some approaches to enhance the PLA properties, which include the use of natural nanoparticles like Terminalia chebula (TC) [9, 10]. In bio-based fillers obtained from plant sources, TC nanoparticles (TCNPs) have a particular interest as an environmental and reinforcing material. These nanoparticles have been successfully incorporated into the PLA matrix to improve the mechanical characteristics of composites for use in biomedical devices, automotive parts, and packaging materials [11, 12]. It has also been established in the recent past that the use of TCNP in the synthesis of PLA enhances the tensile and thermal characteristics of the final composites [13].
TC has been identified as a suitable reinforcement for PLA because of its renewable source and superior mechanical performance. It is well shown that the incorporation of TCNPs improves the tensile strength of PLA composites from around 55 to over 70 MPa depending on the concentration of the nanoparticle and process parameters [14, 15]. Moreover, Singh et al. [15] also pointed out that the addition of TCNPs enhances the elongation at break and thermal stability of the composites for a wide range of applications such as medical instruments and automobile parts. Jagadeesh et al. [16] stated that TC-based nanofillers result in enhanced mechanical properties with tensile strength of more than 70 MPa at the right concentrations. These results support the feasibility of using natural nanoparticles as reinforcement in PLA, further broadening their uses in different sectors.
Other research has also examined the interactions of other natural fillers and nanoparticles, including cellulose and graphene on PLA-based composites [17]. These studies show that the addition of such nanofillers can impart tensile strength as high as 75 MPa and flexural strength more than 110 MPa [18]. Further, control of 3DP parameters including infill density, orientation of the print, and layer thickness has a significant role in improving the mechanical characteristics of PLA composite. For instance, increased infill densities up to 90% enhance tensile strength to up to 80 MPa depending on the optimized conditions as postulated by Chacón et al. [19, 20] and Chen et al. [21]. Besides the nanoparticle reinforcement, the mechanical properties of the PLA composites highly depend on the 3D printing process. It was observed that tensile strength and the other mechanical properties of the material are highly dependent on the layer thickness, print orientation, and infill density. Infill density ranging from 30% to 100% and print orientation were identified by Abdullah and Othman [22] and Chacón et al. [19, 20] as especially important for improving tensile strength up to 80 MPa when the optimal conditions are achieved. Print orientation is central to inter-layer adhesion, with horizontal 0° orientation tending to display higher tensile strength than a vertical 90° orientation.
A key aspect that determines the mechanical behavior of the 3D-printed composites is the control of the processing conditions, including layer deposition angle, density of the printed layers, and the rate of printing. These parameters define the meso-structure and bonding between layers; they influence the tensile properties of the printed parts [23, 24]. Several experimental reports have shown that changing these parameters can enhance the mechanical properties of PLA-based composites by several folds [25, 26]. Moreover, more recent developments in the area allow for using machine learning methods to predict mechanical properties in 3D printed materials, providing a more effective approach to improving PLA composites. For instance, [27] utilized supervised learning for modeling dimensional deviation in FDM printed parts and [28] for tensile and flexural properties of 3D-printed concrete. These studies demonstrate the increasing possibility of using data analysis techniques in the optimization of materials (Table 1).
| Reference | Material | Parameters studied | Findings | Research gap |
|---|---|---|---|---|
| Zhu et al. [2] | PLA with Pueraria lobata root microcrystalline cellulose | Mechanical properties of PLA composites | Enhanced mechanical properties with natural fillers | Did not explore strain rate, orientation, or infill percentage effects |
| Siddiqui et al. [5] | PLA with wood fiber | Mechanical properties, flammability analysis | Improved mechanical properties but affected by flammability | Lack of focus on strain rate and infill parameters |
| Finnerty et al. [6] | PLA with natural fibers | Effect of mechanical recycling on properties | Recycling degrades mechanical performance | No study on strain rate or infill percentage |
| Balasubramanian et al. [17] | PLA | Influence of FDM parameters and strain rate on tensile strength | Strain rate significantly affects tensile behavior | Lacked study of composite materials with bio-fillers |
| Chacón et al. [19, 20] | PLA | Process parameters and mechanical properties | Optimized printing conditions for strength | Did not consider composite materials or strain rate variations |
| Chen et al. [21] | PLA with carbon/glass fibers | Mechanical properties and failure mechanisms | Hybrid fibers improved strength | No study on bio-filler composites like TCNP |
| Abdullah and Othman [22] | PLA | Layer thickness and printing orientation | Orientation impacts tensile strength | Lack of composite material study |
| Harpool et al. [23] | PLA | Infill design and tensile response | Infill percentage influences strength | No composite material investigation |
| John et al. [24] | PLA | Infill patterns optimization | Taguchi analysis used for optimization | No strain rate influence considered |
| Tura and Mamo [25] | PLA | Process optimization for mechanical properties | Improved mechanical strength | No composite material or bio-filler study |
| Valerga et al. [26] | PLA | Filament conditions and part characteristics | Material properties affected by filament conditions | No composite material study |
| Sharma et al. [27] | PLA | Machine learning for dimensional accuracy | ML predicted print variations accurately | No study on mechanical performance |
| Ali et al. [28] | 3D-printed concrete | ML-based predictive models for strength | Accurate predictions for concrete structures | No application for polymer composites |
| Ghorbel et al. [29] | Pure PLA | FFF printing, sweat absorption | Mechanical and failure behavior | Strength degradation due to moisture absorption |
| Souissi et al. [30] | Pure PLA | UV aging, water absorption | Mechanical properties | Strength reduction due to environmental exposure |
| Elloumi et al. [31] | PLA + copper filler | Optimization of mechanical properties | Tensile strength enhancement | Improved mechanical properties with copper filler |
| Current study | PLA + 10% TCNP | FDM (strain rate, orientation, infill) | Tensile strength, failure mechanism | Optimal parameters: 3 mm/min, 90% infill, 0° orientation achieves 45.67 MPa |
The synergistic effect of natural nanoparticle reinforcement and optimization of 3D printing parameters presents a viable route map for creating high-strength sustainable PLA composites. Although there is progress in synthesizing PLA-based composites reinforced with natural nanoparticles, much of the work remains to be done in understanding and improving their mechanical properties and process parameters. The relationship between tensile strength and elongation at break of TCNP concentrations that are different or the impact of 3D printing parameters, including print orientation, infill density, and layer thickness on TCNP-PLA composites, is not observed systematically. Further, the combined effect of TCNP reinforcement and best printing conditions has not been explored in detail, and therefore, there is a scope to enhance these composites for better performance applications. Moreover, specific mechanical performance data for applications, especially in biomedical devices and automotive parts, are also scarce along with limited assessment of their sustainability and life cycle.
This study systematically investigates the effects of TCNPs and key 3D printing parameters, such as print orientation and infill density, on the tensile strength and overall mechanical performance of PLA composites, with a specific focus on 90% PLA: 10% TCNP formulations. The findings will be useful for further improvement of material composition and processing conditions to support the increased application of PLA-based composites in diverse engineering applications that demand improved mechanical properties, high strength-to-weight ratios, and enhanced durability together with sustainability.
2 Materials and Methods
2.1 Materials
The PLA (polylactic acid) pellets used in this investigation were purchased from Natur Tec India Private Limited at Chennai, Tamil Nadu. PLA is a thermoplastic derived from renewable biomass sources such as cornstarch in its purest form. It has a density of 1.24 g/cm3 and is available in white transparent pellets. Its glass transition temperature is 55°C–60°C, melting temperature 170°C–180°C, and degradation temperature of 190°C–210°C. Mechanical properties of PLA comprise tensile strength of 50–70 Mpa, elongation at break of 5%–10%, and flexural modulus of 3.5–4 GPa. The TC seeds used in this study were collected from thandikudi village in the kodaikanal highlands. The raw powder shows a degradation temperature ranging from 200°C to 300°C when combined.
2.2 Collection and Preparation of Raw Material
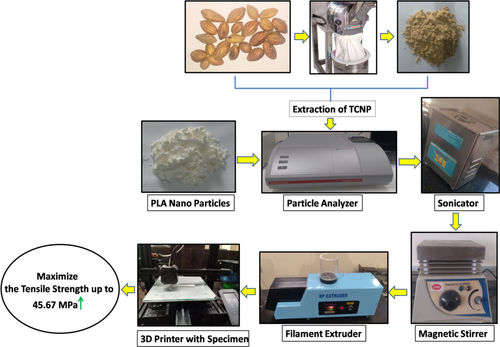
TC seeds were properly washed with distilled water. After that, spread the seeds thinly on a flat, clean, dry, and preferably sunny surface to facilitate aeration and prevent mold formation for 5–10 days. Bury the seeds in the soil and turn them over each day to ensure that they dry evenly, preferably in warm dry weather at temperatures of between 30°C and 40°C. Once dry, take a pulverizer and grind the seeds to a fine powder. For homogeneity, the TCNP powder is treated by over-drying at 55°C for 2–3 h and sieving through 120 μm mesh size. The manufacturing procedure of the PLA-TCNP composite is demonstrated in Figure 1.
2.3 Melt Mixing Parameters for PLA-TCNP Composite Fabrication
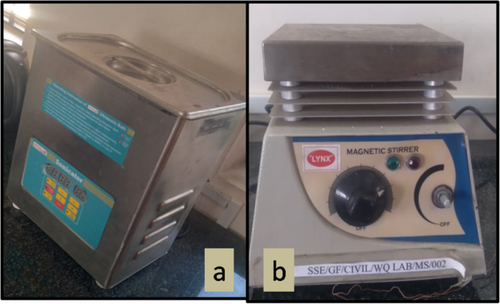
To prepare PLA-TCNP composite filaments, the required materials were accurately weighed using a precision balance according to the desired weight ratio of PLA to TCNP (90PLA:10TCNP). To obtain a homogeneous dispersion of TCNP in the PLA powder, the TCNP was first sonicated (Model REML, 5MLH) for 5 min. This was succeeded by mixing with a magnetic stirrer in order to improve homogeneity.
The prepared blend was further melt-compounded using a twin-screw extruder. The melt temperature was set to the extruder at 200°C, and the mixture of PLA-TCNP was fed into the hopper. A moderate screw speed was used to achieve shear mixing so that the TCNP was well distributed in the molten polymer phase. The melt compounding process was performed for 10 min, and afterwards, the composite was extruded into strands. These strands were then cooled and solidified to make them ideal as feedstock to be used in 3D printing techniques. Figure 2 illustrates the equipment used in the process.
2.4 Twin-Screw Extruder Setup for Filament Production
To make a PLA-TCNP composite filament, feed the blend onto a corotating twin-screw extruder using a 40:1 L/D ratio to promote composite mixing and homogenization. The extrusion process is carried out at temperatures ranging from 190°C to 220°C, with a screw speed of 100–150 RPM and a screw diameter of 50–70 mm. The extruding die is designed to generate a 1.75 mm filament that is coiled at a pace of 1.5 m per minute.
2.5 AM Printer
The RS 3D Company supplied the 3D printer utilized in this investigation (model: Ender 3 S1, 3D LD-002H platform), with a printing capability of 220 × 220 × 270 mm. The dual-gear direct extruder has a bed temperature capability of up to 100°C and a nozzle temperature of up to 260°C. Print settings including raster angle, head speed, as well as temperature were set with the Ultimaker Cura software.
The specifications for the PLA–TCNP composite filaments used in 3D printing are as follows: The extrusion temperature has been stabilized at 210°C, while the bed temperature is at 50°C. The rate at which the print is done is 50 mm/s, and the pattern selected is a grid. The infill percentages are different and include 30%, 60%, and 90%, depending on the needs of the construction. Deposition orientation is at 0°, 45°, and 90°, allowing for variation in the print direction. To achieve the required print quality and resolution, the layer thickness is kept constant at 0.16 mm.
3 Experimental Setup
The testing of 3D-printed PLA with 10% TCNP composites under different process parameters utilized a calculated experimental plan to examine tensile strength characteristics. Three critical factors composed the full factorial experimental design: the strain rate at 3, 6, and 9 mm/min, along with orientation at 0°, 45°, 90°, as well as infill percentages at 30%, 60%, and 90%. Two conditions were controlled during printing with FDM: nozzle temperature at 210°C and specimens built with 1.2 mm shell thickness and three top and bottom layers, as well as a nozzle diameter of 0.4 mm. The HENS GRAND universal testing machine (model 500 WDW) operated according to the ASTM D638-14 standard to evaluate samples of specific dimensions (115 × 19 × 3 mm) using Type IV configurations. The Taguchi method applied process parameter optimization through minimizing variability while maximizing tensile strength. An L9 orthogonal array guided investigators through the analysis of three vital factors, including strain rate and orientation, and infill percentage, that affect the tensile properties of the composite material. An analysis of variance (ANOVA) together with the signal-to-noise (S/N) ratio, led to identifying the most crucial factors that influenced the tensile performance. Tensile strength received maximum optimization from process parameters while variability received minimal optimization through the Taguchi method application. The L9 orthogonal array acted to determine the specific impact of strain rate, along with orientation and infill percentage, on the tensile characteristics of the composite material. ANOVA together with the S/N ratio, helped identify the leading variables shaping tensile strength properties. These results showcase the composite potential combined with PLA property assessment under the best conditions.
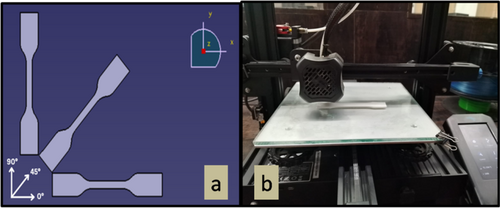
Figure 3 shows tensile test specimens of PLA-TCNP composites with varied specimens orientations.
4 Results and Discussion
The tensile strength results of 90%PLA:10% TCNP composites under varying cross-head speeds (3, 6, 9 mm/min), orientations (0°, 45°, 90°), and a fixed infill percentage (30%) highlight the interplay between strain rate and mechanical behavior. Table 2 shows the tensile strength of PLA-TCNP composites with varying orientations and strain rates at 30% infill.
| Run | Strain rate (mm/min) | Orientation (°) | Infilling (%) | 90PLA:10TCNP tensile strength (MPa) | Elongation (%) |
|---|---|---|---|---|---|
| 1 | 3 | 0 | 30 | 32.81 ± 1.6405 | 5.5 |
| 2 | 3 | 45 | 30 | 31.33 ± 1.5665 | 5 |
| 3 | 3 | 90 | 30 | 26.38 ± 1.319 | 4.6 |
| 4 | 6 | 0 | 30 | 28.3 ± 1.415 | 4.5 |
| 5 | 6 | 45 | 30 | 27.59 ± 1.3795 | 4 |
| 6 | 6 | 90 | 30 | 25.16 ± 1.258 | 3.5 |
| 7 | 9 | 0 | 30 | 27.18 ± 1.4655 | 4 |
| 8 | 9 | 45 | 30 | 24.25 ± 1.49 | 3.3 |
| 9 | 9 | 90 | 30 | 20.27 ± 1.162 | 3 |
4.1 Influence of Cross-Head Speed on Tensile Strength of PLA-TCNP Composite Specimens at 30% Infill
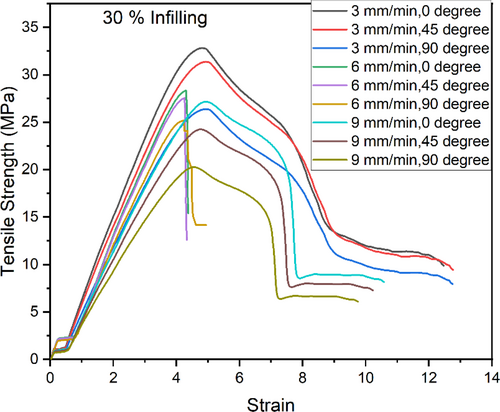
The highest tensile strength occurred at a low cross-head speed of 3 mm/min, and the 0°, 45°, and 90° samples showed tensile strength of 32.81, 31.33, and 26.38 MPa, respectively. This is due to the slow loading rate that enables molecular reorientation and stress relaxation to occur, leading to ductile behavior and increased energy dissipation to failure. At a medium crosshead speed of 6 mm/min, the tensile strength was found to be 28.3, 27.59, and 25.16 MPa for 0°, 45°, and 90° directions, respectively, due to the reduction in efficiency, stress accommodation, and the limitation of molecular mobility. At the highest speed of 9 mm/min, the tensile strengths reduced to 27.18, 24.25, and 20.27 MPa for the same orientation, due to rapid deformation that did not allow molecular orientation, and the material failed in a brittle manner due to early cracking and propagation of cracks. Based on these results, it is concluded that low cross-head speeds are suitable for processes that need high ductility and strength of the material for use in load-bearing parts such as automobiles or aircraft. Medium speeds may be useful for products with moderate strength and production requirements such as consumer goods, while high speeds could be used in controlled fracture situations such as biodegradable packaging material or biomedical scaffolds.
Standard deviation in tensile strength measurements is used to show that the uniformity and dependability of the material are uniform across different strain rates and directions. At the low strain rate of 3 mm/min, the standard deviations across orientations (0°: ± 1.6405, 45°: ± 1.5665, 90°: ± 1.319) are less variable, which explains why the material behavior is more uniform in the present case. Nonetheless, the higher standard deviation at 0° indicates small deviations most likely attributed to irregularities in layer adhesion at the microscopic level. Likewise, the other tensile strength standard deviation values are also characterized by a consistent trend at lower strain rates. At 6 mm/min, the standard deviations slightly decrease (0°: ± 1.415, 45°: ± 1.3795, 90°: ± 1.258), and it shows that as the strain rate increases then the material becomes slightly more consistent. At 9 mm/min, the standard deviations of both 45° (± 1.49) and 90° (± 1.162) orientations are higher than at 1 mm/min, indicating more variation in tensile strength because failure mechanisms are more random when the strain rate is high. In essence, lower strain rates produce higher tensile strength coefficients of variation than high strain rates, mainly in orientations with low interlayer bonding. These insights are important for applications where the material performance needs to be predicted, and lower standard deviations are desirable for structural integrity.
4.2 Orientation-Dependent Behavior of PLA-TCNP Composite Specimens at 30% Infill
The highest tensile strength of 32.81 MPa was obtained for specimens oriented at 0°, parallel to the tensile load with the maximum cross-head speeds of 3 mm/min. This superior performance is attributed to the matching of the load with the printed layers so that stress transfer along the molecular chain and interlayer bond is optimized to give maximum resistance to deformation. However, for 45° orientation, the tensile strength was moderate, for instance, 31.33 MPa at the rate of 3 mm/min because of both axial and shear stresses. Some of these stresses partially degrade the load distribution efficiency and thus are slightly lower than the 0° orientation. The lowest tensile strength was recorded for specimens with 90° orientation across the load direction, particularly, at high cross-head speed, with values of 20.27 MPa at 9 mm/min. This is because the applied load is concentrated at the interlayer interfaces where weak bonding cannot support and results in early failure. Due to its superior tensile strength at 0°, it is used in structural products such as load-bearing members and automotive parts where strength is fundamental. Due to the moderate strength at 45° orientation, it is possible to utilize it in applications that need multidirectional stress handling, for example, aerospace brackets. On the other hand, the dependable failure of 90° orientation under stress is useful in controlled-degradation applications, like biodegradable scaffolds or disposable packaging material.
4.3 Combined Influence of Cross-Head Speed and Orientation of PLA-TCNP Composite Specimens at 30% Infill
It is clearly demonstrated from the experiments that the cross-head speed and the orientation of load greatly affect the mechanical response of the material. At a cross-head speed of 3 mm/min, the material shows a ductile nature especially in 0° and 45° directions because the molecular chains and interlayer bonding gradually align and deform under stress. This enables stress redistribution and energy absorption, making it suitable for applications with high strength and ductility in load-bearing parts of automobiles and aircraft industries. At a cross-head speed of 6 mm/min the material shifts to semiductile to brittle mode with decreased tensile strength before failure, owing to restricted molecular mobility and capacity to bear stress. At a cross-head speed of 9 mm/min, failure is mainly brittle especially in the 90° orientation, where there is poor interlayer adhesion and where the layers are subjected to rapid loading; cracks initiate and propagate immediately.
Figure 4 presents the influence of cross-head speed on orientation-dependent tensile strength and strain of PLA-TCNP composite specimens at 30%. However, this material exhibits a relatively low toughness under high-strain rates, which is useful in applications where predictable failure is desired, such as medical implants with biodegradable structures or in impact-sensitive packaging materials where controlled failure is designed. The observed behavior suggests that to control the mechanical properties of a material to suit a certain application, the strain rate and the loading direction must be controlled. Table 3 depicts the tensile strength of PLA-TCNP composites with the degree of orientation and strain rate at 60% infilling.
| Run | Strain rate (mm/min) | Orientation (°) | Infilling (%) | 90PLA:10TCNP tensile strength (MPa) | Elongation (%) |
|---|---|---|---|---|---|
| 1 | 3 | 0 | 60 | 36.18 ± 1.809 | 6 |
| 2 | 3 | 45 | 60 | 36.89 ± 1.8445 | 5.2 |
| 3 | 3 | 90 | 60 | 23.18 ± 1.159 | 4 |
| 4 | 6 | 0 | 60 | 36.37 ± 1.8185 | 5 |
| 5 | 6 | 45 | 60 | 34.13 ± 1.7065 | 4.3 |
| 6 | 6 | 90 | 60 | 29.3 ± 1.465 | 4 |
| 7 | 9 | 0 | 60 | 29.31 ± 1.8795 | 4.5 |
| 8 | 9 | 45 | 60 | 29.8 ± 1.7565 | 4 |
| 9 | 9 | 90 | 60 | 23.24 ± 1.569 | 3.5 |
4.4 Effect of Cross-Head Speed on Tensile Strength of PLA-TCNP Composite Specimens at 60% Infill
At 3 mm/min, the highest tensile strengths were achieved in all orientations, 36.18 MPa (0°), 36.89 MPa (45°), and 23.18 MPa (90°). The low strain rate enabled the molecular reorientation and stress relaxation to occur; hence, the material underwent ductile deformation instead of failing prematurely. The rise of 60% infill provided better compactness of the material, thereby increasing load-carrying capacity. At 6 mm/min, tensile strength was slightly reduced to 36.37 MPa (0°), 34.13 MPa (45°), and 29.3 MPa (90°) due to the moderate strain rate that limited the material's capacity to deform plastically and decreased overall ductility. But, as expected, the higher infill still contributed substantial resistance to deformation. Subsequently, tensile strength reduced to 9 mm/min (29.31 MPa at 0°, 29.8 MPa at 45°, and 23.24 MPa at 90°) due to fast strain rates that hampered molecular orientation and provided material failure in a brittle mode, especially in the 90° orientation where inter-layer adhesion is least. However, the material could not afford to deform before fracture, even with a higher infill rate. These results show that low strain rates with high infill are beneficial for ductility and strength for structural parts, while higher strain rates are useful for applications that require controlled and predictable fracture, for example, in biodegradable packaging or impact-sensitive systems.
4.5 Orientation-Dependent Behavior of PLA-TCNP Composite Specimens at 60% Infill
The tensile strength of the 90PLA:10TCNP composites shows a direct relation of the direction of the printed layers with the tensile force applied. At 0° orientation, the printed layers are parallel to the load direction, and the material exhibits the highest tensile strength at all strain rates. At 3 mm/min, it attains the highest value of 32.81 MPa in the data set. The tensile strength is slightly lower at the strain rate of 6 and 9 mm/min at 28.3 and 27.18 MPa, respectively. This trend is because of the load-bearing capacity where the load is distributed efficiently along the molecular chains and layer interfaces so that the material can bear higher stress before it fails. On the other hand, the 45° orientation has a moderate reduction of tensile strength of 31.33 MPa at 3 mm/min, 27.59 MPa at 6 mm/min, and 24.25 MPa at 9 mm/min. These orientations include both axial and shear stress components, which makes stress distribution less efficient than in the 0° orientation. At high strain rates, the material is incapable of stress redistribution; hence, the reduction in strength, while at lower rates, the material performs well.
The 90° orientation of the printed layers with respect to the load yields the lowest tensile strength values at all the strain rates. At 3 mm/min, the tensile strength is 26.38 MPa, and at 6 mm/min it is 25.16 MPa, and at 9 mm/min it is 20.27 MPa. This reduction is because the load is applied perpendicular to the interlayer bonds, which are generally weaker than the molecular chains along the printing direction. The interlayer bonding becomes unable to bear the applied stress as the strain rate increases, and the material becomes more susceptible to brittle failure at higher strain rates. These are orientation-dependent behaviors that are useful for application considerations. The 0° orientation is more preferable for the application that demands high strength and low deformation, like load-bearing structural parts. The 45° orientation may be appropriate for applications where both strength and flexibility of the material are required, while the 90° orientation is more suitable for the applications where failure is to be controlled and predictable or where material is to be conserved.
4.6 Combined Influence of Cross-Head Speed and Orientation of PLA-TCNP Composite Specimens at 60% Infill
The combined influence of cross-head speed and orientation on the tensile strength of 90PLA:10TCNP composites with 60% infill shows clear trends in material behavior. At 3 mm/min, the tensile strength was highest in the 45° orientation (36.89 MPa), slightly outperforming the 0° orientation (36.18 MPa). Ductile deformation plays a major role in achieving finer stress distribution and molecular alignment by allowing a slower strain rate. At this speed, the material exhibits more energy absorption before failure. Conversely, the 90° orientation, where the load is applied perpendicular to the printed layers, showed the lowest tensile strength (23.18 MPa) due to weaker interlayer bonding.
Figure 5 presents the influence of cross-head speed on orientation-dependent tensile strength and strain of PLA-TCNP composite specimens at 60% The tensile strength of the material also reduces to 6 and 9 mm/min in all the orientations. At a strain rate of 6 mm/min, the material shows decreased ductility with tensile strengths of 36.37 MPa at 0°, 34.13 MPa at 45°, and 29.3 MPa at 90°. The moderate strain rate also reduces the extent to which the material can gradually deform before failure is triggered. At 9 mm/min, the tensile strength reduces to 29.31 MPa at 0°, 29.8 MPa at 45°, and 23.24 MPa at 90°. The higher strain rate does not allow sufficient stress redistribution, and the material fails in a brittle manner, particularly, in the 90° orientation where interlayer bonding is the poorest.
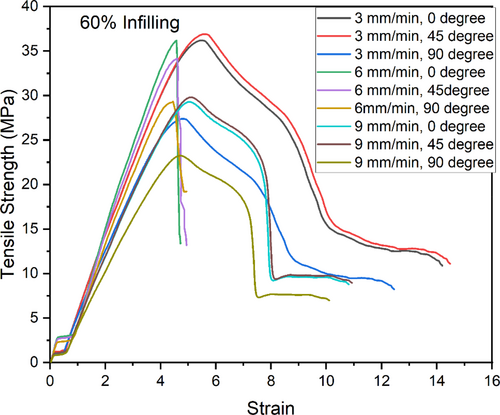
The outcomes reveal that lower cross-head speed (3 mm/min) favors ductile response, and the 45° orientation is slightly superior to 0° because of the less uneven stress. At higher strain rates, the material shifts to a more brittle failure mechanism, especially in the 90° fiber orientation. The 60% infill improves material density and increases tensile strength, but the effect is less under higher strain rates. For applications where high strength and ductility are desirable, lower cross-head speeds with either 0° or 45° angles of orientation are desirable, while higher cross-head speeds or 90° may be useful in applications where controlled brittle failure is desired. The tensile strength of PLA-TCNP composite specimens with different orientations and strain rates at 90% infill are presented in Table 4.
| Run | Strain rate (mm/min) | Orientation (°) | Infilling (%) | 90PLA:10TCNP tensile strength (MPa) | Elongation (%) |
|---|---|---|---|---|---|
| 1 | 3 | 0 | 90 | 45.67 ± 2.2835 | 6.5 |
| 2 | 3 | 45 | 90 | 44.46 ± 2.223 | 5.8 |
| 3 | 3 | 90 | 90 | 39.91 ± 1.9955 | 5 |
| 4 | 6 | 0 | 90 | 43.45 ± 2.1725 | 5.5 |
| 5 | 6 | 45 | 90 | 40.62 ± 2.031 | 5 |
| 6 | 6 | 90 | 90 | 37.28 ± 1.864 | 4.4 |
| 7 | 9 | 0 | 90 | 37.59 ± 1.8795 | 5 |
| 8 | 9 | 45 | 90 | 35.13 ± 1.7565 | 4.5 |
| 9 | 9 | 90 | 90 | 31.38 ± 1.569 | 4 |
4.7 Effect of Cross-Head Speed on Tensile Strength of PLA-TCNP Composite Specimens at 90% Infill
The tensile strength decreases for all orientations at a strain rate of 6 and 9 mm/min. At 6 mm/min, the material has low ductility and tensile strength of 36.37 MPa at 0° orientation, 34.13 MPa at 45° orientation, and 29.3 MPa at 90° orientation. The moderate strain rate reduces the time that the material has to slowly deform and thus fails at an early stage. At a cross head speed of 9 mm/min, the tensile strength decreases to 29.31 MPa at 0° orientation, 29.8 MPa at 45° orientation, and 23.24 MPa at 90° orientation. The higher strain rate does not permit adequate time for stress redistribution and thus leads to brittle failure, particularly, in the 90° orientation because the interlayer adhesion is weakest in this orientation.
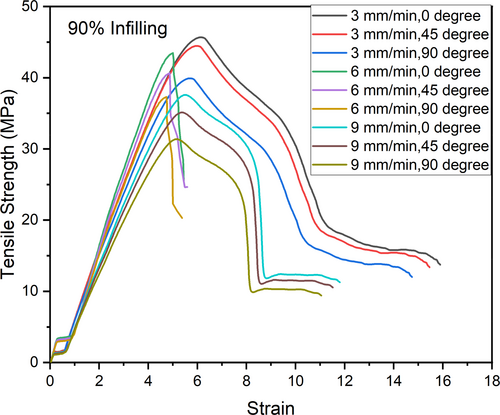
At a 90% infill, the tensile strength of the 90PLA:10TCNP composite shows that there is a systematic reduction of the values with the increase of cross-head speed. The maximum tensile strength was achieved with the rate of 3 mm/min and the value of 45.67 MPa for 0° orientation. The specimens have more time to extend because of the slow strain rate. This slow strain rate assists in the reorientation of the molecular chains and therefore offers additional energy intake before failure. When the strain rate was increased to 6 mm/min, the tensile strength slightly decreased to 43.45 MPa for 0° orientation, 40.62 MPa for 45° orientation, and 37.28 MPa for 90° orientation. It decreases because the molecular chains have less time to react, and thus stress redistribution and material semi-ductile behavior occur. At the highest strain rate of 9 mm/min, tensile strength reduces further, and the values of 37.59 MPa at 0° orientation, 35.13 MPa at 45° orientation, and 31.38 MPa at 90° orientation are recorded. This is due to inadequate time for molecular alignment, which leads to the formation of early cracks and therefore, brittle fracture is favored by high strain rate.
4.8 Orientation-Dependent Behavior of PLA-TCNP Composite Specimens at 90% Infill
Thus, the orientation of the printed layers is the key factor affecting the tensile strength of the developed composite. In all crosshead speeds, 0° orientation provided the highest tensile strength, while 45° and 90° orientations provided the least tensile strength. This is because in the 0° orientation, the load is parallel to the printing layers; this enables efficient stress transfer along the molecular chains and printed layers for ultimate strength. For instance, at 3 mm/min, tensile strength at 0°orientation was 45.67 MPa, which is the highest in this data set. On the other hand, the 90° orientation shows the least tensile strength because the applied load is perpendicular to the printed layers, and stress is transferred across the interlayer bonds. This leads to a weaker material, especially at high strain rates whereby the interlayer bonding cannot yield to the applied stress. For instance, at a rate of 9 mm/min, the tensile strength at 90° was 31.38 MPa, which implied failure due to brittleness because the composite could not absorb stress within the layers well.
4.9 Combined Influence of Cross-Head Speed and Orientation of PLA-TCNP Composite Specimens at 90% Infill
The behavior of the material is further magnified by the combination of the strain rate and orientation of the material. At a strain rate of 3 mm/min, the 0° oriented specimen has the highest tensile strength because the slow rate of straining enables the stress to be distributed evenly across the printed layers. The 45° orientation is slightly lower in performance because the stress is distributed at an angle and includes axial and shear components that are less effective in stress transition. The 90° orientation has substantially less tensile strength because the load is applied in a direction across the printed layers where interlayer adhesion is poor. For 6 and 9 mm/min, the tensile strength reduces in all orientations, with the 0° and 45° orientations showing a less steep decline than the 90° orientation.
Figure 6 presents the influence of cross-head speed on orientation-dependent tensile strength and strain of PLA-TCNP composite specimens at 90% infill. This is because at higher strain rates, the molecular realignment time is considerably less than the time required for the material to change from ductile to brittle failure, especially in the 90° orientation where interlayer bonding is the weakest. The 90% infill assists in preserving structural and tensile strength to some degree, but this benefit is reduced when the strain rates are higher and when the orientation is less than ideal.
4.10 Comparative Analysis of Tensile Strength of PLA-TCNP Composite Specimens With Varying Parameters of Strain Rate, Orientation, and Infill Percentage
The dataset reveals that the optimal tensile strength for 90PLA:10TCNP composites is realized with a 90% infill and a low strain rate of 3 mm/min, especially in the 0° and 45° fiber orientations. A 3 mm/min feed rate with 90% infill yields a tensile strength of 45.67 MPa at 0° and 44.46 MPa at 45°, which proves that high infill significantly increases density and enhances layer adhesion. The lower strain rate enables the molecular chains to reorient slowly and hence encourages ductile deformation, which in turn increases the material's ability to withstand fracture. These results are desirable for applications where high strength and low deformation are needed, as in structural parts for automotive or aerospace applications. The 45°orientation also exhibits reasonable performance and is suitable for applications in which both strength and flexibility are needed, such as mechanical components or functional models.
On the other hand, the 90° orientation reveals relatively lower tensile strengths because the through-thickness load interferes with the interlayer adhesion, which results in more catastrophic failure. This is, particularly, so at higher strain rates where tensile strength is known to reduce sharply. The medium strain rate of 6 mm/min is selected due to its ability to offer both strength and energy absorption and, therefore, is recommended for parts that undergo moderate loading. However, when the rate of extension is high, 9 mm/min, the material is more brittle, especially at 90°, and so it can be used where controlled failure is needed, such as in impact-sensitive or biodegradable packaging. Therefore, for the purpose of achieving the best tensile strength, it is suggested to use 90% infill and 3 mm/min for the strain rate and 0° or 45° for the fiber orientation, in contrast to using 90° orientation for high-stress applications.
The combination of high infill percentage (90%) and low cross head speed (3 mm/min) is found to enhance the tensile strength of the composite. High infill leads to great density of the material, which in turn results in strong interlayer bonding; high load carrying capacity, and slow strain rate results in gradual deformation and better resistance to fracture. This configuration offers the highest tensile strengths, particularly, in the 0° and 45° positions since the stress is distributed efficiently. As the system imposes high strength and durability demands, like automotive or aerospace parts, the setup exhibits the best performance since it eliminates early failure. At a strain rate of 6 mm/min, the material has a good combination of strength and energy dissipation, making it suitable for components that are subjected to moderate loads, where some reduction in strength is desirable for faster production. Conversely, high strain rates (9 mm/min) encourage brittle behavior, especially in 90° orientation, which makes this arrangement useful for applications that need to control the failure of the material, such as in impact-sensitive devices or biodegradable packaging where fracture at a specific time is beneficial to the product's use.
5 Linear Model Analysis of PLA-TCNP (90:10) Composite Specimens Tensile Strength Analysis Based on Taguchi Design and S/N Ratios
Table 5 shows the S/N ratio for the tensile strength of PLA-TCNP (90:10) composite specimens, indicating the effect of various processing factors on its tensile strength fluctuation. Feed rate, with an S/N delta of 1.74, has the same effect on tensile strength variation as the minimum value observed here. Thus, feed rate influences the material properties, but the effect on tensile strength coefficient variability is moderate. This implies that changes in feed rate cause more moderate fluctuations in tensile strength than other factors. Orientation, with an S/N delta of 1.92, also contributes to the variability of tensile strength but certainly not as much as infilling percentage. Different orientation affects stress distribution inside printed material, affecting tensile strength; however, this effect is not as pronounced as the impact of %.
| Level | Strain rate (mm/min) | Orientation (°) | Infilling (%) |
|---|---|---|---|
| 1 | 30.74 | 30.80 | 28.56 |
| 2 | 30.38 | 30.44 | 29.69 |
| 3 | 29.00 | 28.88 | 31.88 |
| Delta | 1.74 | 1.92 | 3.32 |
| Rank | 3 | 2 | 1 |
Infilling percentage shows the maximum S/N delta of 3.32, thereby confirming that it has the maximum impact on the tensile strength range. The higher infill percentages enhance the mechanical properties of the composites and reduce the coefficient of variation of tensile strength between the specimens. This makes infilling the most critical factor in controlling tensile strength consistency in PLA-TCNP composites. To attain higher tensile strength and to minimize the variation of the properties of the material, it is critical to focus on the higher infill percentages and then fine-tune the orientation and feed rate for the best mechanical properties of the material.
Figure 7 presents the main effects plot for the S/N ratios and provides valuable insights into the factors influencing the tensile strength and variability of PLA-TCNP (90:10) composites. The plot also reveals that infill percentage is the most influential factor affecting the tensile strength and its fluctuation, and the maximum S/N ratio is obtained at 90% of infill. This can be explained by the fact that material density increases with infill, which improves interlayer adhesion and the general mechanical properties of the material. The density at 90% infill is higher, which minimizes the presence of voids and uneven distribution, causing more accurate and uniform mechanical properties. This leads to less variation in tensile strength, as is seen from the steep slope of the S/N ratio.
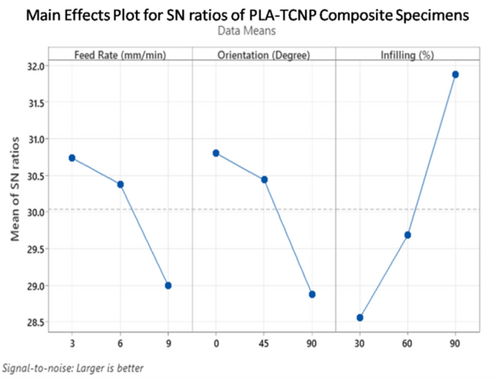
On the other hand, feed rate and orientation exhibit a decreasing trend of the S/N ratio. Lower S/N ratio at higher feed rates at 9 mm/min indicates that as the printing speed increases, there is increased variation and reduced tensile strength. This may be due to the fact that a higher feed rate does not afford the opportunity for adequate layer adhesion and molecular orientation, which results in reduced interlayer bonding and overall material performance. Also, the orientation of the specimens, especially at 90°, leads to a lower S/N ratio, which means that this orientation is not suitable for bearing tensile stress. For printed layers that are oriented normal to the applied load, the material is weaker and more likely to fail at the interlayer interfaces. Thus, the plot reveals that the way to achieve the maximum tensile strength and minimum standard deviation is to concentrate on the high infill percentage (90%), controlling feed rate and orientation to achieve the maximum homogeneity and the greatest strength.
Table 6 shows the ANOVA test conducted in the tensile strength of PLA-TCNP composites. The ANOVA for PLA-TCNP tensile strength shows the contribution of various factors and their interactions on the composites' mechanical properties. The feed rate (mm/min) has a very significant effect on tensile strength with p-value = 0.000 and F-value = 35.89, which implies that feed rate has a very strong effect on the performance of the material. An increase in feed rate may mean faster printing speed and hence weaker molecular adhesion between layers and poor stress redistribution. This may be the reason why tensile strength varies greatly with feed rates, implying that slower rates may result in stronger interlayer bonding.
| Source | df | Seq SS | Adj SS | Adj MS | F | p |
|---|---|---|---|---|---|---|
| Feed rate (mm/min) | 2 | 15.156 | 15.156 | 7.5781 | 35.89 | 0.000 |
| Orientation (°) | 2 | 18.767 | 18.767 | 9.3834 | 44.44 | 0.000 |
| Infilling (%) | 2 | 51.168 | 51.168 | 25.5840 | 121.16 | 0.000 |
| Residual error | 8 | 1.689 | 1.689 | 0.2112 | ||
| Total | 26 | 91.957 |
The orientation (degree) also has a highly significant effect, F = 44.44, p = 0.000. The position of printed layers greatly affects the material's tensile stress capability, with 0° offering the best results due to better alignment and loading along the molecular chains. On the other hand, orientations such as 90° result in low tensile strength due to the fact that the load is applied in a direction that is perpendicular to the interlayer bonds, which are also normally feeble. However, infill percentage is the most influential parameter, with an F-value of 121.16 and a p-value of 0.000, which shows that, indeed, a higher infill density leads to a stronger material. A 90% infill raises the density of the material, improves the interlayer adhesion, and increases the tensile strength.
As for the interactive effects, there are no significant interaction effects for feed rate, orientation, and infilling (feed rate × orientation, feed rate × infilling, and orientation × infilling) since all p-values are greater than 0.05. This means that each of these variables can be controlled separately in order to achieve the highest results. More specifically, feed rate orientation interaction and feed rate infilling interaction are statistically insignificant with p values of 0.307 and 0.195, respectively for tensile strength. While these interactions may not have strong effects on material performance, further studies may show more intricate relationships when the materials are processed under other conditions. Finally, the residual error has a small sum of squares (1.689) and a mean square (0.2112) which mean that the model accounts for most of the variability in tensile strength, leaving a small proportion for other factors that the model cannot explain. Thus, the results stress that infill percentage, orientation, and feed rate are the main parameters influencing the tensile strength of PLA-TCNP composites. According to the results, the most significant of these parameters is infill percentage, and then come orientation and feed rate. The absence of strong interrelations indicates that these parameters can be fine-tuned separately to enhance the properties of the material.
Figure 8 shows the residual plots for the tensile strength of PLA-TCNP (90:10) composite specimens, giving information on how well the model fits into the entire scenario. The normal probability plot shows that the residuals are normally distributed since the points lie close to the reference line. The validity of the ANOVA test results was confirmed by meeting the assumption of normality. From the histogram, it is seen that the distribution of residuals is slightly skewed to the right, meaning that most of the residuals are located at the center of the plot while fewer residuals are located at the two ends. This implies that the residuals are mainly symmetric around zero and hence the model is reasonably linear, though slightly nonlinear.
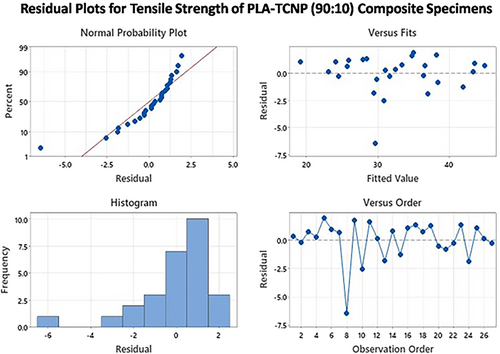
The fits plot shows that the residuals are randomly distributed around the origin, meaning that the model does not leave much more patterns that it cannot explain. The order plot also displays no patterns, proving that the residuals are independent of the observation order. This further supports the fact that there is no autocorrelation or temporal dependency in the data. Therefore, with the exception of a slightly skewed histogram, the residual plots indicate that the model does a good job of accounting for the variability in the tensile strength of PLA-TCNP composites.
Table 7 presents the estimated model coefficients for PLA-TCNP (90:10) S/N ratios of tensile strength for composite specimens, with statistical analysis regarding the significance of the factors and their effects on tensile strength. The value of 30.0410 is a constant value which is used as the benchmark tensile strength when all the parameters are set at their central point. Coefficients for feed rate at 3 mm/min and feed rate at 6 mm/min suggest a positive relation with the tensile strength with Coefficients of 0.6977 and 0.3417, respectively. This implies that when feed rate is increased from 3 to 6 mm/min, tensile strength is slightly enhanced, this is supported by p-values of 0.001 and 0.026, respectively.
| Term | Coef | SE coef | T | p |
|---|---|---|---|---|
| Constant | 30.0410 | 0.08843 | 339.697 | 0.000 |
| Strain Rate 3 | 0.6977 | 0.12507 | 5.579 | 0.001 |
| Strain Rate 6 | 0.3417 | 0.12507 | 2.732 | 0.026 |
| Orientation 0 | 0.7612 | 0.12507 | 6.086 | 0.000 |
| Orientation 45 | 0.3992 | 0.12507 | 3.192 | 0.013 |
| Infilling 30 | −1.4803 | 0.12507 | −11.836 | 0.000 |
| Infilling 60 | −0.3550 | 0.12507 | −2.838 | 0.022 |
The orientation at 0° and orientation at 45° also present positive coefficients of 0.7612 and 0.3992. This indicates that these orientations increase tensile strength. More precisely, the 0° orientation yields the highest increase in strength, which is supported by the p-value of 0.000. On the other hand, the infill percentage of 30% and the infill percentage of 60% have negative coefficients of −1.4803 and −0.3550, respectively. This means that a higher infill percentage decreases the tensile strength where the greatest decline is observed at 30% infill. This is also supported by the p-values (0.000 for 30% and 0.022 for 60%) which are less than 0.05 and, therefore, show that infill has an effect on tensile strength. In conclusion, the proposed model reveals that increased feed rate, preferred orientation, and higher infill percentage enhance the tensile characteristics of the PLA-TCNP composite while lower infill reduces the tensile properties of the PLA-TCNP composite.
Table 8 shows the regression model results for the tensile strength analysis of PLA-TCNP composite specimens with 90:10 ratios. The standard deviation S is presented as 0.4595, which means that the dispersion of the residuals or errors in the models is moderate. The predicted and actual tensile strength results show only minor differences based on the regression model.
| S | R2 | R2 (adj) |
|---|---|---|
| 0.4595 | 98.16% | 94.03% |
The model explains 98.16% of the total variation in tensile strength, as indicated by the remarkably high coefficient of determination (R2) of 98.16%. This implies that the selected factors (feed rate, orientation, and infill percentage) play a significant role in determining the tensile strength of the composite specimens. The coefficient of determination of 94.03% (R2 (adj)) shows that the model is not overfitted and still has a high level of fitness even when the number of uses of predictors in the model is considered. These results demonstrate that the regression model provides an excellent fit for the data and is highly reliable in predicting the tensile strength of the PLA-TCNP (90:10) composite specimens under the above-mentioned experimental conditions.
6 Conclusion
In this study, the tensile properties of PLA/10% TCNP composites printed with a 3D printer were analyzed for different strain rates, orientation, and infilling percentages. From the results obtained, it is evident that the infilling percentage has the biggest impact on tensile strength, where the specimens printed at 90% infill gave the best mechanical properties. The second most important parameter was orientation, where the 0° orientation had higher tensile strength than the 45° and 90° orientations. The strain rate was the least effective; however, the 3 mm/min rate proved to be the most effective.
It was found that the maximum tensile strength was obtained at a strain rate of 3 mm/min, fiber orientation of 0°, and infilling percentage of 90%. This configuration provided a maximum tensile strength of 45.67 ± 2.28 MPa. The statistical analysis showed that each parameter was indeed affecting the result, as ANOVA results showed a p-value less than 0.05, and the R2 value of 98.16% proves that the model is very accurate. The remaining analysis also confirmed the validity of the model with little variation from the expected values.
It is evident from these results that the studies of process parameters are crucial for improving the mechanical properties of 3D-printed PLA-TCNP composites. The findings are most relevant to industries that employ biodegradable composites in structural applications, demonstrating the ability of PLA-TCNP materials to satisfy certain mechanical demands while being biodegradable. For future work, increasing TCNP concentration, using other natural reinforcements, and developing parts with more intricate structures might extend the uses of these composites. In light of this, this study offers a robust background on which the further enhancement of PLA-TCNP composites for various 3D printing applications can be built, as well as the knowledge that can be used to support the future progress of the field.
The future research shall explore the long-term durability and environmental impact of PLA-TCNP composites when they interact with real-world loading through fatigue and impact resistance analysis. Researching the biodegradable features and the recyclability aspects of these composites helps determine their sustainability values for industrial applications. Additional research should use combined reinforcement methods by adding natural fillers and fibers to improve tensile strength and flexural deformation.
Author Contributions
R. Saravanan: conceptualization, investigation, visualization, writing – review and editing, formal analysis, data curation, supervision. Muthuselvan Balasubramanian: investigation, conceptualization, visualization, writing – review and editing, software, supervision. T. Sathish: writing – review and editing, funding acquisition, investigation, validation, methodology, software, formal analysis, supervision, data curation. Jayant Giri: investigation, methodology, visualization, formal analysis, writing – review and editing, data curation. A. Johnson Santhosh: conceptualization, investigation, writing – original draft, writing – review and editing, visualization, validation, methodology, software, formal analysis, supervision, data curation, funding acquisition, project administration, resources. Taoufik Saidani: conceptualization, investigation, funding acquisition, writing – original draft, writing – review and editing, visualization, validation, methodology, software, formal analysis, project administration, resources, supervision, data curation. Bashar Tarawneh: investigation, writing – review and editing, validation, software, project administration, supervision.
Acknowledgments
The authors extend their appreciation to Northern Border University, Saudi Arabia, for supporting this work through project number (NBU-CRP-2025-2225).
Ethics Statement
The authors have nothing to report.
Consent
The authors have nothing to report.
Conflicts of Interest
The authors declare no conflicts of interest.
Open Research
Data Availability Statement
The data that support the findings of this study are available on request from the corresponding author. The data are not publicly available due to privacy or ethical restrictions.


