From Nanoindentation to Microhardness to Tensile Strength: Correlation Coefficients Estimates as a Function of Microstructure in Eutectic SnBi Alloy
Funding: The authors received no specific funding for this work.
ABSTRACT
Determining strength to hardness correlation coefficients on nano and microscale in correspondence to microstructure and composition leads the way to inexpensive, non-destructive ways to predict tensile strength of bulk materials, which is important for developing preventive maintenance procedures in a variety of industries. Nanohardness and microhardness tests were performed on an in-house prepared eutectic SnBi alloy. Elemental composition and eutectic morphology were verified by scanning electron microscopy and energy dispersive spectroscopy. The linear correlation coefficient, C1 = HIT/Hv, between nanoindentation hardness and Vickers microhardness was determined based on experimental measurements. A value of C1 > 1.25 was obtained, exceeding the expected value for polycrystalline alloys C1 = 1.25. The Tabor factor, k = Hv/σ at 8% strain, is well known to be about 3 for polycrystalline alloys. However, for the eutectic alloy, the estimated Tabor factor was consistently greater than 3. The stronger correlation in both cases suggests the presence of an unaccounted factor contributing to both C1 and k. Comparison to coefficients estimated from data available for other alloy systems is discussed.
1 Introduction
The most compelling points of importance correlating nanoindentation (NI) hardness measurements to ultimate tensile strength (σUTS) are outlined by Brooks et al. [1] and Walley [2]. First, reliable hardness-strength correlation facilitates fast and inexpensive mechanical properties evaluation. Second, non-destructive tests, such as hardness measurements, allow inspection of in-service and in-service conditions without harming the equipment [3]. The third important point is that a very little quantity of materials is required for hardness testing as opposed to ASTM tensile tests. Rapid developments of synthetic methods of fabrication necessitate a pivot to more localized testing techniques [4-10], such as microhardness and NI.
Notably, the same proportionality relationship, coefficient may vary, does not hold for all metals and alloys in relation to either Vickers or Brinell hardness, HB. A distilled relation specifically for steels was adopted in textbooks [14, 15] HB = 3.45σUTS An analysis of the hardness-strength relationship for electroformed nanocrystalline materials was conducted by Brooks et al. [1], followed by an overview by Kumar et al. [18]. It was concluded that the Hv = 3σUTS expression is a reliable predictor for nanocrystalline electrodeposits, while Hv = 3σy is inapplicable to that class of materials due to the fact they do not deform in an ideally plastic manner. A number of experiments and the general theory of the relationship between microscopic hardness and macroscopic strength with reference to microstructure, composition, heat, and mechanical treatment are described by Brointmen [19], Pintaude [20], Tabor [16, 17, 21], Khodabakhshi et al. [22], Zhang et al. [23], and Yakubtsov et al. [24]. The main categories for the strength-hardness relationship are related to the material's microstructure and ability to deform plastically [23]. Zhang's group [23] investigated whether one-third of HV is equal to σY or σUTS in all the materials tested (relation 1). Three types of materials have been studied: crystalline metals and alloys, amorphous solids, and ceramics. Zhang's group explored the effect of heat treatment and cold work on microhardness–strength linear coefficient without specifying grain size, however. The correlation coefficient, k, varies depending on the elemental composition and microstructure of the material. There are four general categories, according to Zhang's study, see Table 1.
| Strength–hardness relationship | Materials type | Grain size range, experimentally measured | Heat treatment | Mech. treatment | Mech. failure | Relation |
|---|---|---|---|---|---|---|
| 3σy < HV < 3σUTS | Metal, alloys, various bulk metallic glasses (BMG), ceramics | Coarse grains > 100 μm | Annealed | Mixed failure | 1 | |
| HV ≈ 3σ | Metal, alloys | Micro (1–100 μm), ultrafine (1–0.1 μm), nanostructures < 100 nm | Cold roll to severe deformation (ECAP) | Shear | 2 | |
| HV < 3σ | Alloys, shearable BMG | 1 μm > ultrafine grains > 0.1 μm | High pressure torsion (HPT) | Ductile failure, shear | 3 | |
| HV > 3σ | Brittle and annealed BMG | Brittle failure, normal fracture | 4 |
Knapp et al. [25] presented excellent overviews of the nanoindentation technique, a widely accepted Oliver-Parr method [27], in conjunction with finite-element analysis to improve hardness measurements on thin films and materials comparable in strength to diamond. Later, Shuman's group [28] offered additional insights on NI and microindentation tests, comparing elastic modulus calculations from reloading curves to traditionally used, unloading curves. Shuman's group outlines the potential reasons for inflated elastic modulus, such as the pile-up effect, indent sharpness effect, and elastic recovery. Shuman's group points out the difference between testing a single crystal when crystallographic orientation with respect to the indenter is fixed and polycrystalline material when the indenter may be placed into grains of different crystallographic orientations. The anisotropy and crystallographic effects were deeply explored and described in review by Armstrong et al. [29]. To summarize, elastic anisotropy, polycrystallinity, imperfections, morphology of microstructure, chemical composition, mechanical and heat treatment can influence the actual value of C1, relation 1 in Table 1. Geng's theoretical model connecting micro and nanohardness [30] supported by experimental data performed on Fe–Cr alloys, without specifying the microstructure of the alloy under study, concludes that quantitative corrections for pileups are similar in nano and micro-scale measurements. Geng's suggests the possibility of a universal linear relationship for all metallic materials, σUTS ∼ HIT.
Our goal in this paper is to determine the coefficient, C1, and estimate the Tabor factor, k, for eutectic SnBi alloy in correspondence to microstructure and composition without any additional mechanical or heat treatment. We intend to pioneer a consistent study by starting with a polycrystalline substitutional binary alloy having an eutectic microstructure after slow solidification. So far, we could not find systematic studies on hardness-strength correlation considering all variables listed above. Our second goal is to verify the consistency of experimental results in comparison to the calculated coefficients based on data available in the literature [16, 17, 21-24, 26-28, 31-43]. This study's expected outcomes are the values for two correlation coefficients that bridge nano-, micro-, and macro-scale mechanical properties. Once these coefficients are validated and firmly established for a specific class of materials, a unified coefficient linking nano- to macro-scale properties can be determined, σUTS = HIT/C1k. This will facilitate the estimation of bulk material strength from minimal quantities of nanoengineered or synthesized materials. Our findings will contribute to the existing literature by providing a robust and reliable framework for quality control, predictive maintenance, and scalable manufacturing criteria.
The choice of the material is driven by a quest of the microelectronic industry for lead-free solder to replace primarily used solder materials such as SnPb due to detrimental effects on human health and environment contamination [44, 45]. SnBi alloy, with its similarity to SnPb in phase transformations, has been a promising candidate because of its low melting point (138.8°C) [41]. The relationship between changes in interlamellar distances at eutectic SnBi composition and corresponding microhardness was reported by Xiaowu et al. [32]. Tin-bismuth solder has been extensively investigated in terms of morphology, strength, hardness, and creep behavior [33-42]. Our study on establishing hardness-strength correlation coefficients for Sn–Bi alloys contributes to the potential early adoption of preventive maintenance [3, 5-7, 9] in microelectronics, where lead-free eutectic solders are frequently used [34-40]. This approach could be particularly beneficial for assessing the integrity of micro-joints, allowing for a non-destructive evaluation of service life.
2 Materials and Methods
2.1 Raw Materials and Sample Preparation
SnBi alloy of 58 wt% Bi was prepared at the Santa Clara University Materials Laboratory. Chemically pure, 99.9%, Sn and Bi were purchased from Sigma-Aldrich and Fisher Chemical, respectively. The powders of the desired proportion were weighed, manually mixed, stirred, then melted and solidified twice before preparation for microstructure observations. Ten grams total weight of alloy was prepared, with an accuracy of better than 0.1 g, so that would correspond to an error of less than 1 wt%. A thermocouple was immersed into the melt to monitor the cooling rate overnight in the air. The average cooling rate is 0.14 ± 0.02 C/s. A slight compositional gradient and variation in microstructure were expected due to variations in the cooling rate.
Two disc-shape samples 1 cm in diameter and 2–3 mm tall were embedded in an epoxy mount for mechanical polishing and handling. Specimens were ground with 240, 400, and 600 grit SiC papers (Buehler), followed by polishing with 1.0-, 0.3-, and 0.05-μm alumina powder suspended in water. The epoxy mount was later removed before characterization by scanning electron microscope (SEM) to avoid surface charging issues.
2.2 Materials Characterization Methods and Image Analysis
The microstructural morphology of the SnBi sample was done by SEM, using a Hitachi S-4800. Elemental mapping and composition verification was done by energy dispersive spectroscopy (EDS), using X-Max detector Oxford Instruments. Backscattered electrons (BSE) were used for atomic composition contrast imaging. BSE images were transferred to an EDS detector equipped with AZtec software for elemental mapping and compositional analysis. Two different areas of the sample were examined at different magnifications. Ten BSE images and four EDS maps were acquired for analysis. MATLAB and ImageJ software were used for image analysis based on atomic contrast. Colony boundaries were marked with white lines. Nine colonies, 66 aspect ratios, and 98 interlamellar distances were measured altogether.
2.3 Microhardness and Nanohardness Measurements
Microhardness was evaluated by the Vickers method using a Leco LM 248AT test machine with an applied load of 1 N. The dwell time was 10 s. The ASTM E92-17 standard procedure was used. The Leco LM 248AT test machine was equipped with a 4-side pyramidal diamond indenter and Cornerstone software allowing semi-automated HV measurements from the digital display. The microhardness test was repeated for eight trials on the same sample. The tests were performed randomly on the sample without attempting to discern the effect of different phases. Vickers indentations were done, with each indentation being two sizes of the indent area apart from each other in both directions to avoid the influence of adjacent indentations.
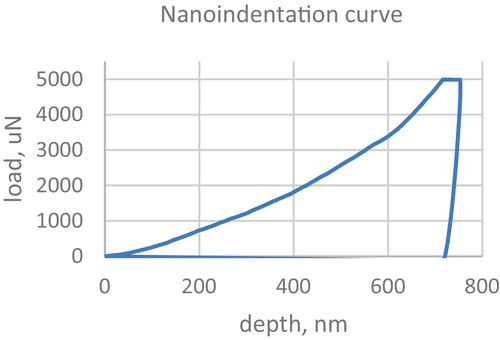
A Hysitron TI Premier nanoindenter, equipped with a Berkovich tip [46, 47], was used for nanoscale hardness measurements in static mode. A peak load of 5000 μN was used. 2400 data points per load/unload curve were acquired. Nanoindentations were done in displacement-control to a depth of 750 nm on the polished samples in a 2 × 2 array, with each indentation 50 μm apart in both directions to avoid influence of adjacent indentations. The tests were performed randomly on the sample without attempting to discern the effect of different phases. A Hysitron TI nanoindenter was equipped with a software package that outputs the standard NI parameters for each acquired load/unload curve.
3 Results
3.1 Elemental Composition Verification Based on EDS
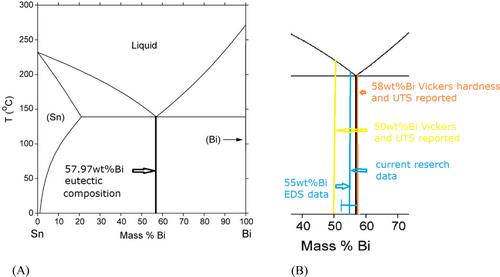
Shown in Figure 1A is a representative EDS map, with green corresponding to Bi and red to Sn. Aztec software estimates 55 wt% Bi as a total composition. An x-ray spectrum collected from the entire image is shown in Figure 1B. There was no evidence of impurities present in the alloy. Overall, EDS measurements for the entire sample indicated composition variation in the range of 5 wt% Bi, resulting to 55 ± 2.5 wt% Bi. Elemental composition results along with the SnBi phase diagram are shown in Figure 2.
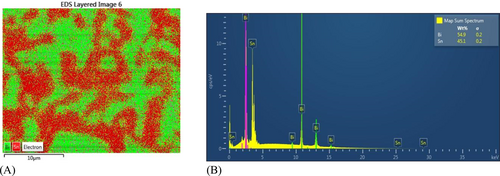
AZtec EDS software with feature recognition can automatically calculate the aspect ratios of the Bi islands. The aspect ratio using this method was found to be in the range of 2.10–1.98. However, AZtec measures the ratio of the longest side to the shortest, which is reciprocal from what ImageJ measures—the shortest side to the longest. The reciprocal of the measured EDS AZtec ratio comparable to the BSE ImageJ range is then found to be 0.47–0.5. The irregular shape of individual lamellas is consistent between BSE and EDS images.
3.2 Microstructure, Eutectic Morphology Characterization Based on Atomic Contrast
BSE images from a difference in atomic numbers of constituent elements [48-51] can be seen for the SnBi alloy in Figures 3-5. The outlines of colonies for size measurements are drawn in ImageJ. The average colony size ranged from 1608 to 1211 μm2. This leads to the average colony size being in the range of 35–40 μm, assuming a square root relationship between area and size. The mean aspect ratio of the Bi-rich phase was found to be 0.42 and 0.83, depending on the size of the colony, with larger islands having larger aspect ratios, Figure 4. The interlamellar spacing between the two phases ranges between 7.2 ± 1.9 μm for one area, Figure 5A, and 4.5 ± 0.8 μm for another area on the same sample, Figure 5B. The measured interlamellar distance on average is ∼6 μm. The interlamellar spacing is the distance between the centers of two adjacent lamellas [14, 49]. If the average colony size is about 35–40 μm with interlamellar distance of 6 μm, we can reasonably assume that the size of individual lamellas is about ∼6–7 μm. The observed morphology of individual lamellae was found to be of an irregular shape and consistent with EDS observations.

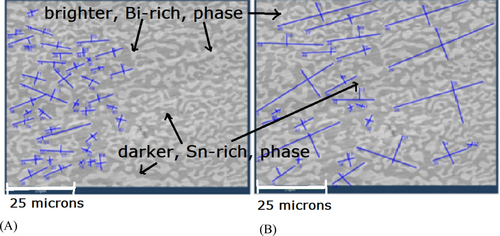
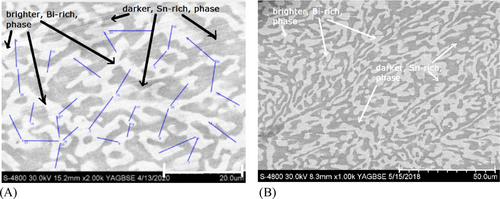
The results of size and interlamellar distances are summarized in Table 2. The colony size is estimated as 35–40 μm or fine-grained material. The interlamellar spacing between the two phases ranged from 7.2 ± 1.9 to 4.5 ± 0.8 μm for one area to another area on the same sample. The average size of individual lamellas is about 6 μm, corresponding to the low end of fine-grained microstructure.
| Colony size, μm | Average interlamellar distance, μm | Hv, measured, MPa | Hv, estimated based on measured interlamellar distance, MPa | HIT, measured, MPa | HIT, reported [33] MPa | C1 = HIT/HV |
|---|---|---|---|---|---|---|
| 35–40 | 6 | 193.5 ± 18.8 | 235 ± 35 | 340 ± 11 | 287 | 1.2–1.8 |
3.3 Estimating Linear Correlation Coefficients: C1 and k
C1, nano to microhardness multiplicity factor, was found in the range of 1.2–1.8, calculated using relation (1) based on our measurements and Shen's value [33], Table 2. Nanoindentation test data and representative load/unload curve are shown in Table 3 and Figure 6. The average nanoindentation hardness, HIT, was measured to be 340 ± 11 MPa, Table 2.
| Max load, μN | Max depth, nm | Stiffness (μN/nm) | Reduces modulus, GPa | Nano hardness, GPa |
|---|---|---|---|---|
| 4975.0 ± 6.5 | 758.9 ± 12.3 | 251.7 ± 7.5 | 58.262 ± 0.9 | 0.340 ± 0.01 |
- Note: The representative load/unload curve is shown in Figure 6.
The average Vickers hardness, HV, was measured to be 193.5 ± 18.8 MPa. A correspondence between interlamellar spacing and Vickers hardness for 58 wt% Bi alloy [32] was reported as follows: the spacing from 1.4 to 10 μm corresponds to 27 to 20 HV (kg/mm2) or 200 to 270 MPa. Expected hardness and measured hardness, 193.5 ± 18.8 MPa, being in good agreement with each other, are summarized along with morphology data in Table 2. The correlation coefficient, k, was calculated using Tabor factor definition (Hv/σUTS). First, we estimated k for 55 wt% Bi alloy based on our values for Hv and reported σUTS data [36], Table 3. k is found to be in the range of 3.6–4.4, averaging ∼4.0. For 58 wt% Bi alloy, two values of hardness and two values of σUTS are reported. If the reported σUTS = 63.6 MPa [36] and 60.2 MPa [33] are assumed for the reported range of Hv, 200–287 MPa [32], then the Tabor factor is 3.1–4.8. If the reported σUTS = 63.6 MPa [36] and 60.2 MPa [33] are assumed for the reported hardness, Hv = 210 [35], then the Tabor factor is 3.3–3.5, Table 4. Evidently, the variation due to solidification rate (interlamellar distances) in reported Hv and σUTS for a given composition influences the results for the eutectic microstructure. Nevertheless, the Tabor factor is consistently being greater than 3, Table 4.
| Composition, wt% Bi | HV, MPa | σUTS, MPa | Tabor factor, k |
|---|---|---|---|
| 55 | 193.5a –235b | 53.1 [36] | 3.6–4.4 |
| 58 | 210 [35] | 60.2 [33] | 3.3–3.5 |
| 200–287 [32] | 63.6 [36] | 3.1–4.8 |
- a HV = 193.5 (measured).
- b HV = 235 (estimated based on measured interlamellar distance).
4 Discussion
4.1 Eutectic Morphology in Correlation to Hardness and Strength
EDS analysis yielded 55 ± 2.5 wt% Bi in-house made alloy composition. EDS, phase diagram, and original weight agree within a margin of error of electron microscopy and manual sample preparation. The morphology observations closely resemble the morphology of 58 wt% Bi alloy [40]. Our EDS data indicate no presence of second phase inclusions, as one may have been expected for off-eutectic composition. Therefore, we do not expect a significant variation in microstructure within ±2.5 wt% Bi near eutectic. In-house made alloy has fine-grained microstructure strengthened by the eutectic phase. BSE and Vickers hardness measurements confirm the reported ability to estimate Hv from interlamellar distances of the eutectic [32], Table 2. Therefore, reliable hardness assessments can be done based on morphology observations only.
Our BSE and EDS measurements show no presence of off-eutectic phase, only eutectic morphology; therefore, we find it justifiable to use reported σUTS (for static tensile tests) from different sources to bracket a possible variation of Tabor factor for eutectic and near eutectic composition, Table 4. Notably, NI hardness data reported by Shen's group [33] for 50–70 wt% of Bi remains constant. Reported σUTS data may vary due to slight differences in microstructure, lamella spacing, and size, due to different rates of solidification. However, the microstructure remains 100% eutectic.
4.2 Tabor Factor, k, as a Function of Strengthening Mechanisms
The original papers by David Tabor [16, 17] define the condition under which the basic equation for all indentation is valid. First, the solid is isotropic; second, there is no difference between yield stress and flow stress; it is assumed the material is fully work-hardened; third, elastic deformation is unimportant. For an ideal plastic material under tensile conditions, σY is essentially σUTS (σY = σUTS). Realistically, this relationship holds at about 8% of deformation; materials are fully work-hardened.
k = 3 relationship has been established for coarse-grained polycrystalline materials, specifically carbon and alloy steels after annealing, normalization, and quench-to-temper conditions, see ASM Materials handbook for data on steel [1]. However, Callister and Rethwisch [15] points out some differences in the correlation coefficient or the slope of the trend line between σUTS and Brinell hardness for the following materials: nodular cast iron (strongest, steepest slope), steel (lesser correlation), and brass (flatter slope), smallest correlation between the three alloys. Therefore, it should not be expected that the k = 3 ratio to hold for Vickers hardness for all metals and alloys. Calculating strength from Vickers and nanoindentation hardness measurements that were divided by a Tabor factor of 3 lead to a lot of data inconsistencies when plotting the Hall-Patch equation [13]. The importance of tying the Tabor factor to the grain size and structural anisotropy was indicated by Brooks et al. [1] and discussed in reviews by Kumar et al. [18], Broitmen [19] and later by Pintaude [20].
The reported range of linear coefficient, k = σUTS/Hv, can be summarized as 2.8–3.45, see literature [1, 16, 17, 22, 24]. The observations of dependence of Tabor factor on grain size were discussed in literature [22, 24, 52]. Taha and Hammad [52] reported that the resistance of grain boundaries and second phase boundaries to deformation vary depending on material and composition. Their group investigated Al, Cu, Al-MD-105, and Al-Cu alloy. Al-MD-105 indicated the highest slope in Hall–Petch equation, while AL being the lowest and annealed copper being in the middle.
The physical interpretation of the experimental observations suggests that the assumption of isotropy in the solid may no longer be valid, and the assumption of a purely plastic solid may not hold. Consequently, the correlation coefficient may deviate from the conventional value of 3, as discussed by Tabor [16, 17]. Since grain size dictates the presence of grain boundaries, and grain boundaries serve as obstacles to dislocation motion, it is plausible that the Tabor factor is influenced by specific strengthening mechanisms. These may include grain size strengthening, solid solution strengthening, second-phase strengthening, dislocation strengthening, or a combination of these factors.
4.2.1 Role of the Eutectic Phase
It has been postulated in reputable materials science textbooks [14, 15] that the eutectic phase provides additional obstacles to resist dislocation flow, the effect known as strengthening by eutectic. It may be considered a special case of strengthening by the second phase. The lamellas morphology and interlamellar spacing, see Figures 3-5, play a particularly critical role in how much harder and stronger the alloy of eutectic composition (58 wt% Bi) is going to be compared to pure constituents and off-eutectic composition [32, 36]. The eutectic-phase strengthening contributions to the yield strength can be estimated according to the thermal mismatch, Orowan looping, load transfer, and Hall–Petch mechanisms [53]. Second phase strengthening has been applied to high entropy alloys (HEAs) for optimizing mechanical properties. Yang's group [54] conducted mechanical testing of a eutectic dual-phase AlCoCrFeNi HEA with homogenous distribution of body-centered cubic (BCC) and face-centered cubic (FCC) lamellar phases inside a transmission electron microscope; we found that although BCC was truly the hard phase, decreasing the proportion of BCC phase in fact increased the strength due to the existence of chemically disordered semi-coherent phase boundaries, which acted as potent impediments to dislocation motion resulting in dense dislocation storage in FCC phases.
Our result, consistent k > 3, Table 4, at a near eutectic composition leads us to believe we may be observing the effect of strengthening by eutectic phase. If our hypothesis of strengthening by eutectic phase, stronger and harder materials, is valid, it would bring Tabor factor to be > 3 according to Zhang's classification, Table 1.
4.2.2 Role of the Second Phase
| C1 = HIT/HV | k = HV/σUTS | Grain size, μm | Strengthening mechanisms | Material, composition, processing | Research groups |
|---|---|---|---|---|---|
| 1.13 | n/a | n/a | No | Single crystal Cu | Sawa [26] |
| n/a | 2.44** | 205 | Grains | Annealed Cu | Zhang et al. [23] |
| n/a | 2.03** | 300 | Grains and solid solution | Annealed Cu32 wt% Zn | Zhang et al. [23] |
| n/a | 3.41** | 25 | Grains and dislocations | Cold rolled Cu | Zhang et al. [23] |
| n/a | 3.45** | 100 | Many | Cold rolled Cu32 wt% Zn | Zhang et al. [23] |
| 1.25 | n/a | n/a | Many | SK85 steel | Sawa [26] |
| 1.2–1.8 | 3.6–4.4 | 35–40 | Eutectic | Sn55 wt% Bi | Present work |
| 1.5–2.0* | 3.0–3.4* | 0.6–1.8 | Many | DP980 steel | Taylor et al. [31] |
| n/a | 2.64–3.33** | 30–40 | Many | Bainitic low carbon steel | Yakubtsov et al. [24] |
| n/a | ∼3.36 with significant scatter | 0.2–1.4 | Many | AlMg alloy nanoparticles reinforced, friction stir processed | Khodabakhshi et al. [55] |
| n/a | < 3 | Ultra-fine grained | Many | Al, AA 3003 Al alloy, Cu, Ni, Ti, low carbon steel; friction stir processed | Khodabakhshi et al. [22] |
| n/a | ∼3 | 200 and 91 nm | Many | Cu and CuZn after ECAP | Zhang et al. [23] |
| n/a | < 3 | 34 nm | Many | CuZn after HPT | Zhang et al. [23] |
| n/a | ∼3.0 | 0.005 | Many | Electroformed nanocrystallines | Brooks et al. [1] |
Taylor's group [31] investigated eight commercial steels to quantify the hardness of individual the individual constituents, ferrite and martensite. Yield strength was correlated directly to ferrite hardness, indicating that for similar microstructural morphology, yield strength is controlled by the softer matrix phase, ferrite.
Our data, 3.6 < k < 4.4, is in better agreement with data obtained on steels, second phase(s) reinforced material, because Sn58 wt% Bi is a eutectic alloy. The lamella structure of the eutectic phase, which is 100% or the entire amount, is a special case of microstructural morphology at 58 wt% Bi composition, see Figures 3-5. The reinforcement happens via a composite strengthening mechanism [15]. This mechanism works through load transfer between the two constituent phases, lamellas, where the more compliant phase transfers stress to the stiffer phase. By taking advantage of the strength of the stiff phase and the ductility of the compliant phase, the overall strength of the material increases. The eutectic strengthening and morphology are closer to complex strengthening mechanisms and morphology of steels. This is why our data agrees better with steels than with annealed elemental metal, Cu, and substitutional CuZn alloys.
4.2.3 Role of Fine Grains, Alloying and Severe Plastic Deformation
Strong deviation from relation (2) in Table 1 or 4 < k < 8 is reported for brittle nanocrystalline materials, relation (4) Table 1. Khodabakhshi's group [55, 22] is focused on fine grained and ultrafine grained metals and alloys reinforced by secondary phase and processed by severe plastic deformation (friction stir process). Their group reveals that hardness-strength relations do not obey the established relationship for coarse-grained materials, relation (2) in Table 1. Khodabakhshi's group reports the inability to offer a general linear correlation between microhardness and tensile strength for metal matrix nanocomposites due to structural heterogeneity [22]. Analysis of the microhardness-tensile strength relationship for nanofabricated crystalline materials is reported in the literature [1, 19, 22], considering the effect of heat treatment and cold work without specifying grain size. Additional strengthening, strengthening by dislocations, may manifest itself as k > 3, k = 3.4, and k = 3.5 were reported for cold-rolled copper and Cu 35 wt% Zn alloy respectively. It appears the correlation was stronger for solid solution strengthened and work-hardened alloys, k ≈ 3, relation (2) as opposed to annealed elemental metal and binary alloy, k < 3, relation (3). k = 2.4 for annealed copper and k = 2.0 for Cu 35 wt% Zn alloy were reported [23], Table 1.
The list of investigated materials, Table 5, based on our extensive literature search is organized as follows: top row (light orange)—single crystal elemental metal, second row (light blue)—annealed polycrystalline metals, third (light purple)—substitutional polycrystalline binary alloy, fourth and fifth (light green)—cold worked metal and alloy, middle rows (light blue)—second phase strengthened alloys, nanocrystalline metals and composites subjected to severe plastic deformation listed on the bottom (light gray). It is notable that the Tabor factor is to increase as the number of strengthening mechanisms increases. Also, the suggested classification [23], relations (2, 3, and 4), seem to work well for micro grained materials, while on the nanoscale the results are inconsistent. Extensive additional studies need to be done to clarify the influence of each specific mechanism of strengthening.
4.3 Considerations for the Method of Hardness Measurement, Material Crystallinity, and Nanoindentation Size Effect When Evaluating C1
- projected area, not the surface of the indentation, is used for calculations of HIT;
- zero-point or contact-point detection;
- truncation or bluntness of the indenter;
- work hardening; material under testing is comparable in hardness to the indent;
- small indentation depth.
Oliver and Pharr demonstrated that a 4-sided pyramidal Vickers indenter has the same area function as a 3-sided Berkovich indenter [46, 47]. The original paper also emphasizes that the procedure for determining the area function does not require imaging of indentation. Visualization of the indent is required in traditional methods (Vickers, Knoop, Brinell, and Rockwell). The fundamental difference between NI and Vickers hardness manifests itself in using projected area as opposed to measured total contact area of the imprint. This key difference results in a main discrepancy between the hardness measurements obtained from each technique. The errors in depth-to-area conversions pile-up/sink-in represent a secondary source of hardness discrepancies. Pile-up and sink-in effects represent two different physical theories and therefore materials [17, 23]. Pile-up or “barrel-shaped” indent morphology is observed on work-hardened materials, representing rigid-plastic solid. Sink-in or “pincushion” indent morphology corresponds to annealed metals and polymers. According to Tabor, a small correction needs to be applied to calculate Vickers hardness from the length of the diagonal; in either case, however, no relative percent error is available for this effect in the referenced papers. With single crystals, the behavior is complicated by the fact that plastic deformation occurs only in a limited number of slip planes, and resolved shear stress can be very different from one slip system to another [17].
For the SnBi alloy tested, the correlation coefficient was found to be 1.5 on average. Our results, 1.2 < C1 < 1.8, suggest a stronger correlation than forecasted by Sawa [26] for both single crystals, relation (6) and polycrystals, relation (7). We incline to think that eutectic morphology, Figures 3-5, may play the contributing factor to a higher coefficient between nanoindentation and Vickers hardness measurements. Oliver and Parr tested annealed amorphous glasses and single crystal elemental metals, concluding that the proposed model works well for elastically isotropic materials. Although most single crystals of metals are anisotropic, except for W. The experimental elastic modulus cited for Al, fused silica, and W are single values, implying a bulk isotropic model was assumed. According to Pintaude [20], the anisotropy and crystallographic effects were deeply explored and described in a review by Armstrong's group [29]. Different values (C1 > 1) are reported for polycrystalline metals and alloys [31] and no correlation is found for rubbers and diamond-like carbon films [26]. We think that eutectic morphology may have a stronger contribution to the hardness–strength correlation than reported for amorphous and crystalline solids.
Taylor's group [31] reported a significant amount of hardness versus strength data for DP980 steel, estimating the range for the C1 coefficient to be between 1.5 and 2.0. Taylor's group results also indicated a stronger, C1 > 1.25, correlation between nanoindentation hardness and Vickers hardness [26], Table 5. The discrepancy between Taylor's group and our results may stem from the difference in materials studied. While Taylor's group focused on commercial steels, our research concentrated on in-house eutectic SnBi alloy. Additionally, Taylor took the NI hardness at 40 nm, which may result in up to three times higher hardness if a significant indentation size effect existed [56]. That may be another reason why their coefficient was higher. Note, the NI size effect is pronounced at shallow indentation depths, less than about 500 nm, according to the review paper [56]. The nanoindentation size effect can be considered negligible in our case because the measured penetration depth is large, 758.9 ± 12.3, Table 3. Therefore, we are inclined to attribute the stronger correlation, relation (7), to the presence of the second phase(s) in steels and the eutectic phase in SnBi alloy in particular. The significance of our finding is that elastic anisotropy, polycrystallinity, imperfections, morphology of microstructure, chemical composition, and mechanical and heat treatment can influence the actual value of C1. Additional experimentation is planned to provide experimental evidence for individual cases to establish the coefficients for practical reasons.
4.4 From Nanoindentation to Ultimate Tensile Strength
Geng et al. [30] suggests the possibility of a universal linear relationship for all metallic materials. Assuming a vast amount of experimental data supports numerical values for the correlation coefficients, C1 and k, the relationship σUTS = HIT/C1k may allow forecasting tensile strength from NI measurements. It enables practical introduction of go-no-go criteria for R&D, quality control in nanoengineering, and synthesis of novel materials when only a very small amount of material is available for testing. This study is a first step toward that goal.
5 Conclusion
The key contribution of this study is that the eutectic morphology of the binary 55 ± 2.5 wt% SnBi alloy results in both hardness correlation coefficients being greater than expected. This reinforces the importance of understanding and considering the microstructure, composition, and strengthening mechanisms in hardness-strength studies. The NI to Vickers hardness linear correlation coefficient, C1, is found to be greater than 1.25, with a correlation stronger than that observed in polycrystalline metals. The Tabor factor, k, is consistently greater than 3, which is stronger than for annealed substitutional binary alloys. Our data align well with previously reported data for fine-grained, polycrystalline, second-phase strengthened alloys without mechanical treatment. This work pioneers a systematic study that establishes a linear correlation between NI hardness and σUTS for binary alloys.
Author Contributions
Nataliya Starostina: conceptualization, investigation, methodology, writing – review and editing, formal analysis, supervision. Aja Hartman: writing – original draft, visualization, validation. Rosemary Cole: validation, visualization. Dongmeng Li: writing – original draft, visualization, validation. Jong W. Park: writing – original draft, validation, visualization.
Acknowledgments
We would like to acknowledge the contributions of Jamie Ferris, teaching assistant, for helping with mechanical measurements, Dr. M. McElfresh for proofreading the manuscript, Dr. R. Marks for supplying samples, and Prof. D. Fabris for support of the MECH333B laboratory course.
Ethics Statement
There was no research involving Human Participants and/or animals. All authors conducted research and submitted the original manuscript in compliance with ethical standards.
Conflicts of Interest
Dr. Nataliya Starostina, adjunct lecturer at SCU, CA, USA and principal research scientist at ASDRP, CA,USA, declares that research was conducted in absence any commercial or financial relationships that could be construed as a potential conflict of interest. The remaining authors, graduate students at SCU, declare that the research was conducted in the absence of any commercial or financial relationships that could be construed as a potential conflict of interest.
Open Research
Data Availability Statement
The data that support the findings of this study are available on request from the corresponding author. The data are not publicly available due to privacy or ethical restrictions.


