Water-to-Air Imaging: A Recovery Method for the Instantaneous Distorted Image Based on Structured Light and Local Approximate Registration
Funding: This work was supported by Guangxi Natural Science Foundation projects (Grant Number: 2024JJA170158 and 2025GXNSFAA069222), Hezhou University Doctoral Research Start-up Fund Project (Grant Number: 2024BSQD10), Hezhou University Interdisciplinary and Collaborative Research Project (Grant Number: XKJC202404), and Guangxi Young and Middle-Aged Teachers' Basic Research Ability Improvement Project (Grant Number: 2024KY0715).
ABSTRACT
Imaging through a continuously fluctuating water–air interface (WAI) is challenging. The image obtained in this way will suffer from complex refraction distortions that hinder the observer's accurate identification of the object. Reversing these distortions is an ill-posed problem, and the current restoration methods using high-resolution video streams are difficult to adapt to real-time observation scenarios. This paper proposes a method for restoring instantaneous distorted images based on structured light and local approximate registration. The scheme first uses structured light measurement technology to obtain the fluctuation information of the water surface. Then, the displacement information of the feature points on the distorted structured light image and the standard structured light image is obtained through the feature extraction algorithm and is used to estimate the distortion vector field of the corresponding sampling points in the distorted scene image. On this basis, the local approximate algorithm is used to reconstruct the distortion-free scene image. Experimental results show that the proposed algorithm can not only reduce image distortion and improve image visualization, but also has significantly better computational efficiency than other methods, achieving an “end-to-end” processing effect.
1 Introduction
Cross-media imaging has the ability to perceive targets above water and has important application value in military and civil fields, such as seabed exploration, airborne warning, and marine life research [1-5]. However, images obtained in this way will have complex refraction distortion and motion blur problems, which may lead to image fragmentation in severe cases. Since the shape of the seawater interface is unknown, it is difficult to remove these distortions from a single distorted image, and it must be estimated synchronously with the real scene image.
Research on this complex problem has been going on for decades. Currently, there are two main types of methods. One is the method based on image sequence [6-13]. This scheme assumes that the real scene is hidden in the image sequence of the distorted scene observed through the water surface multiple times, so the time–space correlation of the distorted image sequence can be used to restore a clear, distortion-free image. The image sequence-based method adopts the idea of multi-image fusion, which can obtain more complete image information and perform better in image reconstruction, but it needs to obtain a certain length of data frames before processing, so there is a time delay in the recovery result.
Another approach is to estimate the shape of the water surface in real time. Milder et al. [14] first proposed reconstructing distorted scenes by estimating the water surface shape. Levin et al. [15] designed a dual-band underwater imaging device and elaborated on the restoration process of distorted images. First, different illumination sources were used to illuminate the water surface and underwater target scene respectively (red light source illuminates the water surface, and green light source illuminates the object under test). a camera was employed to concurrently acquire the warped scene image as well as the reflected image of water–air interface (WAI). Subsequently, the slope of the flashing point was extracted from the reflection image and used to retrieve the scene image fragment. Finally, by accumulating multiple short-exposure images, a complete distortion-free image was obtained. Alterman et al. [16, 17] combined a refraction imaging sensor with an underwater camera to construct a new underwater–air imaging system. The system utilizes the sun as a reference point and applies the pinhole imaging concept to sample the wave surface via a pinhole array, thus obtaining a sparse representation of the water ripples' slope. The configuration of the water ripple is assessed on the premise that it is smooth and integrable, ultimately restoring the undistorted image by ray tracing. Gardashov et al. [18] proposed a real-time distortion correction method. They first used the characteristics of sunlight scintillation to reconstruct the geometric shape of WAI, and then corrected the geometrically distorted image by back-projection. The aforementioned method seeks to recover the undistorted image by measuring the slope distribution of the water surface. However, current approaches have strict prerequisites on application settings, necessitating either specialized lighting conditions or particular lighting apparatus, and the precision of water surface estimation often fails to satisfy application standards.
The three-dimensional (3D) measurement technology based on structured light has the advantages of high accuracy, fast speed, and strong adaptability, and is widely used in various fields [19-21]. Considering the restoration problem of instantaneous distorted images, this paper presents an image restoration method based on structured light and local approximate registration. This scheme first constructs a cross-media imaging model based on structured light and uses this model to simultaneously capture the distorted structured light image and the distorted scene image. On this basis, a method based on local approximate registration is proposed to restore the distortion-free image. Compared with previous methods, the proposed method only needs a simple projection device and one frame of distorted scene image to reconstruct a distortion-free scene, which can better meet the needs of real-time processing.
2 Materials and Methods
2.1 Image Formation Through Wavy WAI
As shown in Figure 1, when the water surface is calm, the scene point captured by pixel is . But, as WAI is fluctuating, the intersection angle between the back-projected ray (which originates from point and passes through the optical center ) and the wave surface changes. This results in the deflection of the back-projected light above the sea surface, at this time, pixel will image scene point instead of . As a result, variations in the sea surface cause changes in the pixel location of the visual scene.
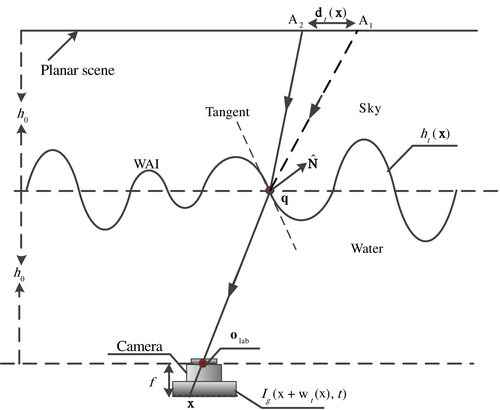
Equation (3) shows that, due to the spatial difference in the height distribution of the WAI, different pixels may experience different displacements. This explains why the image exhibits complex geometric distortion.
2.2 Cross-Media Imaging Model Based on Structured Light
To quickly restore images distorted by surface waves, This paper first constructs a cross-media imaging a model based on structured light, which takes into account the underwater optical transmission characteristics of blue–green light and uses the characteristic point information of structured light to realize the sampling of instantaneous wavefront. As shown in Figure 2, the system model includes a structured light projection system S and a passive imaging system V, wherein component S is composed of a projector, a diffuser, and a camera s, and component V is composed of an underwater observation camera v. Consistent with our previous research [23], the system first obtains the distorted structured light image through the structured light projection system and obtains the aerial scene image passing through the same sampling area in real time through the passive imaging system. The specific process is as follows.
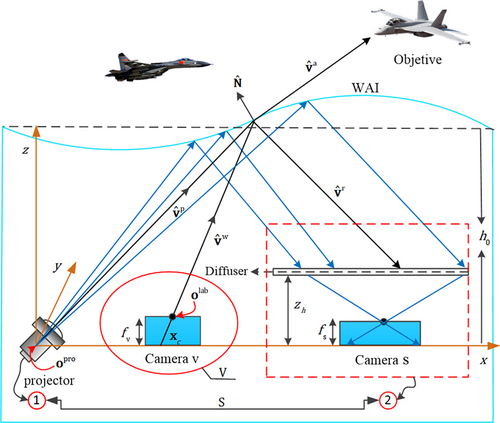
As shown in Figure 3, an adaptive and adjustable structured light pattern is projected onto the water surface to sample the instantaneous wave surface. When the water surface is calm, the WAI sampling point distribution, the corresponding control point distribution in the scene image, and the distribution information of the corresponding feature points in the reference structured light image can be easily obtained by perspective projection transformation from the feature point information of the structured light pattern. The above information is generally implemented through a full computer simulation process and used as the system initialization parameter. The simulation example of WAI sampling is shown in Figure 3, where Figure 3a is the preset structured light pattern, Figure 3b is the WAI sampling point distribution, Figure 3c is the corresponding control point distribution in the scene image, and Figure 3d is the corresponding feature point distribution in the reference structured light image, where the control points correspond to the feature points one by one, and their corresponding light rays all pass through the same sampling point on the wave surface.

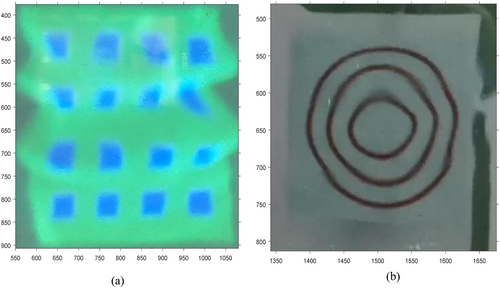
In actual scenes, the random fluctuation of the water surface will cause the structured light image on the diffusion plane and the aerial target scene image to be distorted. At this time, the distorted structured light image and the distorted scene image are simultaneously acquired through the camera, where the camera s acquires the distorted structured light image from the diffusion plane, and the camera v acquires the distorted scene image through the same sampling area. The instantaneous distorted image acquired by the underwater air imaging platform described in Section 3.3.1 is shown in Figure 4, where Figure 4a is the distorted structured light image on the diffusion plate, and Figure 4b is the aerial scene image through the same sampling area. As can be seen from the figure, the random fluctuation of the water surface causes serious geometric distortion of the structured light image and the scene image.
2.3 Image Restoration Using Local Approximate Registration
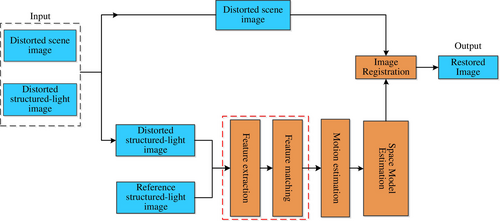
Based on the above model, this paper further proposes an image restoration method based on local approximate registration, and the algorithm flow is shown in Figure 5. The core idea of the algorithm is to use the feature point information on the reference structured light image and the distorted structured light image, estimate the spatial transformation model of the scene image in real time through the local approximate registration algorithm, and finally reconstruct the distortion-free scene image through the bi-linear interpolation algorithm.
2.3.1 Feature Extraction and Matching
- Target image extraction and binarization. First, use the Sobel edge detection algorithm to obtain the contour information of the original image; then search for the largest connected domain in the image as the target image, and finally binarize the target image.
- Region segmentation. The connected domain algorithm (eight-connected) is used to segment the image into regions to obtain multiple locally connected domains and mark them.
- Centroid extraction. Based on region segmentation, use the spatial torch function to calculate the centroid coordinates of each connected domain.
- Sub-region segmentation. Traverse the pixel points of each connected domain, and then divide the connected domain into n sub-regions according to the centroid coordinate position and standard structured light shape features, where n is the number of sides of the polygon.
- Corner point extraction. According to the Euclidean distance formula, search for the pixel point with the farthest distance from the sub-contour set of each connected domain to the centroid, which is the corner point.
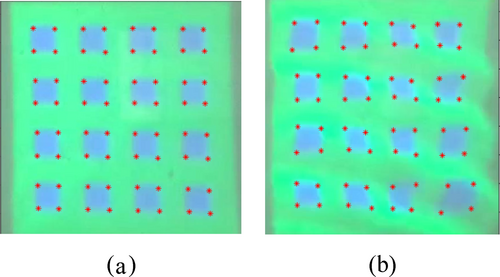
The image processed by the corner detection algorithm is shown in Figure 6, where Figure 6a shows the feature point distribution of the reference image and Figure 6b shows the feature point distribution of the distorted image. Subsequently, the bubble sort method is used to match the feature points of the two images respectively. Assuming that the size of the feature point matrix is , the feature point matrix is updated column by column through bubble sorting. The specific process is as follows: First, a candidate matrix of size is constructed to update the feature point coordinates of the column in the matrix , where is composed of the feature points of the and columns of the matrix. Then, the feature points of the matrix are arranged in ascending order according to the row values of the feature points to obtain a vector of size . Subsequently, the vector is divided into subsets from smallest to largest. Finally, the feature point with the smallest column value is selected from each subset as the sorting result of the column, and the matrix is updated.
2.3.2 Distortion Estimation of Scene Images
It is widely recognized that light radiation traversing the sea surface undergoes angular deflection due to the impact of surface undulations. As a result, the deviation between any two arbitrary light rays intersecting at the same location on the WAI is interrelated. Inspired by this, this section analyzes the displacement relationship between the corresponding points of the structured light image and the scene image from the perspective of geometric optics.
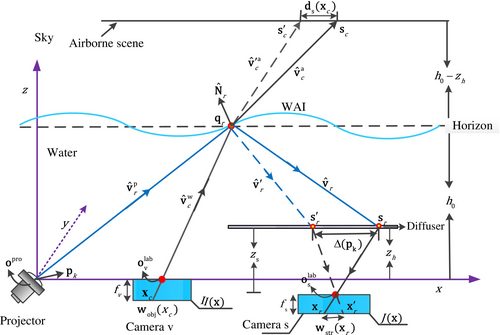
Specifically, the displacement transformation relationship can be constructed using a polynomial representation method. First, based on the displacement model from Equation (19), the normal vectors of the wavefront sampling points under different slopes are computed, and the mapping values of multiple sets of displacement vectors and are determined. Then, the transformation function F can be constructed using polynomial fitting.
Among then and represent the fit's order. and denote the relative coefficients.
Finally, combining Equations (5), (9), (15), and (23), the displacement field of any objective image can be obtained employing the distortion field of the structured-light image which is be captured at the same moment.
2.3.3 Image Restoration
Given the 2D distortion vector field on both the warped and ground-truth images or the spatial transformation model between the two images, it is easy to obtain the desired image by interpolating for the instantaneous distorted image [28].
Finally, according to the spatial model shown in formula (31), the undistorted scene image is restored using the bi-linear interpolation method. The complete process of the local approximate registration method is described in Algorithm 1.
ALGORITHM 1. Image Restoration Algorithm Based on Local Approximate Registration.
Input: Reference structured light image .
Distorted structured light image .
Distorted scene image .
Output: No-distortion scene image .
1. Feature extraction and matching
2. Distortion estimation of the control points
3. Local approximation registration
4. Bilinear interpolation
3 Results and Discussion
In order to verify the performance of the algorithm, this paper first conducted a simulation test on MATLAB and compared it with similar algorithms. Second, a simplified cross-media imaging platform was built in the laboratory, and a camera was used to collect aerial target scene images and distorted structured light images through the fluctuating water surface in real time. Then, the real data collected by the experimental platform was used to test it on MATLAB. The data can be obtained from [31]. Finally, a real image sequence of a certain length was used to test and analyze the stability of the algorithm. In addition, this section also conducted a real-time processing test on the algorithm in OpenCV and gave the test results.
3.1 Image Quality Metrics
In order to objectively evaluate the distortion correction capability of the algorithm, this chapter uses four standard image quality evaluation indicators to quantitatively analyze the correction results of the algorithm, namely, peak signal-to-noise ratio (PSNR) [32], mean square error (MSE) [21], gradient magnitude similarity deviation (GMSD) [33], and structural similarity (SSIM) [34]. Among them, the larger the PSNR, the richer the real information of the restored image and the better the image quality. The smaller the MSE, the better the image quality. GMSD indicates the degree of difference in structural information between images. The smaller the value, the higher the similarity of edge details between the two images. The larger the SSIM value, the higher the similarity between the two images in brightness, contrast, and structure.
3.2 Algorithm Simulation Analysis
The simulation model is shown in Figure 2. Simulation parameters includes: , , , the relevant attributes of the projector, cameras, and camera v are given in [23]. Furthermore, in order to simulate the movement of ocean waves, this paper uses spectral theory to numerically simulate the wavy water surface with a wind speed of 1.0 m/s. Research shows that using spectra to describe ocean waves is one of the most effective methods.
Assuming a checkerboard is placed at the height , the underwater camera images the checkerboard through the WAI. Subsequently, a local approximate registration method is adopted to reconstruct the distortion-free scene image using the 2D distortion field of the distorted scene image.
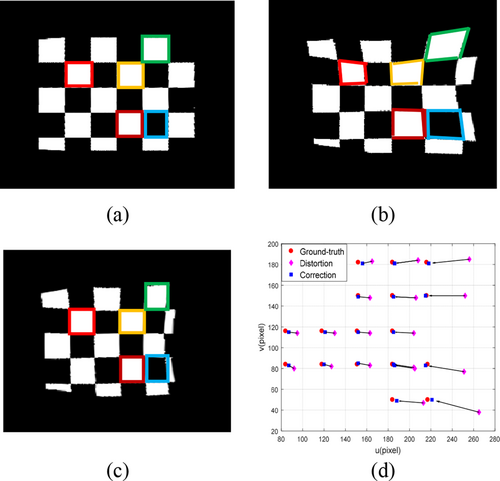
The restoration results of the sampled image at any time are shown in Figure 8, where the image size is . Figure 8a is the ground-truth scene image, Figure 8b is the distorted scene image, and Figure 8c is the restored image. Furthermore, the corner point position distribution of the color-coded checkerboard in Figure 8a–c is depicted in Figure 8d. Among them, the corner point locations in the distorted image have a standard deviation (STD) of 24.3311 pixels, whereas the STD of the recovered image, which was obtained using the proposed method, is 2.4698 pixels. The error elimination rate reached 89.84%. Simulation results show that the algorithm proposed in this paper can significantly eliminate image distortion in cross-media imaging scenes and improve the visual effect of the image.
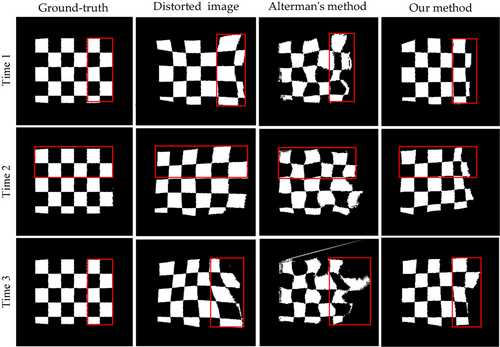
First, the correction results of the proposed algorithm are compared with those of a similar algorithm, namely, the Alterman's method [16]. For the sake of fairness, the two methods are tested using the same simulation data. As can be seen from Figure 9, both methods have the ability to correct the distortion of cross-medium images. Compared with the original images, the distortion of the images processed by the two algorithms is significantly reduced, and their edge details are closer to the real scene. From the perspective of the distortion correction effect, the Alterman's method still has a large deviation in the correction of local details, while the proposed method has a better correction effect, as shown in the red box. From the data in the Table 1, it can be seen that compared with the Alterman's method, the images processed by the proposed algorithm perform better in terms of performance indicators such as PSNR, SSIM, and MSE, indicating that the proposed method has a stronger ability to correct underwater image distortion.
| Distorted image | Alterman's [16] | Our method | |
|---|---|---|---|
| Data 1 | |||
| MSE (L) | 0.1393 | 0.0520 | 0.0409 |
| PSNR (H) | 8.5597 | 12.8389 | 14.1328 |
| SSIM(H) | 0.5584 | 0.6814 | 0.7004 |
| Data 2 | |||
| MSE (L) | 0.1215 | 0.0441 | 0.0394 |
| PSNR (H) | 9.1535 | 13.5571 | 14.2596 |
| SSIM(H) | 0.5660 | 0.6784 | 0.7066 |
| Data 3 | |||
| MSE (L) | 0.0910 | 0.0514 | 0.0429 |
| PSNR (H) | 10.4074 | 12.8878 | 14.6756 |
| SSIM(H) | 0.6127 | 0.6270 | 0.7070 |
3.3 Test Using Real Through-Water Scenes
3.3.1 Experiment Setup
In order to further test the effectiveness of the algorithm in real imaging scenarios, we first established a cross-media imaging system platform in the laboratory, as shown in Figure 10. Figure 10a is the real experimental scene, and Figure 10 is a schematic diagram of the experimental setup. The setup includes an acrylic water tank (dimensions: cm), with a projector positioned to the left at a height of zero from the tank's base, accompanied by a diffuser plate and a camera. The system is engineered to photograph both the diffusion plane and the airborne scene, utilizing a single camera to simultaneously capture both areas for operating efficiency. In the experiment, Zhang's calibration technique [35] was utilized to calibrate the parameters of both the projector and the camera. The system's relevant parameters are as follows: the projection angle of the projector is , the average water depth of the system is the system height of the diffusion plate is , and the target scene is located 1.6 m above the water surface.
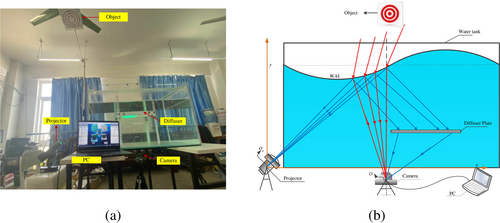
In the experiment, artificial waves were used to simulate real water surface movement; that is, the water surface was stirred vigorously to generate surface waves and then left to stand for 1 min, thus forming a natural oscillation phenomenon. Then, a camera was used to simultaneously capture structural-light images on the diffusion plate and the airborne scene image.
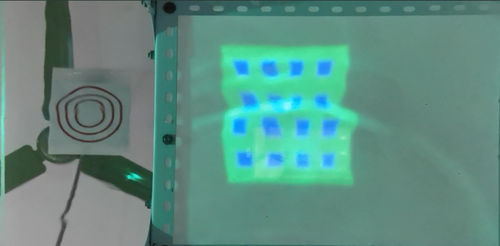
Figure 11 displays a randomly sampled image consisting of two parts: structured light on diffuser and distorted landscape above water. Both navigate the identical expanse at the water's surface. Figure 11 illustrates that water surface oscillations induce significant refraction distortion, adversely impacting the underwater observer's ability to track and identify airborne subjects.
3.3.2 Image Processing
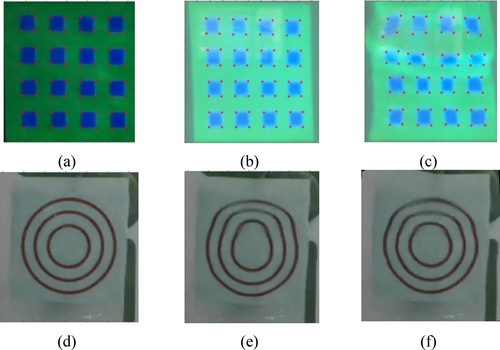
The image processing process is shown in Figure 12, which is divided into three stages: system initialization stage, data acquisition stage and data processing stage. The task of the system initialization phase is to complete the sampling of the wave surface (as shown in Figure 12a) and obtain the reference structured light image (as shown in Figure 12b).During the data acquisition stage, the camera collects distorted scene images and distorted structured light images in real time, as shown in Figure 12c and Figure 12d. In the data processing stage, the characteristics of the structured light image are first extracted and matched. The distortion field of the control points on the target picture can be computed using the displacement transformation relationship. Ultimately, the local surface fitting method is employed to rectify the picture distortion, resulting in the generation and output of the processed image, as illustrated in Figure 12f.
3.3.3 Image Quality Analysis
In order to test the effectiveness of the algorithm, we first use real scene data for analysis. The data is collected by the underwater air imaging platform described in Section 3.3.1. The target scene is “concentric circles”. The data is stored in the form of video sequences and has been shared in the literature [31]. Sampled images at different times are randomly selected from the real scene sequence for testing, where the target scene image size is .
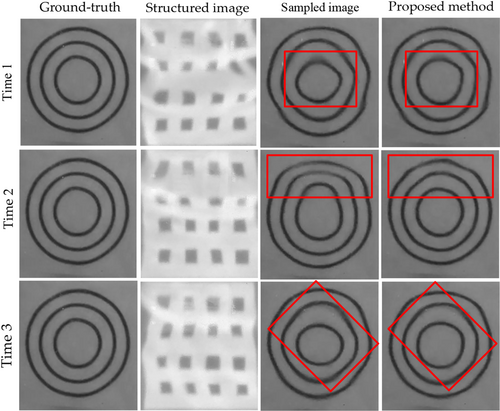
As can be seen from Figure 13, the proposed method can effectively compensate for the random distortion of the cross-media imaging scene, the distortion of the target image is significantly reduced, and the contour details are closer to the real scene. As shown in the red box in the figure, the distortion of the concentric circles is effectively reduced after processing, and the real shape of the target image is closer to the real scene, which improves the visualization of the image. Table 2 gives the numerical results of the distorted image and the restored image. Compared with the distorted image, the restored image has significant improvements in performance indicators such as PSNR, MSE, and SSIM, which prove the effectiveness of the algorithm in the distortion compensation process of instantaneous distorted images.
| SSIM | MSE | PSNR | ||||
|---|---|---|---|---|---|---|
| Samples | Ours | Samples | Ours | Samples | Ours | |
| Time 1 | 0.7702 | 0.8749 | 0.0051 | 0.0022 | 22.8897 | 26.8138 |
| Time 2 | 0.6978 | 0.8878 | 0.0076 | 0.0018 | 21.2091 | 27.4072 |
| Time 3 | 0.7606 | 0.8772 | 0.0055 | 0.0020 | 22.6351 | 27.0769 |
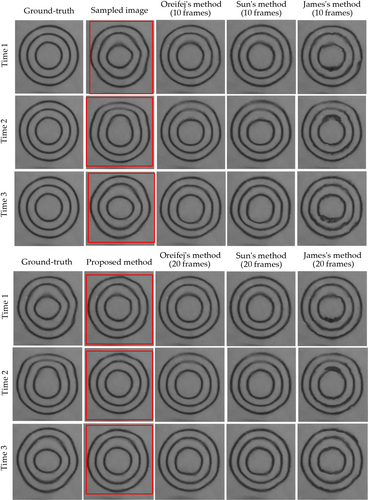
In order to more comprehensively evaluate the performance of the algorithm and its application scenarios the restoration results are compared with other advanced methods, including Oreifej's method [6], James' method [9] and T. Sun's method [10]. Unlike the proposed method, the above methods all require a video sequence of a specific length to complete the reconstruction of the distorted scene, while the method in this paper only requires a single frame input image. For the sake of fairness, considering the restoration results of the sampled images at the same time, first, with the sampled frame at a specific time as the center, a certain length of image sequence is selected forward or backward as the input parameter of the other three methods, and then the restoration results of the corresponding frames are compared with the proposed method.
All methods were tested using the same source data [31]. The maximum number of iterations for Oreifej's method and T.Sun's method was set to 3 (after three iterations of the source data [31], the results have stabilized). The block size in the corresponding sequence of T. Sun's method is . In addition, in order to statistically compare the real-time processing efficiency of different methods, all methods were executed on the same computer, where the system operating environment is: CPU (i7-6700HQ), RAM (8 GB), MATLAB2018b.
Figure 14 shows the recovery results of the proposed method and the state-of-the-art methods. Oreifej's method, T. Sun's method and James' method use image sequences of 10 and 20 frames, respectively, to reconstruct the sampling frames, while the proposed method only processes the distorted image at the current moment. Table 3 shows the numerical comparison results of the restored images under different methods.
| Methods | GMSD | SSIM | PSNR | Time (s) | |
|---|---|---|---|---|---|
| Time 1 | |||||
| Ours | 0.1568 | 0.8749 | 26.8138 | 1.4370 | |
| Oreifej's | 0.1419 | 0.8890 | 27.5162 | 141.1623 | |
| T. Sun's | 0.1607 | 0.8677 | 26.1908 | 167.5526 | |
| James's | 0.1674 | 0.8596 | 25.9702 | 9.0383 | |
| Oreifej's | 0.1274 | 0.9028 | 28.3086 | 349.6122 | |
| T. Sun's | 0.1397 | 0.8898 | 27.2052 | 341.5579 | |
| James's | 0.1545 | 0.8739 | 26.5241 | 11.0007 | |
| Time 2 | |||||
| Ours | 0.1492 | 0.8878 | 27.4072 | 1.4382 | |
| Oreifej's | 0.1430 | 0.8883 | 27.3552 | 177.2077 | |
| T. Sun's | 0.1514 | 0.8779 | 26.5544 | 168.7399 | |
| James's | 0.1711 | 0.8591 | 25.5864 | 3.4897 | |
| Oreifej's | 0.1658 | 0.8690 | 26.1154 | 350.2627 | |
| T. Sun's | 0.1694 | 0.8582 | 25.5472 | 339.0449 | |
| James's | 0.2017 | 0.8271 | 24.2426 | 6.4821 | |
| Time 3 | |||||
| Ours | 0.1570 | 0.8771 | 27.0769 | 1.4363 | |
| Oreifej's | 0.1710 | 0.8549 | 25.4536 | 177.7958 | |
| T. Sun's | 0.1911 | 0.8262 | 24.3011 | 182.5569 | |
| James's | 0.1761 | 0.8543 | 26.2393 | 3.5057 | |
| Oreifej's | 0.1395 | 0.8904 | 27.9088 | 351.2541 | |
| T. Sun's | 0.1661 | 0.8615 | 26.1695 | 362.3698 | |
| James's | 0.1620 | 0.8738 | 26.8630 | 4.9811 |
As can be seen from the figure, all methods can effectively suppress the refraction distortion caused by water waves, reduce the degree of image distortion, and improve the visual effect of the image, which shows the effectiveness of the above algorithms. Intuitively, the visual effects of Oreifej's method and Sun's method are the best, but in numerical analysis, it is found that their correction accuracy is not optimal. The main reasons are: (1) the image sequence is not long enough; (2) the inter-frame difference of the test sequence is large. The above reasons will affect the reconstruction quality of the reference frame, thereby affecting the image registration accuracy. The correction result of James's method is closer to the real image in terms of graphic contour, but there are still a lot of local distortions in the image and it is accompanied by motion blur. This is related to the fact that this method only considers image distortion caused by periodic waves. In addition, the periodic assumption of James's method requires that the length of the image sequence is long enough to fully guarantee the periodic characteristics of the water surface fluctuations, which means that the algorithm cannot reconstruct high-quality results through short video sequences (e.g., the restoration effect of 10- and 20-frame image sequences is not ideal). Unlike the above methods, the algorithm in this chapter can restore a distortion-free image through a single frame image. From the correction results and data, we can see that the algorithm in this chapter not only significantly reduces image distortion but also has better stability. The reason is that the local approximate registration and interpolation method can better estimate the local changes of the scene image, thus obtaining a stable output result.
From the perspective of distortion correction efficiency, the processing speed of the proposed method is significantly better than other methods. Taking random sampling time 1 as an example, in order to reconstruct the distortion-free scene, Oreifej's method takes a total of 141.1623 s using 10 frames of data. T. Sun's method takes 167.5526 s using 10 frames. James' method takes 9.0383 s using 10 frames. Our method only takes 1.4370 s, which effectively reduces the image processing delay and improves the image processing efficiency.
In summary, compared with other methods, the proposed method can not only reduce image distortion and improve the visualization of the image, but also is significantly better than other methods in terms of computational efficiency, realizing an “end-to-end” processing process.
3.3.4 Robustness Analysis
In order to test the stability of the algorithm, 120 frames of sampled images were randomly selected from the test scene sequence [31] and processed on MATLAB, and the measurement indicators (including SSIM, MSE, PSNR, and Times) were statistically averaged. Then, the real-time processing process of the algorithm was implemented on OpenCV, which included three stages: data acquisition, data processing, and result display, and the real-time processing time was calculated. The robustness analysis results of the algorithm are shown in Table 4.
| SSIM (H) | GMSD (L) | PSNR (H) | Time (L)/s (MATLAB) | Time (L)/s (OpenCV) | |
|---|---|---|---|---|---|
| Sampled frames | 0.7903 | 0.2148 | 23.3990 | — | — |
| Proposed method | 0.9028 | 0.1314 | 28.5695 | 0.8978 | 0.6000 |
As can be seen from Table 4, compared with the distorted image, the results of the proposed method have obvious improvements in performance indicators such as SSIM, GMSD, and PSNR. The image is closer to the real image in terms of brightness, contrast and similarity, with richer edge detail information, less image noise, and significantly improved image quality. From the perspective of real-time processing performance, the image processing time of the proposed method is 0.6 s, realizing the “end-to-end” processing process of a single frame image, which can be better applied to dynamic target monitoring scenarios.
4 Conclusions
This work introduces an innovative model that employs structured light projection technology for real-time water surface measurement and proposes a distortion-free image reconstruction and restoration method based on local approximate registration. The method begins by using structured light to capture the real-time water surface. It then employs feature points from the structured light image to calculate the deformation vector field of the corresponding sampling points of the distorted scene. Finally, a local approximate registration is employed to reconstruct an image free from distortion. Experimental results show that the proposed method can not only reduce image distortion and improve image visualization, but also has significantly better computational efficiency than the state-of-the-art methods.
As can be seen from Section 2.3.3, the restoration accuracy of the image is directly related to the wavefront sampling interval; that is, the smaller the sampling interval, the higher the image restoration accuracy. However, when the water surface fluctuation increases, a small sampling interval is prone to cause sampling point aliasing problems, which will reduce the image restoration effect. Therefore, in the future, we will further carry out research on adaptive and adjustable structured light projection technology.
Author Contributions
Bijian Jian: conceptualization, methodology, software, validation, writing – original draft. Ting Peng: project administration, funding acquisition, writing – review and editing. Xuebo Zhang: data curation. Changyong Lin: validation.
Acknowledgments
This research was funded by Guangxi Natural Science Foundation projects (2024JJA170158) and (2025GXNSFAA069222), Hezhou University Doctoral Research Start-up Fund Project (2024BSQD10), Guangxi Young and Middle-Aged Teachers' Basic Research Ability Improvement Project (2024KY0715) and Hezhou University Interdisciplinary and Collaborative Research Project (XKJC202404).
Conflicts of Interest
The authors declare no conflicts of interest.
Open Research
Data Availability Statement
The data that support the findings of this study are openly available in (repository “figshare”) at https://doi.org/10.6084/m9.figshare.28091540.v2, reference number [31].


