Identification, Detection, and the Enhanced Removal Mechanism of DDT From Aqueous Solutions Using Facile Green Synthesis of Carbon Quantum Dots
Funding: The authors received no specific funding for this work.
ABSTRACT
Dichlorodiphenyltrichloroethane (DDT) pollution is an ongoing worldwide environmental hazard due to its persistence and detrimental impact on ecosystems. Carbon quantum dots (CQD) made from dried mushroom biomass using a sustainable and eco-friendly synthesis process are investigated in this work as a potential new approach to dealing with DDT contamination. Verifying their efficient synthesis and potential for photocatalytic applications, the CQD had their structural, optical, and chemical characteristics evaluated. Methods such as energy-dispersive x-ray spectroscopy (EDS), Fourier-transform infrared spectroscopy (FT-IR), scanning electron microscopy (SEM), and transmission electron microscopy (TEM) were used to make this evaluation. Through photocatalytic tests, we looked at how well CQD produced from mushrooms decomposed DDT when exposed to UV light. The optimal conditions for photocatalytic degradation, including CQD dose, starting DDT concentration, time, and pH, were determined by a thorough investigation. Based on the results, the ideal reaction parameters were found to be a pH range of 3–5, a catalyst concentration of 2 g/L, and a reaction period of 1 h at room temperature, all of which led to a 91.70% degradation rate in DDT. The photocatalyst's stability and recyclability were tested, proving that the CQDs have long-lasting properties that may be used in many applications. The proposed method offers an effective approach for eliminating DDT while also fulfilling the requirement for sustainable and environmentally friendly materials in remediation technologies. This study enhances the developing area of photocatalytic remediation and highlights the adaptability of CQDs as highly promising and eco-friendly substances for eliminating persistent organic contaminants like DDT.
Abbreviations
-
- BCF
-
- bioconcentration factors
-
- CQD
-
- carbon quantum dots
-
- DDE
-
- 1-dichloro-2,2-bis(p-chlorophenyl) ethylene
-
- DDT
-
- dichlorodiphenyltrichloroethane
-
- DDTR
-
- breakdown products of DDT
-
- EDS
-
- energy-dispersive x-ray spectroscopy
-
- EPA
-
- Environmental Protection Agency
-
- FT-IR
-
- Fourier-transform infrared spectroscopy
-
- NTR
-
- national toxics rule
-
- OCP
-
- organochlorine pesticides
-
- SEM
-
- scanning electron microscopy
-
- TEM
-
- transmission electron microscopy
1 Introduction
In the modern world, consuming safe and clean water is crucial, and the majority of India's potable water has traditionally come from either surface or groundwater sources. Under appropriate environmental conditions, sediments have the potential to undergo conversion or partial degradation of chlorinated pesticides and chlorinated organics. The breakdown product of DDT, 1,1-dichloro-2,2-bis(p-chlorophenyl) ethylene (DDE), is often found in the environment, in contrast to the long-term environmental persistence of DDT. DDE exhibits resistance to many biotransformation routes [1]. A variety of processes, including sorption, bioaccumulation, dissolution, and volatilization, may aid in the transfer of DDT and its breakdown products from one medium to another. DDT has a strong affinity for suspended particles and sticks to them, but DDE, the primary result of metabolism, is very weakly soluble in water. The compound's associated particles are transported along the primary route of dispersion. If we want to find effective ways to fix DDTR, we need to know where it is going and how it is getting there based on its unique characteristics. Organochlorine pesticide dichlorodiphenyltrichloroethane (DDT) is often found in water. Numerous more names for it exist, such as p,p′-DDT, 4,4′-DDT, and 1,1,1-trichloro-2,2-bis [p-chlorophenyl] ethane [2]. Microbes play a major role in the final breakdown of DDT and its metabolites, which are resistant to light and persistent in the environment, even if photochemical destruction is potential. Compared to temperate regions, tropical regions have a much lower DDT. Soils and sediments may store DDT and its metabolites for a long time because of their strong adsorption affinity. The majority of DDT that finds its way into water is strongly bound to soil particles because of how readily it can be adsorbed onto surfaces [3, 4]. Through a procedure for analysis using gas chromatography with electron capture detection, DDT and its metabolites may be identified in water. At concentrations of 60 ng/L for p,p′-DDT, 10 ng/L for p,p′-dichlorodiphenyltrichloroethane, and 2.5 ng/L for p,p′-DDT the levels of detection may be established. Degradation of water quality owing to numerous pollutants has been caused by human exploitation, which includes industry, urbanization, agricultural runoff, treated and untreated municipal waste, and many forms of industrialization. contamination of water sources by various pollutants is a significant issue. There are several dangerous compounds that are released into the environment by municipal discharge, including heavy metals, pesticides, industrial chemicals, surfactants, and agrochemicals. One type of pesticide commonly used in farming and public health initiatives is known as organochlorine pesticides (OCP), which are synthetic [5]. The main difficulties with OCP are their increased toxicity, prolonged breakdown process, and bioaccumulation. Its uses in agriculture and public health are steadily polluting water sources, including drinking water and the water table. The worldwide epidemic of contaminated drinking water has recently emerged as a critical issue in public health policy. Among the many types of pesticides, organochlorines stand out as a major category of persistent organic pollutants and a major cause for worry. These compounds are very resistant to immediate degradation due to their bioaccumulation, lengthy half-life, and lack of polarity. OCPs are extremely toxic, persist for prolonged periods, and feature the capacity to build up in organisms [6, 7]. Agricultural OCP use and the cleaning of spraying equipment both contribute to a rise in OCP levels in water sources due to improper OCP handling. On top of that, OCPs may get into our water supply via a variety of means, including drainage water, airborne transmission, surface runoff, soil penetration, and the dumping of previously empty containers. The use of OCP has been linked to numerous health problems, both in terms of the environment and occupation. These include chronic kidney diseases, ovarian cancer, breast cancer, and premature birth. Negative impacts on human health and disruption of ecological balance are caused by both the overuse of OCP and the existence of their remnants. The main ways in which humans come into contact with these chemicals are through polluted drinking water, food, soil, and air. India remains the sole nation engaged in the production of the pesticide DDT [8, 9]. The sole manufacturer of DDT in India is the public sector company Hindustan Insecticide Limited (HIL). DDT is manufactured specifically to prevent and treat malaria and a parasitic infection called visceral leishmaniasis. The human central nervous system is mainly impacted by brief exposure to large amounts of DDT. Unintentional ingestion in humans has led to increased excitement, shaking, and convulsions. In addition to harming the nasal passages, throat, and eyes, being exposed has also caused skin rashes or discomfort. Liver enzyme activity has been altered by chronic exposure to low doses of DDT. Research conducted on animals in a controlled environment has further substantiated the impact on the nervous system [10]. Additionally, it has revealed a higher rate of liver tumor development as well as reproductive difficulties. The EPA implemented the National Toxics Rule (NTR, 40) in 1992. Ensuring that states adhere to the Clean Water Act was the goal of this rule, which set out explicit standards for water quality for all prioritized contaminants. Even though drinking water is thought to have very low levels of DDT exposure for people, the standards for human health were established based on acceptable levels of ingesting fish and water [11, 12]. Before the year 2000, when eating fish would be restricted, the Food and Drug Administration (FDA) established a limit of 5 mg/kg for DDT in fish. Fisheries impact assessments were governed by rules established by the EPA in 2000. In 2001, the Mississippi Department of Environmental Quality declared that consumption of fish should be limited if DDT levels were higher than 1 mg/kg. To maintain a one-in-a-million lifetime cancer risk, the acceptable values of 4,4′-DDE and 4,4′-DDT in fish tissue are 32 ng/g. The same holds true for fish tissue: 45 ng/g is the lowest permissible concentration of 4,4′-DDD. The NTR used a bioconcentration factor of 53,600 in order to convert certain component concentrations that are acceptable for tissue to water regulations. The standards for 4,4′-DDE and 4,4′-DDT are set at 0.59 ng/L, whereas the requirements for 4,4′-DDD are 0.83 ng/L [13, 14].
DDT has a strong toxicity toward numerous species of aquatic invertebrates. The LC50s, which are the concentrations that cause 50% of the test subjects to die within 96 h, vary between 0.18 and 7.02 μg/L in different aquatic invertebrates such as stoneflies, midges, crayfish, and sow bugs. In daphnids, the LC50 (concentration at which 50% of the population dies within 48 h) is 4.70 μg/L, while for sea shrimp it is 15.15 μg/L. Fish species are also greatly impacted by the high toxicity of DDT. The results showed that the specific lower limit of detection (LC50) values were less than 10 μg/L for largemouth bass, coho salmon, rainbow trout, and bluegill sunfish, with the corresponding values being 1.50, 8.75, 4.02, and 8.61 μg/L. The fathead minnow's and channel catfish's LC50 values, according to the data, were 21.50 μg/L and 12.20 μg/L, respectively [15, 16]. For several amphibian species, DDT exhibits moderate toxicity; the larvae are more susceptible than the adults [15]. DDT exposure may be persistent and continuous in fish and other aquatic species due to its propensity for large accumulation. The main cause of this is the absorption of water and sediments by aquatic plants and animals. It was shown that rainbow trout need around 160 days to completely eradicate DDT, as stated in [17].
Studies show that DDT may build up in a broad range of organisms, including terrestrial animals like fish, birds, and mammals, as well as aquatic ones like phytoplankton and zooplankton. The bioconcentration factors (BCF) for DDT and DDE in aquatic species ranged from 3.08 to 6.65 and 4.80 to 5.26, respectively, according to laboratory studies [18]. The ATSDR states that the BCF of DDT in rainbow trout is over 12,000, whereas it is anticipated to be over 1650 in humans. Research conducted in northern Canada revealed that organisms inhabiting the ocean depths exhibited significantly greater amounts of overall DDT compared to organisms living in the open sea. The ring-necked seal, by biomagnifying DDT, indicates the possibility of other species experiencing biomagnification too [19]. Researchers have shown that when DDT travels from sediment to mosquito fish, its concentration tends to grow. Additionally, studies conducted in Lake Michigan have shown that the concentrations of DDE increase 21-fold in sediments compared to amphipods and 28.7-fold in phytoplankton. Agriculture in the Ganga River basin makes use of a wide variety of pesticide formulations, numbering in the hundreds. According to a study by Shah and Parveen [20], it is approximated that more than 9000 MT of pesticides are used every year in agricultural activities within the Ganga River basin. Gas chromatography–mass spectrometry was used to analyze the pesticide content of water samples collected from each station after liquid–liquid extraction. The results showed that the maximum amounts of p-DDT, p,p'-DDT, Champanala, and Mond ghato were, respectively, 125.20 and 112.05 ng/L.
This work investigated the adsorption of DDT in aqueous solutions using carbon quantum dots (CQD). Because of their special optical properties, CQD are very well suited for a variety of sensing applications. There are an infinite number of natural sources from which these remarkable CQD may be produced. In this particular study, edible mushrooms were successfully used to generate fluorescent CQD by a simple hydrothermal technique with the use of diluted sulfuric acid. Carbon nanoparticles smaller than 10 nm are called carbon quantum dots, or CQD. Their distinct chemical, optical, and electrical qualities have attracted a lot of attention lately [21]. The production of CQD from natural sources is a promising area of research since it provides an economically and ecologically sustainable alternative to synthetic methods.
The development of CQD has been very beneficial to the area of nanotechnology (Figure 1). Scientists can now precisely regulate the size, form, and content of CQD thanks to a variety of procedures they have developed to make them artificially. These developments have opened up new avenues for the creation of customized materials with desired properties and allowed for the investigation of fundamental quantum processes [22].

CQD are appealing for usage in a variety of applications due to their intriguing array of features. Their ability to glow at night is one of their most remarkable characteristics. CQD are perfect for applications in bioimaging, biosensing, and optoelectronics because they generate intense and steady fluorescence [23]. Additionally, CQD are low in toxicity and have great biocompatibility, making them appropriate for usage in biomedical applications. Furthermore, they are attractive candidates because of their tiny size, which facilitates effective cellular absorption. It is fresh knowledge that mushrooms may be used as a carbon source for the synthesis of CQD, according to a number of studies. The highest abundance of phenolic chemicals, flavonoids, polysaccharides, lipids, and protein in mushrooms makes them ideal for producing CQD with a lot of heteroatoms on their surface. This is crucial to obtaining a high quantum yield [24]. In this work, the edible mushroom species Agaricus bisporus was used as the carbon source for the microwave-assisted synthesis of CQD. Numerous methods, including scanning electron microscopy (SEM), Fourier transform infrared spectroscopy (FT-IR), and x-ray diffraction (XRD), were used to examine the properties of the CQD. In addition, UV–Vis absorption tests and photoluminescence spectrum analysis were performed on the CQD.
2 Materials and Methodology
2.1 Reagents
All of the chemicals were used without further purification since they were easily obtained from the market and laboratory grade. We bought the mushrooms from a street vendor. The mushrooms are left to air dry after being thoroughly washed with distilled water. Dried mushrooms are pounded into a fine powder and used to make the CQD. Vital Scientific Chemicals, Perungulathur in Chennai, Tamil Nadu, India, is where we bought hydrogen peroxide (30%), nitric acid, and hydrochloric acid (HCl). Glassware was procured from Varma Scientific Company, Pallikaranai in Chennai, Tamil Nadu, India. All glassware used was cleaned and rinsed with deionized water and dried in an oven before use.
2.2 Preparation of Mushroom Extract
Fifty milliliters of a 15% H2O2 solution and 50 mL of aqua regia solution were applied to 5 g of mushrooms for 10 min in an 800 W microwave oven. The unfiltered mixture was then spun for 30 min at 5000 rpm to separate the solids, and the liquid was then filtered into a fresh container. Gather the filtered extract and store it in a sanitized container. Reduce the heat and boil the extract until it thickens. Allow the extract to reach room temperature naturally. When it is time to utilize the mushroom extract for the synthesis of CQD, keep it in a dry, clean container [25]. The ultimate concentration of the CQD solution may be achieved by adjusting the concentration of the mushroom extract.
2.3 Synthesis of CQDs
Fifty milliliters of mushroom extract and 5 mL of H2SO4 were gradually added, stirring constantly, until the solution's pH reached 1–2. This process produced the CQD. This was followed by 2 h of preheating the mixture to 80°C. Stepwise addition of a 0.1 M NaOH solution was made until the pH reached 7, after 5 mL of the cooled liquid had been brought to room temperature. To get the contents to 80°C, one further hour was needed. The solution was stirred continuously until it became dark brown after 5 mL of a 0.1 M NaBH4 solution was added dropwise after it had cooled to room temperature. Using centrifugation at 5000 rpm for 30 min, the reaction mixture was separated to extract the CQD [26]. To remove any remaining contaminants, the collected CQDs were then repeatedly washed with ethanol and water.
2.4 Photocatalytic Tests
In a 1 L Pyrex flask, the typical photocatalytic experiment was carried out. The UV source was a germicide lamp with a peak wavelength of 254 nm and a spectral irradiance of 0.23 W/m2. The reactor was equipped with a cooling water jacket to keep the temperature within the allowed range of 25°C–31°C and avoid overheating during the reaction. An aqueous DDT solution was made by dissolving an acetone insecticide in distilled water and agitating it with water before performing the procedure. A weight percentage of 0.4% acetone was present in the aqueous phase. One gram of synthetic CQD was combined with 1000 mL of a water solution having a particular concentration of p,p′-DDT in each experiment. After 30 min of stirring, the mixture was exposed to light with oxygen. By using a 1 M NaOH solution, the reaction environment's pH was brought to 7 [27]. At regular intervals, we extracted duplicate samples using liquid–liquid extraction. After that, gas chromatography (GC) was used to examine the collected samples. In this study, the degradation products of the photocatalytic process were identified; however, their quantities were not measured since a number of intermediate intermediates were found in small quantities.
3 Results and Discussion
3.1 Characteristics of Carbon Quantum Dots
The morphology of CQD, as observed through SEM in Figure 2a, displayed clusters of small particles [28]. The prepared CQD had a spherical shape and was evenly distributed over the whole length, as seen in Figure 2b,c with no discernible aggregation at ambient temperature. The TEM micrographs in Figure 2c revealed crystallite size ranges up to 10 nm, which aligns with the estimates obtained from the XRD spectra's peak broadening in Figure 3. Additionally, by statistically analyzing around 100 nanoparticles, the corresponding particle-size histogram (Figure 2d) could be obtained. The statistical results showed that the average diameter of CQDs was 3.58 nm, with a size range of 1.4 to 3.6 nm. Consequently, the homogeneous energy and high pressure produced by the hydrothermal heating were likely responsible for the narrow size distribution and the lower average diameter.


Scherrer's formula was used to analyze the diffraction peaks of anatase (004) (101) and rutile (110), which were the highest intensity peaks, respectively, to determine the average particle size [29, 30]. Using a transmission electron microscope (TEM) outfitted with a JEM2002-FS equipment, the size distribution and structure of CQD were examined by randomly scanning locations on the TEM grid. CQD mono-dispersity was confirmed by the TEM images, which showed a uniform size distribution.
Dried carbon quantum dots (CQD) were used to show the functional groups on their surface using Fourier transform infrared spectra (FTIR-4100, JASCO, Japan). The FT-IR spectra of mushrooms revealed the presence of the CC, OH stretching, asymmetric CH2, carboxyl/carbonyl CO, and CH bending vibrations at 3396, 1742, 1597, and 1027 cm−1, respectively (Figure 4). It was mostly the presence of hydrocarbons that was indicated by the CH2 peaks in the FT-IR spectra. OH, CO, CC, (CH or CO), and CH were identified as the bending vibrations of the CQDs; in contrast, whose FT-IR spectra had prominent peaks at 3350, 1640, 1405, 1023, and 859 cm−1. While the bending peaks for the OH, CO, and CH surface moieties indicated their attachment to the CQD, the presence of a CC peak showed that the CQD had a graphitic structure [31, 32].

3.2 Adsorption of DDT
To determine the adsorption of DDT by CQDs, a parallel test was conducted by measuring the remaining DDT in the solution. One reactor was placed in the dark and the other was exposed to UV light for the test, which was conducted using synthetic water that contained 100 μg/L of DDT. The findings demonstrated that adsorption was almost finished in the first 10 min of the trial. By sampling the supernatant after the first 10 min of the batch testing, we were able to evaluate the photocatalytic elimination of DDT [20]. It is well established that temperature has no effect on the rate of photocatalytic oxidation. Some studies have shown that organic compound desorption from surfaces and charge carrier recombination are both enhanced at temperatures more than 80°C. On the other hand, adsorption works better at temperatures lower than 80°C. Room temperature was used for all of the experiments in this experiment. Based on the catalyst's use, photoreactors may be divided into two primary types: suspended systems and immobilized systems. Superior photocatalytic effectiveness of the suspended catalysts results in improved mass transfer in the suspended form [33].
3.3 Effect of Initial Concentration of Solution
The elimination efficiency was mostly dependent on the initial concentration. The figure shows that when the concentration increases, the tendency for elimination increases. The adsorption value reached its apex when the starting concentration of DDT reached 300 μg/L (Figure 5). The adsorption value eventually stabilizes as the starting concentration exceeds 300 μg/L. The removal rate drops due to competitive adsorption on the catalyst surface, which happens as the number of intermediates produced increases at higher initial concentrations [34].

3.4 Effect on Time
Figure 6 illustrates how time affects the elimination of DDT. The elimination percentage increases with time until it achieves a steady state after the equilibrium time. The elimination percentage increased rapidly at the very start of the first 30 min. The removal percentage reached its highest value after 60 min of adsorption, at which point the removal efficiency became saturated [35].

3.5 Effect of pH
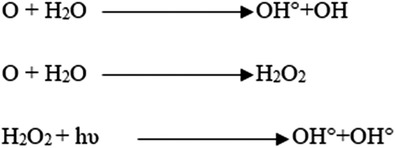
In the photocatalytic breakdown of DDT, the solution pH is an important factor. This is because, when present in an aqueous solution, DDT, a contaminant, shows various pH values. The figure illustrates the photocatalytic destruction of DDT using 2 g/L of CQD for 1 h at different pH values of the DDT solution. At pH 3 and 5, there was a 91.8% removal efficiency of DDT. The most effective pH at which DDT could be eliminated was 5, while at pH 8, it dropped to 80% The breakdown of DDT caused the CQD nanocomposite's photocatalytic activity to alter [36]. Degraded chemicals obstruct the active centers of CQD at pH > 5 (Figure 7), resulting in diminished photocatalytic activity. In order to enhance the photocatalytic activity in degrading DDT, the process produced hydroxy radicals at pH 3–5 [37].

3.6 Kinetic Model for DDT Removal
- The photocatalytic degradation processes are conducted under uniform experimental conditions and temperatures throughout.
- The spherical shape of the photocatalyst allows for instant adsorption of contaminants.
- The photocatalyst's three-dimensional porous features guarantee that pollutants are uniformly diffused both inside and on its surface.
3.7 Effect of Light Intensity
We used a 254-nm lamp to vary the power in order to examine how UV light intensity affected the DDT's deterioration. The power of the bulb varied from 8 to 32 W, while the other response parameters stayed the same. Figure 4 depicted the variation in UV light intensity as a linear increase in the rate constant (k), from 1.59 × 10⁻³ to 5.19 × 10⁻³ L/(μg min). The mathematical formula [42] that describes this link is k = 0.003 lnI − 0.017.
Figure 4 demonstrates how the intensity of the UV light had a significant impact on the rate of DDT photocatalytic degradation. Light intensity was also shown to have a non-linear relationship with the deterioration rate. The greater the UV light intensity, the more deeply it penetrated the catalyst. At higher levels, however, the reaction rate was independent of light intensity because the concentration of the photocatalyst remained constant [43].
3.8 Effect of Catalyst Dosage
Figure 8 illustrates the relationship between photocatalyst dosage and DDT elimination from an aqueous solution. The amount of DDT eliminated has been seen to increase with the photocatalyst dosage. The rate of elimination is easier to reach with the maximum photocatalyst loading, which increases the removal per photocatalyst weight. It has been found that as the photocatalyst dose is increased, the rate of DDT removal also increases [44]. It was noted that with a photocatalyst loading of 2 g/L, the removal rate was 91.5%. The removal efficiency did not significantly alter with more catalyst loading.


3.9 Determination of the ROS Responsible for DDT Degradation
Reactive oxygen species (ROS) are produced on the surface of photocatalysts during photocatalytic reactions. Similar to the ●OH and ●O radicals, these reactive oxygen species (ROS) are essential to the breakdown process. We performed two tests utilizing radical scavengers to learn more about how different ROS affected the removal of DDT [3]. Although the ●OH radical has a short lifespan in water (around 10 μs), it is known for its high reactivity in many photocatalytic systems. In this study, isopropanol (IPA) and hypochlorite were used as scavengers for the ●OH radical. The presence of IPA and HOCl resulted in a decrease in the rate of DDT degradation on CQD (Figure 10). This suggests that the ●OH radical is crucial for the degradation process.
3.10 Degradation of DDT
The results implied that DDT was oxidized. For better understanding, an analysis was done on the reaction mechanism and intermediate product by GC–MS (Figures 11, 12). The possible reaction pathway observed in the intermediate stages was as follows: (i) hydrocarbons with shorter chains are formed by breaking carbon chains and de-cyclization, which gradually removes chlorine atoms from DDT. (ii) hydrocarbons are oxidized, producing carbon dioxide (CO2) and water (H2O). Finding the shorter-chain hydrocarbons during DDT decomposition was in line with prior research. At first, the trichloromethyl group was de-chlorinated from DDT to produce DDE and DDD [4]. Afterward, DDMU was created, which subsequently underwent hydroxylation and carboxylation to become DDOH and DDA. At last, carbon dioxide was produced by mineralizing the DDT metabolites [40]. The following five metabolites were identified: DDD at m/z 320, Rt = 14.75 min (C14H10Cl4), DDE at m/z 318, Rt = 13.25 min (C14H8Cl4), DDOH at m/z 266, Rt = 14.05 min (C14H12Cl2O), DDMU at m/z 284, Rt = 14.97 min (C14H9Cl3), and DDA at m/z 282, Rt = 14.13 min (C14H10Cl2O2).


3.11 Stability of Nanocatalyst
The researchers conducted a study on the recyclability of the photocatalyst for up to four cycles. The catalyst was filtered out of the solution in each cycle, followed by a methanol wash and overnight drying at 60°C. Results showed that DDT elimination effectiveness was 91.2% in the first cycle. Nevertheless, the efficiency dropped to 78.4% after four cycles. The used catalyst was analyzed using XRD, which revealed a change in the intensity of the peak at 2θ = 30°. However, there were no observable changes in the morphology of the catalyst (Figure 13). Based on these findings, it can be concluded that the synthesized nanocatalyst exhibits a high level of photocatalytic degradation for DDT [3].

4 Conclusion and Future Perspectives
Facile synthesis of CQD nanocatalyst was successfully synthesized from the mushroom. Measurements from XRD, TEM, and FT-IR confirmed the synthesized particle size of 10–20 nm. A number of process parameters, including concentration, pH, and the impact of catalyst amount, were taken into consideration while studying the photocatalytic breakdown of DDT in water. At a pH of 3–5, with a catalyst concentration of 2 g/L and a reaction duration of 1 h at room temperature, the optimal reaction conditions were determined. This novel catalyst exhibited outstanding photocatalytic performance for DDT degradation. Maximum removal efficiency reached the value of 91.7%. Thus, the novel nanocatalyst shows potential as an effective catalyst for breaking down persistent organic pollutants, making it a promising option.
Although CQD-based photocatalyst technique has advanced and their catalytic performance has increased, there are still a number of significant issues that must be resolved before it can be widely used for real-time environmental remediation purposes. To ensure sustainability, it is essential to create low-cost, eco-friendly green techniques employing natural precursors. However, a major obstacle is reaching these objectives without sacrificing morphological and functional properties. Another major bottleneck in commercialization is scaling up to industrial applications. Managing the raw materials, keeping the high yield and purity, and ensuring consistent quality are some of the issues associated with scaling up production. Although CQDs have a lot of promise, more research is needed to fully understand how the breakdown products of CQD and the metabolites of organic pollutants affect the environment and human health. Future improvements to CQD photocatalytic qualities, including increased durability, recyclability, and degrading efficiency, may be possible by modification approaches such as doping, integration of magnetic nanoparticles, and metal nanoparticles.
Author Contributions
Sathish Sundararaman: conceptualization, methodology, data curation, supervision, resources, writing – original draft, validation. M. Karthikeyan: conceptualization, methodology, data curation, formal analysis, validation. J. Aravind Kumar: conceptualization, methodology, software, data curation, supervision, validation. Prabu Deivasigamani: conceptualization, methodology, software. T. R. Praveenkumar: conceptualization, methodology, validation, investigation. Reya Dash: conceptualization, methodology, software, formal analysis, validation. Prabhu Paramasivam: conceptualization, investigation, validation, methodology. Abinet Gosaye Ayanie: conceptualization, writing – review and editing, visualization, validation, investigation, formal analysis.
Acknowledgments
Our grateful acknowledgment goes to the Saveetha School of Engineering and Graphic Era Deemed to be University for the extensive support.
Conflicts of Interest
The authors declare no conflicts of interest.
Open Research
Data Availability Statement
Data sharing is not applicable to this article as no new data were created or analyzed in this study.