Demand Response Model of Low-Carbon Economy in Integrated Energy System Based on Carbon Flow Traceability
ABSTRACT
With the gradual liberalization of the carbon market and distributed trading market, the economic incentive trading market mechanism has become an effective way to promote carbon emission reduction in microgrids. At present, most of the existing studies on the low-carbon operation of integrated energy systems focus on the source side and rarely extend to the load side, and do not consider the demand response characteristics of different loads. Therefore, based on the carbon flow tracing method of the power system, this paper presents a model to adjust the load side operating state of the power system by using price incentive. Firstly, the carbon flow tracing model of the integrated energy system is established, and carbon flow indexes such as node carbon potential are obtained. At the same time, considering different load types, the carbon reduction response mechanism of two loads is established through carbon trading. On this basis, according to the carbon flow index, the two-stage optimal scheduling model of the power network with the coordination and interaction between the two sides of the source and load is established and solved. The simulation results show that the model combines carbon trading and demand response, which can effectively reduce carbon emissions and significantly improve the environmental benefits of the system.
1 Introduction
To attain carbon neutrality and peak carbon emissions, the development of low-carbon energy is essential. Today, the grid reduces the carbon produced by burning conventional energy by making greater use of renewable energy. In order to integrate clean energy into the power system on a larger scale and better cooperate with traditional generator sets and new energy generator sets, grid operators often utilize market mechanisms to reduce carbon emissions and improve economic returns.
Traditional optimization algorithms for integrated energy systems often rely on accurate mathematical models and parameters. Considering that integrated energy systems are complex dynamic systems with high uncertainty, it is very difficult to construct accurate models, so the application of traditional optimization algorithms in solving integrated energy system management problems is limited. In Reference [1], an interactive low-carbon economic scheduling model of the power–gas interconnection system was proposed based on the carbon emission flow theory, and a two-stage low-carbon economic scheduling model was established to reasonably adjust energy consumption behavior and minimize the total energy purchase cost of users. On this basis, to accommodate the attributes of several forms of conventional energy and novel renewable energy within the existing electrical infrastructure, a new carbon emission flow analysis model, which is in a mixed energy system, is proposed in Reference [2]. Diverse sections in the power system, including the electrical grid, gas infrastructure, and heating system, are built to examine the carbon emission flow during the conversion processes of various energy systems. It quantifies the extent of carbon emissions produced in the energy transfer and conversion process. Optimization of carbon reduction, based on a retrospective study of carbon flow in the power system, is achieved by demand response on both the generation and load sides. In Reference [3], it is proposed to jointly consider the economic low-carbon optimization scheduling of the supply side and the power side and improve the wind power consumption. First, a carbon emission reduction model was established for the source side and load side. Then, the optimal scheduling model considering low-carbon, wind power consumption, and system economic operation is constructed. Finally, the benefits of this methodology in enhancing wind energy utilization and decreasing carbon emissions are verified by simulation. Reference [4] integrates power to gas (P2G), carbon capture, and carbon dioxide cycle systems into one unified system and examines the function within the integrated electric-thermal energy system (IES). The optimal scheduling problem of IES under the linkage of the carbon cycle system is studied. The optimization results indicate that the system has significantly enhanced the reduction of wind and photovoltaic energy curtailment, thereby demonstrating a clear impact on carbon emission reduction within the power system, along with a marginal improvement in the efficiency of conventional energy sources.
The commonly used measures to optimize emission reduction regarding power generation sometimes affect the power supply situation, and it is challenging to attribute carbon emission responsibility to the load side. Therefore, the research on low-carbon scheduling has gradually extended from the power generation sector to the load sector, aiming to guide the users' electricity consumption behavior inside the electric carbon trading market to further explore the carbon reduction methods on the load side. Reference [5] establishes four load models according to whether the residential building load can be interrupted or delayed and puts forward a demand response scheduling technique for residential structures. The non-dominated sorting Genetic Algorithm II functions as a multi-objective optimization algorithm aimed at minimizing electricity costs while maximizing the convenience index. The proposed scheduling system is assessed in two contexts: working day and non-working day. The proposed scheduling strategy can significantly diminish peak load during off-peak hours, lower electricity costs, and ensure user comfort. Reference [6] introduces an improved semi-full-bridge sub-module structure, which has a faster DC fault processing speed and more negative output levels, and is more suitable for offshore wind power transmission under scenarios such as DC fault and wind farm black start. Then the negative level output, capacitor voltage self-balancing, and DC fault clearing mechanism are introduced in detail. It provides a reference for the study of energy system stability. In Reference [7], a comprehensive energy optimization and scheduling model of the park based on a double game between supply and demand was established. Based on the carbon emission flow model, a carbon-oriented pricing mechanism was implemented within the park, and an upper and lower double game model between the park and users was established. The proposed extended carbon emission flow model was correct, and the carbon emission flow pricing mechanism played a significant role in reducing carbon emissions.
From the above existing studies, the research on low-carbon optimization operation of multi-microgrid based on carbon emission flow is still in the development stage, and the research on the combination of energy flow and carbon flow for optimal scheduling of multi-microgrid is still limited [8, 9].
The integrated energy system optimization scheduling strategy proposed in this paper, which considers carbon emission flow and low-carbon demand response, can play a role in energy conservation and emission reduction for system operation [10]. Moreover, carbon flow traceability can better adapt to the output curves of different renewable energy sources than time-of-use tariff, so as to better express the real-time supply and demand relationship. Compared with the traditional demand-side response strategy, the low-carbon demand response strategy proposed in this paper is more effective and universal [11, 12].
The two-stage optimal scheduling model integrating carbon emission constraints with source-load coordination demonstrates significant advantages over traditional methods. By embedding dynamic carbon costs and renewable penetration into the optimization framework, it actively reduces fossil fuel dependency while enhancing demand-side flexibility through price-responsive load adjustments. The two-stage structure (day-ahead planning and real-time adjustment) balances economic efficiency with robustness against uncertainties like renewable intermittency. Technically, it improves computational tractability via decomposition strategies and refines multi-energy coupling modeling. Compared to conventional single-objective algorithms, this approach aligns with carbon policies, lowers peak-valley load differences, and achieves 10%–15% emission reductions without compromising system reliability, offering scalable solutions for a low-carbon energy transition.
2 Theoretical Analysis of Carbon Emissions in Power Systems
2.1 Use the Theory of Carbon Emission Flow to Delineate Carbon Accountability on the Demand Side
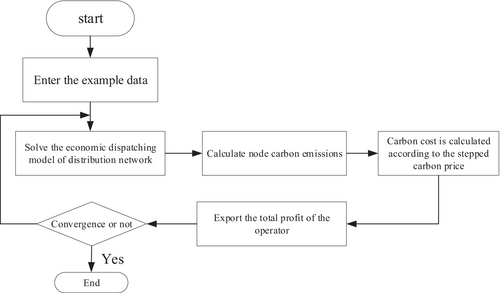
The burning of fossil fuels produces mainly carbon emissions, including thermal and gas power units, so the accountability for carbon emissions is typically ascribed to the power plant [13]. However, electricity plant operations are intended to provide electricity to the load, and the power network is ultimately responsible for transferring the electric energy produced by the power plant to the load side, and the load side consumes the electric energy, so the load side should also be the entity accountable for carbon emissions. Therefore, the load carbon flow situation of the generator set is calculated along the grid, and the responsibility for the load carbon flow situation on the load side is allocated accordingly [14]. At the same time, The best scheduling on the demand side is employed to minimize wind energy curtailment. The calculation process of carbon flow and economic optimal scheduling is shown in Figure 1:
2.2 Calculation of Carbon Emission Flow
2.2.1 Carbon Flow Rate
2.2.2 Carbon Flux Density
3 Consider the IEHS Model of DR
3.1 IEHS Architecture
IEHS can achieve the synergistic integration of electrical and thermal energy, enhance energy usage efficiency [16], and guarantee a continuous and dependable energy supply while meeting consumers' multi-energy cascading requirements.
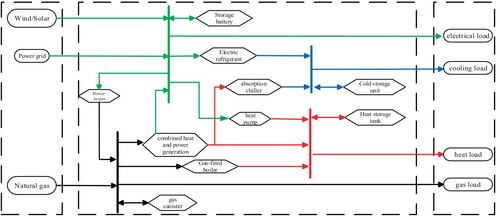
This paper builds IEHS architecture with requirement response, as shown in Figure 1. The primary power grid provides electricity, the gas network provides gas energy, and the superior source of gas is used to power the gas boiler (GB) and the combined heat and power (CHP) system, and the GB, with any surplus electricity available for sale to the superior power grid. The energy coupling apparatus comprises CHP systems, heat pumps (HP), and GBs, facilitating the various energy flows. CHP comprises a gas turbine (GT), a waste heat boiler (WHB), and a low-temperature waste heat power production system utilizing the organic Rankine cycle (ORC). Thermoelectric decoupling is the operating mode, which allows for flexibility in response to different system operating conditions. HP and GB utilize wind energy and manage a portion of the thermal load [17, 18]. Figure 2 shows the integrated energy system configuration of themicrogrid.
3.2 Load Classification Based on Demand Response
3.2.1 Demand Response Based on Pricing
-
Analysis and modeling of CL.
The price demand elasticity matrix is used to construct the demand response model. Element in row t and column j in the elastic matrix , that is, which is defined as:
(4)where means the load variation at moment t under the influence of DR; means the first response load at moment t; means the variation in power price at moment j following the DR; means the starting price at time j; Then, the reducible load change at time t subsequent to DR is:(5)where means the load that can be reduced during the t period; is price-demand elasticity is represented; denotes the power price during time j. -
SL characteristic analysis and modeling.
The transferable load denotes the load that users alter in response to electricity prices according to their demand. Utilizing the peak-level-valley time-of-use (TOU) signal, it is possible to advise consumers to change their peak level. How the changes at time t following DR is:
(6)where represents the first load that can be transferred during time t; means the matrix of SL.
3.2.2 Alternative Demand Response
4 Carbon Trading Mechanism
The adoption of a mechanism for trading carbon significantly impacts the reduction of carbon emissions. Attributing carbon emission rights to market trading can promote the enthusiasm for emission reduction.
4.1 Free Carbon Emission Quota Model
4.2 Carbon Emission Cost Model
4.3 Ladder Carbon Emission Trading Model
4.4 IEHS Optimized Operation Model
4.4.1 Objective Function
-
Energy purchase cost .
The system can carry out electricity transactions with the superior power grid. When the power generation cannot meet its own demand, it can purchase electricity from the superior power grid. Accordingly, when the power generation is surplus, the excess electricity is sold to the superior power grid. In addition, the system needs to purchase natural gas to keep the CHP and GB running. Therefore, the cost of purchasing energy is:
(15)where T is a running period; and are, respectively, the power purchased and sold from the superior power network at time t; and are, respectively, the price of electricity purchased and sold at time t; is the amount of natural gas purchased at time t; is the price per unit of natural gas. -
Carbon trading cost .
The cost of carbon trading in one operating cycle is the sum of all time costs:
(16) -
Operation and maintenance cost .
(17)where i take 1, 2, …, 6, respectively, represents the fan, CHP, HP, GB, ES and HS; is the number of operation connections of device i; is the output of device i.
4.4.2 Constraints
-
Wind power output constraints.
On the energy supply side, clean energy mainly considers wind power. Due to the uncertainty of wind power output and the transmission capacity of the grid, the system often cannot absorb all wind power, that is, the actual output of wind power is less than the predicted output.
(18)where and are the actual and predicted output of wind power at time t, respectively. -
Energy balance constraint.
IEHS constructed in this paper include electric energy flow, thermal energy flow and gas energy flow, all of which need to meet the energy balance constraints, respectively:
(19)(20)(21)where and , respectively, are the power consumption and heat production power of HP at time t; , , and are electric power, thermal power and air consumption of CHP at time t, respectively. and are the discharging and charging power of the battery at time t, respectively; and are, respectively, the heat release and heat storage power of the heat storage tank at time t; and are, respectively, the electrical load and thermal load at time t before DR. is GB air consumption at time t. -
CHP constraints.
Equations (22) and (23) are, respectively, CHP power generation and heat generation constraint. CHP power generation is divided into GT power generation and low temperature waste heat generation unit. CHP heat generation is WHB heat generation. Equations (24) and (25) are GT gas-to-electricity and gas-to-heat constraints, respectively.
(22)(23)(24)(25)(26)(27)(28)where is the electric power generated by the low-temperature waste heat device; is the proportion of waste heat generated by GT to WHB for heat production at time t; is the thermal conversion efficiency of WHB; and are the gas to electricity and gas to heat efficiency of GT, respectively. is the calorific value of natural gas, taking 9.88 kW·h/m3; is the proportion of the waste heat generated by GT at time t allocated to the waste heat power generation device; is the power generation efficiency of the waste heat power generation device. HP, GB energy conversion constraints, energy storage device constraints and equipment energy consumption upper and lower limits constraints can be referred to [12]. -
Constraints on customer satisfaction with electricity consumption.
The user's feelings about the change of electricity consumption mode will affect the enthusiasm of response, so consider the constraints on the user's satisfaction with electricity consumption mode:
(29)where s and are the minimum satisfaction value of the user's power consumption mode, respectively.
5 Example Analysis
5.1 Scene Analysis
The simulation confirms the function of the carbon trading mechanism and demand response in the optimization model to confirm the algorithm model's efficacy and constructs four operating scenarios according to the principle of control variables. Scenario 1 sees neither of the two strategies participating in the optimization of the model. Additionally, Scenario 2 solely takes into account the carbon trading mechanism, while Scenario 3 solely takes demand response into account. Demand response is taken into account in Scenario 4 to maximize scheduling under the carbon trading mechanism.
The peak-valley difference between total operating cost and net load in Table 1. In Scenario 1, the system's overall operating ladder is low, the electrical and heat load's peak-valley difference is the least, and the system's economy and security are at their optimum when flexible load is taken into account under the stepped carbon trading method. The reasonable flexible load scheduling also reduces the utilization of resources by electrical load and thermal load at the peak of energy use, which reduces the fluctuation of load voltage and the difference of load power. On the contrary, Scenario 3 does not make use of the flexible scheduling of flexible loads or the carbon trading mechanism, resulting in the maximum total operating cost of the system being 4380 yuan, which is 24.5% higher than that of Scenario 4, and the power fluctuation is also significantly larger than that of Scenario 4, which shows the superiority of the proposed strategy.
| Map | Carbon emission (kg) | Total running cost (yuan) | Net load peak-valley difference | |
|---|---|---|---|---|
| Electric load | Heat load | |||
| 1 | 943.48 | 4599 | 285 | 128 |
| 2 | 786.92 | 4530.75 | 250 | 125 |
| 3 | 667.44 | 4247.25 | 160 | 130 |
| 4 | 610.79 | 3693.9 | 170 | 85 |
In contrast to Scenario 2, Scenario 1's operational costs are 14.98% higher, and the power fluctuation of the thermal load is 70 kW higher. This is because Scenario 2 does not have the flexibility to mobilize the flexible thermal load and does not utilize the heat produced by the GT power generation to its full potential, resulting in local waste of thermal energy and ultimately increasing the expense of the system. Compared to Scenario 4, Scenario 3's overall operating costs are 553.35 yuan higher. Because the flexible electrical load and thermal load do not respond flexibly, both the peak and trough variations of load power are increasing, as are the costs related to obtaining energy and electricity from the major power grid. Scenario 1 is the strategy adopted by traditional IES. Neither the total operating cost nor the volatility index of load power has improved the efficiency and economy of the strategy. With the continuous optimization of Scenario 1 to Scenario 4, the carbon emission continues to decrease, and the carbon emission of Scenario 4 is 35% less than that in Scenario 1. Since Scenario 1 does not consider ladder carbon trading, it lacks both the advantage of carbon quota and the incentive policy of ladder carbon price, so Scenario 1 has a higher carbon emission. The usefulness of ladder carbon trading was confirmed by the outcomes of Scenario 4 compared to Scenario 1.
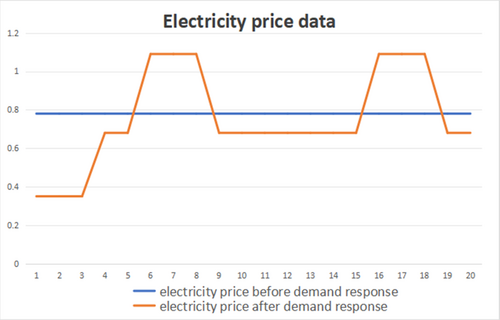
The power balance diagram for the thermal and electrical loads in Scenario 2 is displayed in Figures 3 and 4. On the electrical load's supply side, it can be found that wind power and GT power supply are the main sources of electricity consumption of the system's electrical load. Relatively speaking, photovoltaic power consumption is relatively small, and it is only used during power consumption summits. Considering the cost factor, it is more appropriate to actively invoke wind power. In the interaction between the grid and the system, the power purchased from the grid is much larger than the power sold, and the power purchased is concentrated in the 1:00–9:00 h of the electricity consumption peak period, owing to the exceedingly low price of power during this period (Table 2).
| Gas turbine power supply efficiency | Gas turbine heating efficiency | Heat recovery efficiency | ORC efficiency | Gas-fired boiler heating efficiency | Cold coefficient of electric refrigerator |
|---|---|---|---|---|---|
| 0.3% | 0.4% | 0.8% | 0.8% | 0.9% | 4.4% |
| Maximum capacity of electric energy storage | Self-loss coefficient | Energy charging and discharging efficiency | Maximum capacity of thermal energy storage | Self-loss coefficient | Energy charging and discharging efficiency |
| 400 | 0.01 | 0.95%/0.9% | 400 | 0.01 | 0.95%/0.9% |
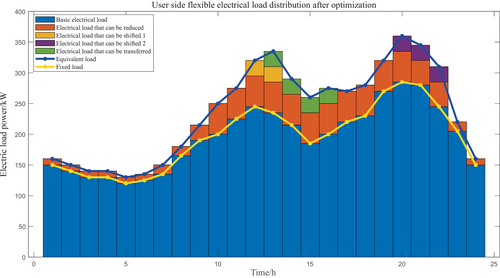
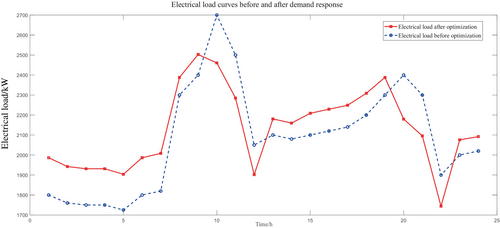
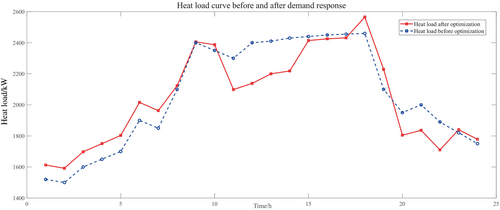
Figures 4 and 5 illustrate the ideal load scheduling plan that takes into account both heat and flexible electrical loads under the stepped carbon trading mechanism. Optimized load utilization is increased between 4:00 and 9:00 when electricity consumption is at its highest; load power is decreased between 11:00 and 21:00, when electricity consumption is at its highest, to lessen the grid's high-voltage demand. In addition to performing the functions of peak cutting and valley filling, it also lowers the overall system cost through sensible scheduling.
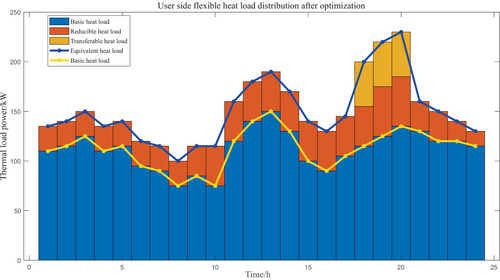
As indicated in Figure 4, the GT is essentially operating at full capacity since power dispatching reduces the amount of electricity that must be acquired from the power network superior organization. In order to satisfy the demand for thermal load, which is augmented by the GB and heat storage tank, the GT's thermal output is prioritized. The heat storage tank uses the extra heat energy in the heat recovery system to store heat during the low heat load periods of 0:00–4:00, 5:00–9:00, 22:00–24:00, and so on. It also takes part in heating during the peak heat load time. It is clear that the flexible electric load curve and the heat load curve are similarly changed both before and after optimization; the transferable heat load shifts from the evening peak of heat demand to the valley period, and the reduction of heat load further relieves the heat supply pressure at the peak.
The power balance diagram for the thermal and electrical loads in Scenario 2 is displayed in Figures 6 and 7. On the electrical load's supply side, it can be found that wind power and GT power supply are the main sources of electricity consumption of the system's electrical load. Relatively speaking, photovoltaic power consumption is relatively small, and it is only used during power consumption summits. Considering the cost factor, it is more appropriate to actively invoke wind power. The interactive power purchased from the grid is much larger than the power sold, and the power purchased is concentrated in the 1:00–9:00 h of the electricity consumption peak period.
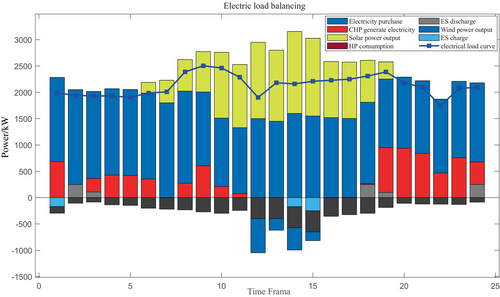
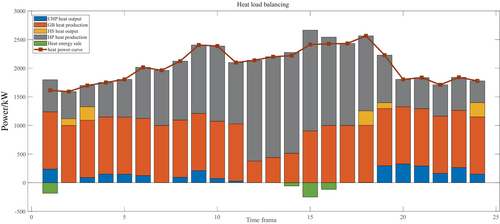
It is obvious from the two figures that cogeneration heating is the main source of system heat load, accounting for a particularly large proportion, followed by GB heat production; thermal energy storage heating and heat release are relatively low. Compared with the power supply source, the dependence of the heat load is more concentrated, so the power load has better regulation when the system fails, and the appropriate improvement of the heating source will also enhance the overall toughness of the system.
The impact of the above demand response mechanism on the supply of electric energy and heat energy, and the role of wind and light energy in the power system are integrated. As shown in Figures 8 and 9, this mechanism plays a role in peaking and valley filling in the daily power curve of the electric heating load of the power system and improves the stability of the power system.
5.2 The Impact of Carbon Trading Price on System Operation
Carbon emissions and trading costs will all be impacted by changes in the carbon trading price, which represents the scope of the objective function, which will ultimately have an impact on the total running costs of the system. These curves are displayed in Figure 10.
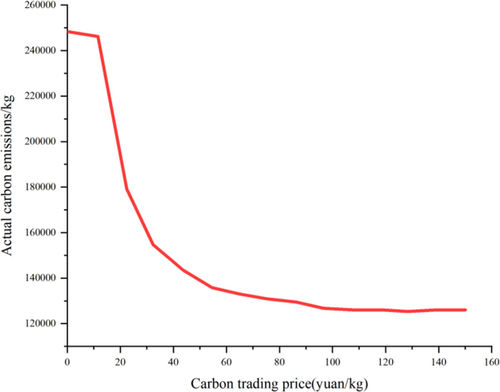
Analysis of Figure 10 shows that because the price of carbon trading is equivalent to a portion of the total cost, the system's overall running cost initially escalates and thereafter stabilizes as carbon trading prices increase. When the price is low, indicating minimal weight, the expense of carbon trading constitutes a minor fraction of the total cost, and as energy procurement costs increase, so does the system's overall running cost. In the power market, the system carbon reduction effect varies significantly when the carbon trading price is set below 60 yuan; when the price of carbon trading surpasses 100 yuan, its emission reduction effect on the system is small.
6 Conclusion
This paper proposes a carbon trading mechanism and user demand response to optimize and adjust the load side of the power system through market means. Firstly, the carbon emission model of the integrated energy system is established. The theory of carbon emission flow is introduced into the optimization of the integrated energy system, which provides a more scientific reference for the optimization of the system. On this basis, a two-stage optimal scheduling model is established. Finally, an example is given to verify the effectiveness and feasibility of the proposed model and operation method. The numerical results show that this method is beneficial to maintain the stability of the load supply and demand relationship, reduce the energy consumption cost of the user, and ensure the stability of the power system. Further integration of the carbon emission flow in operation can enable the load side to actively participate in the low-carbon demand response, improve the consumption rate of clean energy, and more effectively reduce system carbon emissions, which is conducive to low-carbon emission reduction actions.
Author Contributions
Yu Liu: conceptualization, methodology, project administration, software, supervision, writing – original draft. Xinmei Wang: conceptualization, methodology, project administration, software, supervision, writing – review and editing. Songda Li: investigation, methodology, resources, validation, writing – original draft. Lili Liu: investigation, methodology, software, validation, writing – original draft. Yi Zhao: investigation, methodology, resources, validation, writing – original draft. Ming Yu: investigation, methodology, software, validation, writing – original draft.
Conflicts of Interest
The authors declare no conflicts of interest.
Open Research
Data Availability Statement
The data that support the findings of this study are available from the corresponding author upon reasonable request.


