Artificial Intelligence-Driven Prediction and Optimization of Tensile and Impact Strength in Natural Fiber/Aluminum Oxide Polymer Nanocomposites
ABSTRACT
This study investigates the mechanical properties of hybrid composites reinforced with jute, kenaf, and glass fibers, incorporating Aluminum Oxide (Al2O3) as a nanoparticle filler. The effects of three key parameters—fiber orientation, fiber sequence, and weight percentage of Al2O3 on—the tensile and impact strength of the composites were examined. Three levels for each factor were considered: fiber orientation (0°, 45°, and 90°), fiber sequence (1, 2, and 3 layers), and varying Al2O3 content (3%, 4%, and 5%). The response surface methodology (RSM) was employed to optimize the parameters, providing insights into the interactions between these factors and their influence on the composite's mechanical performance. Additionally, artificial neural networks (ANN) were used for prediction modeling. The outcome presented that the ANN model outpaced RSM in terms of accuracy, with a higher correlation between predicted and experimental values. The optimal parameters for achieving the highest tensile and impact strength were determined, with fiber orientation at 90°, fiber sequence at 3, and Al2O3 content at 5%. This study demonstrates the effectiveness of ANN in predicting the mechanical properties of the laminated composite and highlights the significant role of fiber orientation, sequence, and nanoparticle reinforcement in enhancing composite performance.
1 Introduction
Fiber-reinforced polymer combinations of composites that combine continuous or short fibers with a polymeric resin. In these composites, fibers serve as the principal load-bearing components, markedly improving the strength of the polymer laminate structure [1, 2]. These synthetic or natural fibers enhance the flexibility and strength of plastics by reinforcing them in an elongated form. The interface and the efficient transfer of stress predominantly influence the mechanical strength of fiber-laminated materials [3]. As interest in sustainable alternatives increases, components sourced from natural materials are emerging as viable substitutes for petroleum-based polymers across numerous applications [4, 5]. The characteristics of natural filler-reinforced polymer laminates fluctuate according to the kind, origin, and arrangement of the fillers. Natural fillers have attracted considerable interest across several applications owing to their benefits, including affordability, lightweight characteristics, advantageous mechanical properties (particularly in flexural and tensile modulus), and biodegradability [6-8]. These fillers are widely utilized in different application areas like automotive, plastics, construction, and textiles [9]. Natural fillers in buildings provide exceptional insulating characteristics, rendering them both technically and economically appealing [10]. Using natural fillers in the automobile industry enhances the environmental sustainability of produced components [11].
Achieving high-quality and high-performance bast fiber-reinforced composites (BFRC) through compression molding presents challenges, primarily due to the difficulty in determining optimal process parameters. Analysis of variance (ANOVA) was conducted to evaluate the impact of each molding factor on the mechanical properties of jute/PP composites. The results indicate that response surface equations derived from response surface methodology (RSM) effectively describe the relationships between the mechanical properties of jute/PP and the molding parameters [12].
The ideal fiber parameters for producing the Epoxy Deleb fiber material were determined by RSM utilizing a central composite design (CCD). The CCD method was utilized to fit a first-degree polynomial model, facilitating the creation of the Epoxy-Deleb fiber composite. The findings demonstrated that both the fiber reinforcing composition and fiber length substantially affected critical parameters, including mechanical properties and water absorption [13].
RSM was employed to design experiments and examine the mechanical and flexural characteristics of polypropylene composites. The predictive model developed via RSM exhibited robust correlations between the reaction and affecting variables, yielding an equation that delineates their interconnections. Multi-objective optimization determined the ideal values for the three primary variables: polypropylene fiber percentage of 2%, fly ash concentration at 62%, and water-to-binder ratio at 0.27. This model accurately forecasts the essential mechanical and flexural characteristics of the materials [14].
The model forecasted an impact strength of 44.54 kJ/m2. To verify the reliability of the statistical experimental evaluation, impact strength tests were performed on both pure and mixed composites under ideal conditions, indicating a substantial enhancement in impact strength for the PFRH. This work emphasizes the efficacy of integrating RSM with artificial neural network (ANN) methodologies to attain optimal mechanical characteristics effectively, thereby minimizing production costs and preserving resources [15].
The efficacy of RSM and ANN models in forecasting the mechanical strength of concrete using fine glass aggregate and condensed milk can fibers is investigated. The predicted values from both methodologies closely aligned with the experimental results in all instances. Multiple statistical parameters—included in RSM, and standard error of prediction—validated the efficacy of both methods for predicting concrete strength. Nonetheless, RSM models exhibited superior accuracy in simulating the compressive and splitting tensile strength of concrete compared to ANN models [16].
The incorporation of nanoparticles enhanced the fiber-matrix strength by decreasing aggregation. The ANN model attained 95% accuracy in forecasting flexural strength and hardness. Comparisons of experimental data, the regressive model, and ANN results confirmed the reliability of the ANN predictions. The ideal formulation for enhancing flexural strength was identified as 5 wt% nanoparticles, 10 wt% silane treatment, and a silane immersion duration of 20 min. The optimal configuration for hardness consisted of 5 wt% nanoparticles, 15% silane treatment, and a 20-min silane immersion. This comprehensive methodology offers an efficient technique for developing outstanding durability polymer composites with tailored features [17].
This research utilizes RSM and ANN models for prediction to improve the input variables for abrasive water jet machining of straw from rice and PALF fiber materials. Process parameters were modified to enhance machining performance and minimize surface roughness and kerf angle [18].
Banana fibers are the most effective in improving the mechanical strength of natural composites, succeeded by coir, alkali treatment %, pressure, and temperature. The association between actual outcomes and those forecasted by the ANN was robust, validating that a network design of 5-3-1—consisting of five input components, three hidden nodes, and one output—is optimum for evaluating mechanical strength characteristics. NaOH-treated hybrid fiber composites demonstrated enhanced interfacial bonding, characterized by distinct claws at the interface [19]. The inclusion of Al2O3 increases tensile strength, flexural strength, microhardness, and fracture toughness as it is of high hardness, excellent thermal stability, and strong interfacial bonding with the polymer matrix. Moreover, it's reduced moisture absorption helps make the composite more durable in harsh environments by adding Al2O3 nanoparticle nanofillers. These features make Al2O3 hybrid nanocomposites with Al2O3 reinforced Al matrix suitable for such advanced structural applications as aerospace, automotive, and marine industries, where good mechanical and thermal performance materials are needed. Through these highlights, the study proves that Al2O3 nanofillers have a great contribution to the widening of potential utilities in hybrid composites (Table 1).
| Author | Materials used | Fillers used | High strength achieved |
|---|---|---|---|
| Mayakannan et al. [19] | PALF/sisal fiber | Silicon nanoparticles | 53.36 MPa tensile, 61.25 MPa flexural |
| Hossein Taghipoor et al. [20] | Kenaf fibers, basalt fiber | Graphene nanoparticles | Tensile strength of 30.9481 MPa |
| Krishnasamy Karthik et al. [21] | Carbon and basalt fiber | SiC nanoparticle | Improved mechanical Properties by 20% |
| Harikrishnan Pulikkalparambil et al. [22] | Bamboo fiber | Graphite fillers | Tensile strength, flexural strength improved by 32.78% and 27.37%, respectivey. |
| Mohit et al. [23] | Carbon, Kevlar, Basalt | Titanium carbide | Higher mechanical characteristics with a higher flexural strength (312.58 MPa) and decreased water absorption capacity by justifying its adequate for lightweight structures |
| Venkatesh et al. [20] | Jute fiber | Silica | 8 wt.% of silica performed high flexural with maximum 98 MPa |
| In this research | Jute, Kenaf, and glass fiber | Silicon Dioxide | Tensile strength increased by 32%, and flexural strength improved by 19% with three different arrangements. |
The main research problem addressed in this study is the absence in comprehensive work on hybrid epoxy composites containing natural and synthetic fibers and Al2O3 nanofillers. Although isolated fillers and fibers have each been studied, there is little research reported on a combination of jute, sisal, and glass fibers in a structured stacking sequence with Al2O3. The objective of this study is to fill this gap by investigating fiber orientation, fiber sequencing, and Nano filler content influence on tensile and impact properties of the composite. To obtain this, the unique properties of Al2O3 nanoparticles in strengthening the composites are put under investigation. It is known to be high in hardness, and stiffness, and has excellent interface bonding to the matrix to improve load transfer efficiency. Its hydrophobicity also helps in reducing moisture absorption in the long term, thus improving its durability and stability. The research aims to enhance the properties of a hybrid composite with superior mechanical properties to that of a single filler composite by using Al2O3 nanofillers. Among the key aspects that this study brings is the utilization of ANN to model the correlations between the mechanical properties and composite parameters. Composite design will be optimized with multiple ANN predictions as well as regression analysis and RSM, to determine an optimal fiber orientation, fiber sequencing, and Al2O3 concentration. Predicting performance curves, analyzing property variations, and revealing the formation of the optimal composite formulation for structural applications in aircraft and automotive industries are the scopes of the study. This research systematically investigates how fibers, nanofillers and processing parameters interact with each other to identify an optimized composite with enhanced tensile strength, impact resistance and durability and fill the gap between present studies in the development of high-performing hybrid composites.
2 Materials Used
A process is involved in making fiber-reinforced polymer composites that starts with choosing resources optimally. A jute/kenaf/glass fiber woven composite of 300 GSM was a unidirectional woven composite selected. To augment these attributes, Al2O3 was used from Ad-Nano Technology Pvt. Ltd., Bangalore, India. Jute and kenaf fibers were obtained from Hayael Aerospace Pvt. Ltd., Chennai, India, and glass fibers, epoxy LY556, and hardener HY951 from Manoj Green Composite, Chennai. The adhesive chosen was Epoxy because of its good bonding properties. The making process has a discriminating stage in which the right materials are selected. Unique advantages in the selection of jute, kenaf, and glass fibers over other conventional fiber reinforcements are used as a basis for selection. Jute and kenaf are two natural fibers with low specific gravity, biodegradability, and economical properties, which are potential sustainable materials for composite lightweight structures. They have high specific strength and stiffness, which make them well-suited for structural applications. Nevertheless, glass fiber remains utilized due to its superior tensile strength, impact resistance, and durability, which provide superior mechanical properties and structural stability. Natural and synthetic fibers are hybridized to achieve an optimum balance of strength, toughness, and environmental sustainability. Al2O3 nanofillers are chosen as they have high hardness, good wear resistance, and good thermal stability that greatly improve the tensile, flexural, and impact properties of Al2O3 nanocomposite.
2.1 Preparation of Composite
Laminated composite specimens of 300 × 300 × 5 mm were produced with different quantities of nano-graphene filler (3, 4, and 5 g) integrated into jute/kenaf/glass nano-materials. The laminates were fabricated utilizing three distinct fiber sequences: Sequence 1 (G/K/K/K/K/J/J/J/J/G), Sequence 2 (G/K/K/J/J/J/J/K/K/G), and Sequence 3 (G/J/J/K/K/K/K/J/J/G). The manufacturing technique entailed hand lay-up succeeded by compression molding. The hybrid fiber mat was cut and assembled as instructed, and epoxy LY556 combined with hardener HY951 in a 10:1 weight ratio was utilized. Each composite sustained a consistent matrix ratio of 40% by weight. Epoxy was applied to the fabric surfaces and subsequently compression molded at 80°C under a pressure of 5 kg cm−2 for 24 h. A multi-step process was followed to ensure uniform dispersion of Al2O3 nanoparticle nanofillers within the epoxy matrix. Initially, the nanofillers were ultrasonically dispersed in acetone for 30 min to prevent agglomeration. This was followed by mechanical stirring at 1000 rpm for 1 h. Finally, the mixture was subjected to bath sonication for enhanced homogeneity before composite fabrication. After molding, the laminated composites were extracted from the steel die and allowed to cure for a further 24 h at ambient temperature. The laminated panels were subsequently trimmed using an ASTM-compliant water jet machine to evaluate tensile and Impact samples.
2.2 Design of Experiment
Selecting optimal conditions for hybrid nanocomposites requires balancing multiple factors to ensure practical applicability. Increasing Al2O3 content enhances hardness and flexural strength but may reduce toughness and impact resistance, affecting overall durability. Similarly, fiber orientation plays a crucial role—while a 90° orientation improves flexural strength, it may compromise tensile strength in other loading directions. Additionally, excessive Al2O3 content can lead to agglomeration, resulting in poor dispersion and inconsistent mechanical performance. Fabrication constraints must also be considered, as higher fiber content can cause resin starvation, void formation, and weak interfacial bonding. To address these trade-offs, multi-objective optimization using a desirability function can help achieve a well-rounded composite design by balancing mechanical properties effectively. Ultimately, the selected conditions should align with the practical requirements of aerospace and automotive applications, ensuring an optimal combination of strength, durability, and manufacturability. RSM is an effective methodology employed to assess and enhance systems influenced by various elements that affect the intended result. It incorporates diverse statistical and mathematical methodologies, providing benefits beyond conventional factorial techniques. The CCD is a prevalent strategy in RSM. This technique necessitates a minimum of N trials to construct a mathematical model for “f” variables. The research examined the tensile strength and impact strength of an epoxy composite reinforced with jute, kenaf, and glass fibers, using Al2O3. The autonomous variables examined comprised the wt.% of Al2O3, epoxy. Table 2 enumerates the primary low and high points for parameters, whereas Table 3 displays 20 samples with diverse combinations of the three input levels. The table additionally presents the outcomes for flexural strength and hardness from these assessments. Furthermore, Figure 1 depicts the tensile and Impact strength samples after the test.
| Name | Units | L [1] | L [3] | |
|---|---|---|---|---|
| A | Fiber orientation | Degree | 0 | 90 |
| B | Fiber sequence | 1 | 3 | |
| C | Al2O3 | % | 3 | 5 |
| A: Fiber orientation | C: Al2O3 | Tensile strength (T) | Impact strength (I) | |||
|---|---|---|---|---|---|---|
| Std | Run | Degree | B: Fiber sequence | % | MPa | kj/m2 |
| 1 | 13 | 0 | 1 | 3 | 71 | 49 |
| 3 | 3 | 0 | 3 | 3 | 72 | 50 |
| 11 | 11 | 45 | 1 | 4 | 73 | 52 |
| 13 | 15 | 45 | 2 | 3 | 73 | 51 |
| 5 | 1 | 0 | 1 | 5 | 74 | 51 |
| 9 | 18 | 0 | 2 | 4 | 74 | 52 |
| 16 | 5 | 45 | 2 | 4 | 75 | 53 |
| 18 | 10 | 45 | 2 | 4 | 75 | 53 |
| 19 | 19 | 45 | 2 | 4 | 75 | 54 |
| 7 | 7 | 0 | 3 | 5 | 76 | 54 |
| 17 | 8 | 45 | 2 | 4 | 76 | 54 |
| 20 | 14 | 45 | 2 | 4 | 77 | 55 |
| 15 | 17 | 45 | 2 | 4 | 79 | 57 |
| 14 | 2 | 45 | 2 | 5 | 80 | 58 |
| 12 | 20 | 45 | 3 | 4 | 83 | 62 |
| 2 | 16 | 90 | 1 | 3 | 87 | 62 |
| 6 | 12 | 90 | 1 | 5 | 90 | 65 |
| 4 | 6 | 90 | 3 | 3 | 91 | 67 |
| 10 | 9 | 90 | 2 | 4 | 92 | 66 |
| 8 | 4 | 90 | 3 | 5 | 95 | 71 |
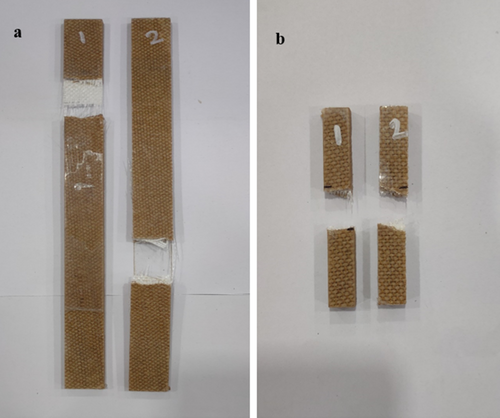
Composite specimens were tested in tensile testing according to the ASTM D3039. The testing was conducted as per the given specifications, with a gauge length of 50 mm and a crosshead speed of 2 mm/min. ASTM D 256 standards were used for impact testing, and specimen dimensions were 65 × 12.7 mm.
3 Result and Discussion
3.1 Data-Driven Evaluation for T
In this study, the coded variables for fiber orientation (A), fiber sequence (B), and Al2O3 weight percentage (C) were used to predict the T of each factor utilizing a quadratic equation. Table 4 includes parameters such as mean square (MS) and sum of squares (SS). The model F value of 27.40 indicates that the model is significant, with only a 0.01% chance that an F value this large could occur due to noise. Model terms are considered significant when the p value is less than 0.0500. In this case, the model terms A, B, C, and A2 are significant. If the p value is greater than 0.1000, the model terms are deemed non-significant. Excessive terms in the model may suggest the need for model minimization to improve its efficiency. The adjusted R2 is 0.9260, and the ratio above 4, as measured by Adeq Precision, indicates a good signal-to-noise ratio. The lack of fit (LOF) F value of 28.98 suggests an appropriate signal, with only a 0.01% chance that this magnitude of error is due to noise.
| Factor | SS | Df | MS | F | p | |
|---|---|---|---|---|---|---|
| Model | 1030.99 | 9 | 114.55 | 27.40 | < 0.0001 | Significant |
| A—Fiber orientation | 774.40 | 1 | 774.40 | 185.22 | < 0.0001 | |
| B—Fiber sequence | 48.40 | 1 | 48.40 | 11.58 | 0.0067 | |
| C—Al2O3 | 44.10 | 1 | 44.10 | 10.55 | 0.0088 | |
| AB | 4.50 | 1 | 4.50 | 1.08 | 0.3240 | |
| AC | 0.0000 | 1 | 0.0000 | 0.0000 | 1.0000 | |
| BC | 0.5000 | 1 | 0.5000 | 0.1196 | 0.7366 | |
| A2 | 88.78 | 1 | 88.78 | 21.23 | 0.0010 | |
| B2 | 1.28 | 1 | 1.28 | 0.3058 | 0.5924 | |
| C2 | 1.84 | 1 | 1.84 | 0.4403 | 0.5220 | |
| Residual | 41.81 | 10 | 4.18 | |||
| LOF | 28.98 | 5 | 5.80 | 2.26 | 0.1961 | Not significant |
Figure 2 depict the correlation between the standard probability distribution and the internal residual T. In Figure 2a, all residual points are nearly in line with the curve [20], demonstrating a robust fit with the model data. The residuals depicted in Figure 2a exhibit no substantial concerns regarding normality. Figure 2b illustrates the correlation between the T behavior of experimental and residual runs. It was advised against applying any transformation, as the data points consistently remained near “0” indicating stable variance in the experimental results. Figure 2c illustrates the relationship between the actual and forecasted T values [21]. The discrepancies between the expected and actual values are illustrated by the dispersion of points. Figure 2d illustrates that the scatter points are uniformly distributed throughout the axis, indicating a robust correlation between experimental and predicted values [22]. As the data points converge toward the reference line, the model's accuracy is enhanced, as illustrated in Figure 2d.
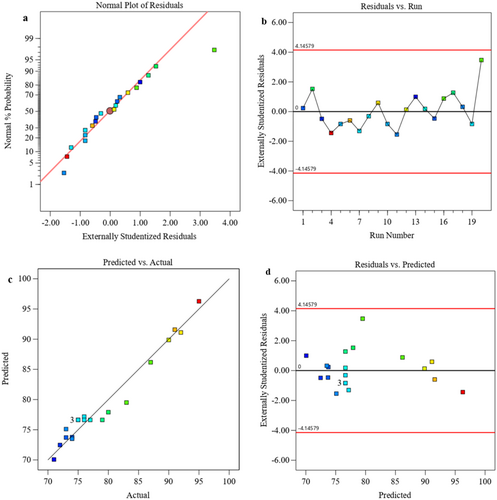
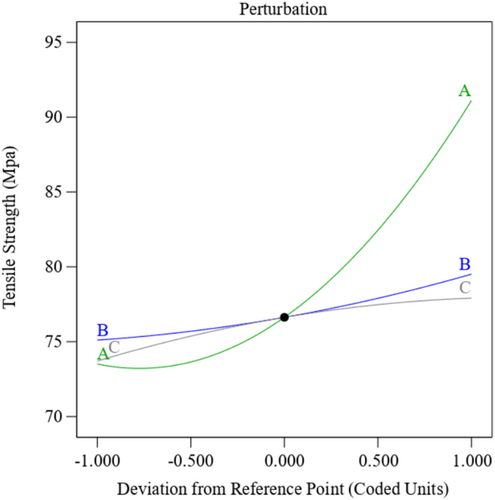
Figure 3 displays the perturbation plot, illustrating the correlation between each process variable and the T response. This graphic illustrates the impact of variations in a single variable while maintaining constancy in others on the T, using the center of the design area and the zero-coded level of each component as reference points [20, 23]. The data suggest that an increase in Al2O3 (C) correlates with a rise in T, presumably attributable to enhanced Al2O3 toughness and superior adhesion with the epoxy matrix. The T increases with the fiber orientation (A) as this procedure has high strength against the load. In contrast, the T diminishes as the fiber sequence (B) escalates, which can be ascribed to diminished strength due to the arrangement of the fiber and a weaker connection between the polymer fiber and the polymer matrix.
3.2 Surface Response for Tensile Strength
Figure 4 illustrates three-dimensional (3D) surface and two-dimensional (2D) graphs that highlight the influence of data factors on T performance. Figure 4a,b demonstrate the impact of fiber orientation and fiber sequences on T through 3D and 2D contour plots. Plots indicate that orientation plays a major role in T strength and improves T. However, T experiences a modest decline when the orientation of the fiber changes and the arrangement of fiber [24]. The optimal fiber orientation is 90, and sequence 3 has high strength. Furthermore, the 3D plot in Figure 4a illustrates that T diminishes as the orientation of the fiber changes with respect to the sequence the fiber is placed [25]. Figure 4b of the 2D contour plot corroborates this trend, indicating the maximum tensile strength at 5 wt% Al2O3 and the minimum at 3 wt%.
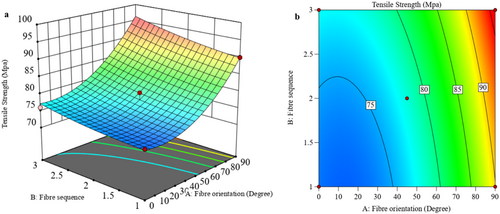
Figure 5a,b present 3D and 2D plots that illustrate the effects of Al2O3 concentration and fiber orientation on T. The 3D surface analysis indicates that increasing Al2O3 concentration to 5% enhances T, but a slight decrease follows as Al2O3 concentration rises to 4 with different orientations of the fiber [26]. This decrease is due to not having proper loading capabilities in the laminated composite.
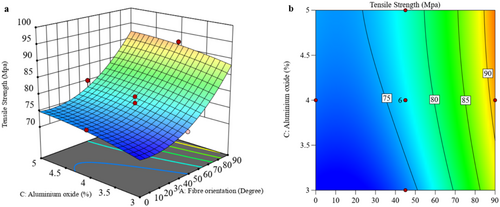
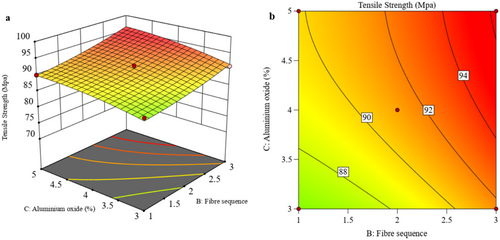
Figure 6a,b showcase the 3D-surface and 2D-contour plots, highlighting the influence of fiber sequence and Al2O3 concentration on T in the hybrid composite. Analysis of the 3D plot suggests that increasing Al2O3 concentration to 5% improves T [27]. This trend may be attributed to adequate Al2O3 dispersion and nanoparticle agglomeration within the matrix. Additionally, T increases with Al2O3 modification and different arrangements of fiber due to improved interlinking of the hybrid fiber within the epoxy resin.
3.3 Statistical Analysis of I
The coded variables for fiber orientation (A), fiber sequence (B), and Al2O3 weight percentage (C) are employed in a quadratic model to forecast the impact of each variable. The ANOVA in Table 5 compares the MS effect and MS error to compute the F ratio and p value, incorporating characteristics such as MS and SS [28]. The model is deemed significant with a Model F value of 22.07, indicating a mere 0.01% likelihood that this F value may arise from random variation. Model terms are deemed significant when the p value is < 0.0500; in this case, A, B, C, and A2 are significant. Model terms with a p value exceeding 0.1000 are deemed non-significant, suggesting a necessity to eliminate superfluous terms to improve model efficiency [29]. The adjusted R2 score is 0.9089, and an adequate precision ratio of 4 signifies a robust signal-to-noise ratio. The LOF F value of 26.49 specifies a significant signal, with hardly a 0.01% likelihood of this error size arising from noise. This test evaluates the residual error against the pure error from duplicate design values to measure the model's adequacy in data fitting.
| Factors | SS | df | MS | F | p | |
|---|---|---|---|---|---|---|
| Model | 751.38 | 9 | 83.49 | 22.07 | < 0.0001 | |
| A—Fiber orientation | 562.50 | 1 | 562.50 | 148.71 | < 0.0001 | |
| B—Fiber sequence | 62.50 | 1 | 62.50 | 16.52 | 0.0023 | |
| C—Al2O3 | 40.00 | 1 | 40.00 | 10.58 | 0.0087 | |
| AB | 6.12 | 1 | 6.12 | 1.62 | 0.2320 | |
| AC | 0.1250 | 1 | 0.1250 | 0.0330 | 0.8594 | |
| BC | 1.13 | 1 | 1.13 | 0.2974 | 0.5975 | |
| A2 | 33.69 | 1 | 33.69 | 8.91 | 0.0137 | |
| B2 | 6.19 | 1 | 6.19 | 1.64 | 0.2298 | |
| C2 | 2.75 | 1 | 2.75 | 0.7270 | 0.4138 | |
| Residual | 37.82 | 10 | 3.78 | |||
| LOF | 26.49 | 5 | 5.30 | 2.34 | 0.1865 | Not significant |
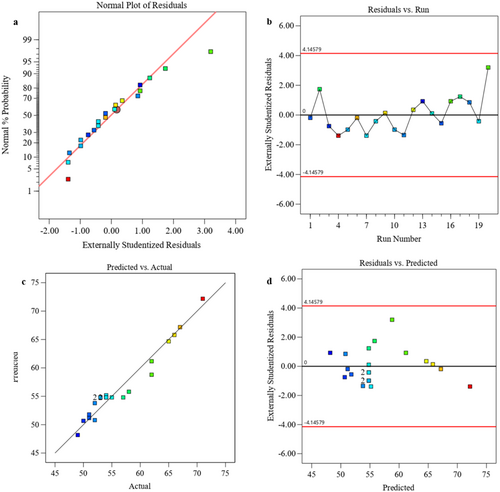
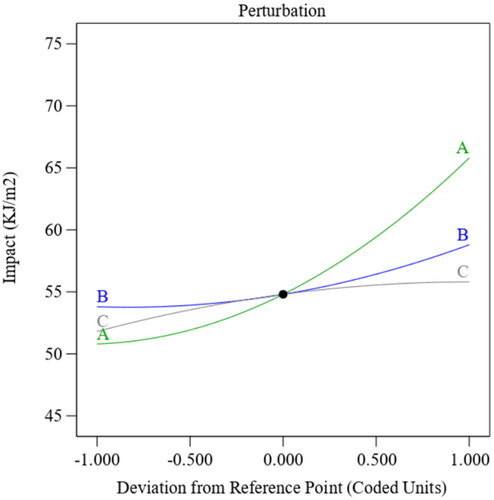
Figure 7a–d depict the correlation between the conventional probability distribution and the internal residuals for I. In Figure 7a, the majority of residual points closely match the curve, signifying a robust model fit with the data. The residuals in this image exhibit no substantial deviations from normality. Figure 7b demonstrates the correlation between the I values of experimental runs and residuals, with data points continuously near “0,” signifying stable variance and justifying the choice to forgo any data processing [30]. Figure 7c illustrates the actual versus predicted I values, with the dispersion of points indicating slight variations between anticipated and observed values. Figure 7d illustrates the uniform distribution of scatter points along the axis, indicating a robust correlation between experimental and predicted values [31]. As data points approach the reference line, the model's predicted accuracy is enhanced, as illustrated in Figure 7d. Figure 8 displays a perturbation plot that demonstrates the independent impact of modifications in each process variable on the I response. The data suggest that an elevation in Al2O3 (C) is associated with an increase in I, presumably attributable to the improved toughness of Al2O3 and its robust adherence to the epoxy matrix. Furthermore, I escalates with fiber orientation (A), as this alignment augments load-bearing strength. Conversely, I diminishes with an increase in fiber sequence (B), likely due to a less robust fiber configuration and diminished interfacial adhesion between the polymer fiber and matrix [32].
3.4 Surface Response for I
Figure 9 presents 3D and 2D plots that highlight the influence of data factors on I performance. Figure 9a,b show the effects of fiber orientation and sequence on I using these graphical representations. Analysis of the 3D surface plot reveals that fiber orientation significantly contributes to I strength, enhancing I as orientation is optimized [33]. However, a slight reduction in I occurs when the fiber orientation and arrangement are altered; fiber orientation is at 90°, with sequence 3 yielding the highest strength. Additionally, the 3D plot in Figure 9a demonstrates a decrease in I as fiber orientation shifts concerning fiber sequence [34]. The 2D contour plot in Figure 9b supports this pattern, showing maximum Impact strength at 5 wt% Al2O3 and minimum strength at 3 wt%. Figure 10a,b illustrate the 3D surface and 2D contour plots of the effects of Al2O3 concentration and fiber orientation on I. The 3D surface analysis shows that increasing Al2O3 concentration to 5% enhances I, though a slight reduction in I follows when Al2O3 concentration rises to 4%, coupled with various fiber orientations. This reduction amounted to suboptimal load-bearing capacity in the laminated composite at this concentration level [35].
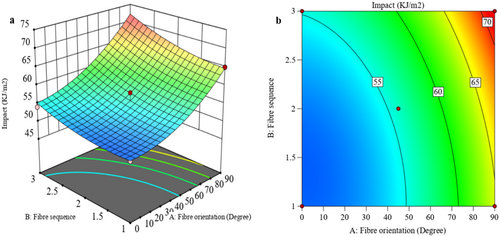
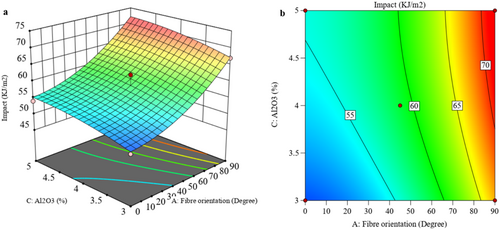
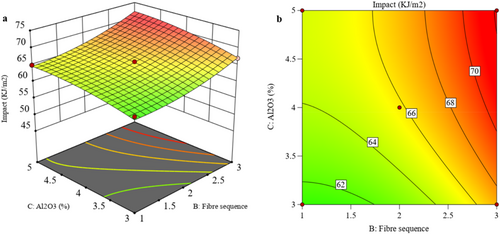
Figure 11a,b display the 3D surface and 2D contour plots, illustrating the effects of fiber sequence and Al2O3 concentration on I in the material. The 3D plot analysis indicates that increasing the Al2O3 concentration to 5% enhances I, likely due to well-dispersed Al2O3 and the formation of nanoparticle clusters within the matrix [36]. Additionally, I improves with Al2O3 modification and varied fiber arrangements, likely as a result of better interlinking between the different fiber arrangements and the epoxy resin.
3.5 ANN
ANN modeling is a measured tool particularly beneficial for establishing correlations that are challenging to replicate with physical models. This capability stems from its learning process, which allows it to detect and reproduce patterns based on input and output from samples. Several factors argue in favor of just the use of a single hidden layer ANN model, rather than a deeper network architecture. For modeling composite material properties, a single hidden layer ANN tends to be sufficient to capture the nonlinear dependence of the output (tensile strength, impact strength) can be explained in terms of the input parameters (fiber orientation, sequencing, Al2O3 content). The universal approximation theorem states that complex functions can simply be approximated using a single hidden layer with an adequate number of neurons and therefore, deeper architectures are not required for non-engaging data sets. Second, powerful networks are more likely to overfit, especially given limited experimental data. The risk is minimal (same as the training error) and the prediction is high. Furthermore, training deep networks is computationally much more expensive in terms of both computational resources and tuning of hyperparameters, and may not confer commensurate gains in predictive performance for this application [37]. Behavior in natural fiber-reinforced polymer composites is primarily influenced by material characteristics such as fiber volume fraction, fiber length, and fiber orientation [38]. Understanding these properties generally requires extensive experimental data collection, which is both time-consuming and costly. Thus, the primary objective of this study is to develop an optimal ANN model to predict the behavior of three different input parameters with output tensile and impact strength. Table 6 offers a summary of the datasets allocated for training, validation, and testing, alongside the predicted error percentage for each set. Table 7 compares the experimental results with the outputs from both the regression model and the ANN, allowing for a comprehensive evaluation of the ANN's predictive accuracy relative to experimental and regression-based results. The ANN training and evaluation were performed utilizing the MATLAB environment [39]. The network's input levels comprised fiber orientation, fiber sequence, and nanoparticle %; whereas the outputs included tensile strength and Impact strength. Figure 12 illustrates a schematic of the single-hidden-layer ANN model implemented in MATLAB. This study included 20 experimental data pairs that recorded tensile and impact. The ANN architecture randomly partitioned the input and target vectors into three subsets: 60% for training, 20% for validation (to prevent overfitting), and 20% for independent testing of the network [40]. The testing set was subsequently utilized to assess the network's accuracy. After training, five confirmatory tests were executed to evaluate the efficacy of the optimized network. The optimal ANN architecture for forecasting the behavior of hybrid composites was established by modifying the network, the number of layers, the neuron counts per layer, and the transfer function, utilizing the “trainlm” algorithm as the training function. As previously mentioned, mean squared error (MSE) was employed to evaluate the validation performance of the ANN model. The mean squared error for the optimized network was documented at 7.866 for T and 13.816 for I, as illustrated in Figure 13a,b.
| Exp. result | ANN result | Predicted error % | ||||
|---|---|---|---|---|---|---|
| Sl. no | Tensile impact | Tensile impact | Tensile impact | |||
| S1 | 74 | 51 | 73.84 | 51.08 | 0.216 | −0.157 |
| S2 | 80 | 58 | 78.25 | 56.8 | 2.188 | 2.069 |
| S3 | 72 | 50 | 72.16 | 50.13 | −0.222 | −0.260 |
| S4 | 95 | 71 | 94.6 | 71.57 | 0.421 | −0.803 |
| S5 | 75 | 53 | 75.33 | 53.34 | −0.440 | −0.642 |
| S6 | 91 | 67 | 91.2 | 67.63 | −0.220 | −0.940 |
| S7 | 76 | 54 | 75.92 | 54.78 | 0.105 | −1.444 |
| S8 | 76 | 54 | 75.83 | 54.4 | 0.224 | −0.741 |
| S9 | 92 | 66 | 91.48 | 65.47 | 0.565 | 0.803 |
| S10 | 75 | 53 | 75.64 | 53.66 | −0.853 | −1.245 |
| S11 | 73 | 52 | 73.91 | 52.33 | −1.247 | −0.635 |
| S12 | 90 | 65 | 90.12 | 64.84 | −0.133 | 0.246 |
| S13 | 71 | 49 | 70.45 | 48.77 | 0.775 | 0.469 |
| S14 | 77 | 55 | 77.28 | 55.08 | −0.364 | −0.145 |
| S15 | 73 | 51 | 73.33 | 50.79 | −0.452 | 0.412 |
| S16 | 87 | 62 | 87.39 | 61.68 | −0.448 | 0.516 |
| S17 | 79 | 57 | 77.19 | 55.9 | 2.291 | 1.930 |
| S18 | 74 | 52 | 74.62 | 51.46 | −0.838 | 1.038 |
| S19 | 75 | 54 | 75.81 | 54.29 | −1.080 | −0.537 |
| S20 | 83 | 62 | 81.5 | 61.28 | 1.807 | 1.161 |
| Sl. no | Fiber orientation | Fiber sequence | Al2O3 (%) | T (MPa) | I (kj/m2) | Regression output T | Regression output I | ANN output T | ANN output I |
|---|---|---|---|---|---|---|---|---|---|
| S1 | 0 | 1 | 5 | 74 | 51 | 73.77 | 51.17 | 73.84 | 51.08 |
| S2 | 45 | 2 | 5 | 80 | 58 | 77.91 | 55.8 | 78.25 | 56.8 |
| S3 | 0 | 3 | 3 | 72 | 50 | 72.47 | 50.67 | 72.16 | 50.13 |
| S4 | 90 | 3 | 5 | 95 | 71 | 96.27 | 72.17 | 94.6 | 71.57 |
| S5 | 45 | 2 | 4 | 75 | 53 | 76.63 | 54.8 | 75.33 | 53.34 |
| S6 | 90 | 3 | 3 | 91 | 67 | 91.57 | 67.17 | 91.2 | 67.63 |
| S7 | 0 | 3 | 5 | 76 | 54 | 77.17 | 55.17 | 75.92 | 54.78 |
| S8 | 45 | 2 | 4 | 76 | 54 | 76.63 | 54.8 | 75.83 | 54.4 |
| S9 | 90 | 2 | 4 | 92 | 66 | 91.11 | 65.8 | 91.48 | 65.47 |
| S10 | 45 | 2 | 4 | 75 | 53 | 76.63 | 54.8 | 75.64 | 53.66 |
| S11 | 45 | 1 | 4 | 73 | 52 | 75.11 | 53.8 | 73.91 | 52.33 |
| S12 | 90 | 1 | 5 | 90 | 65 | 89.87 | 64.67 | 90.12 | 64.84 |
| S13 | 0 | 1 | 3 | 71 | 49 | 70.07 | 48.17 | 70.45 | 48.77 |
| S14 | 45 | 2 | 4 | 77 | 55 | 76.63 | 54.8 | 77.28 | 55.08 |
| S15 | 45 | 2 | 3 | 73 | 51 | 73.71 | 51.8 | 73.33 | 50.79 |
| S16 | 90 | 1 | 3 | 87 | 62 | 86.17 | 61.17 | 87.39 | 61.68 |
| S17 | 45 | 2 | 4 | 79 | 57 | 76.63 | 54.8 | 77.19 | 55.9 |
| S18 | 0 | 2 | 4 | 74 | 52 | 73.51 | 50.8 | 74.62 | 51.46 |
| S19 | 45 | 2 | 4 | 75 | 54 | 76.63 | 54.8 | 75.81 | 54.29 |
| S20 | 45 | 3 | 4 | 83 | 62 | 79.51 | 58.8 | 81.5 | 61.28 |
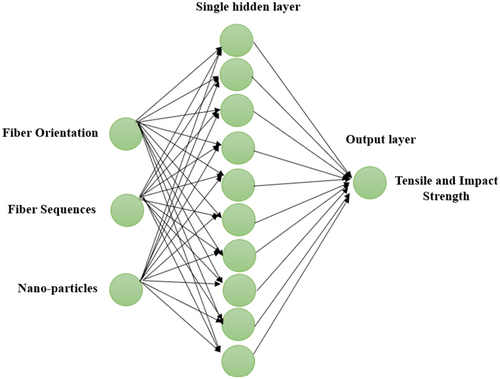
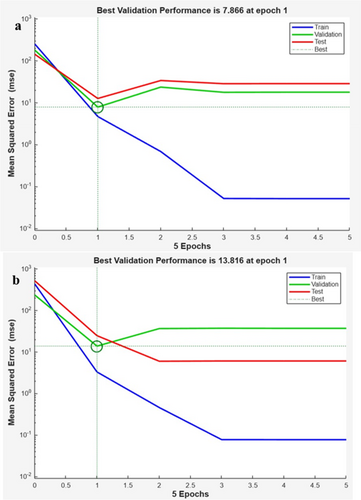
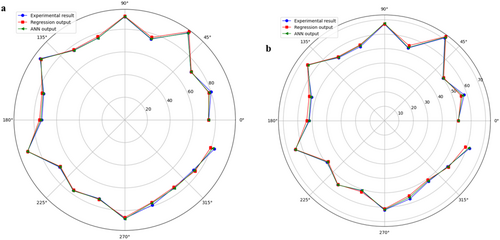
Figure 14a,b illustrate regression charts for the optimized network depicting training, validation, and testing errors for tensile and impact strength. The closeness of data clusters to the central line indicates the model's precision. Most data points are situated near this middle line, signifying the elevated accuracy of the constructed ANN model. The correlation coefficient of 0.99 indicates a robust alignment between the test results and the predictions from the single-hidden-layer ANN model, with the optimal linear fit illustrated by a dashed line [41]. Figure 15a,b provide a clear summary of the accuracy of the experimental data, predictions, and ANN model results. These figures offer a visual assessment of the studies' reliability, aiding in the evaluation of the consistency and reliability of both the experimental outcomes and model predictions.

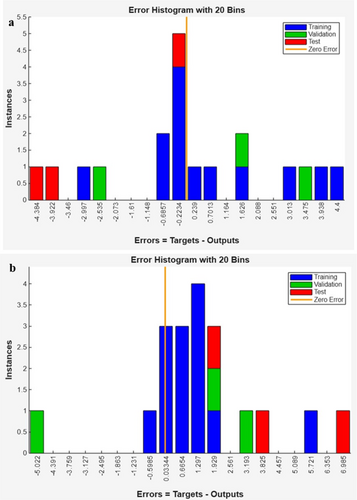
Figure 16a,b compare the experimental results with predictions from RSM regression and ANN. Both methods yield reliable outcomes, as shown by analyzing the experimental data with RSM and ANN. To confirm experimental accuracy, verification is conducted when measured parameters reach optimal conditions. Mohammed Ajmal et al. [42] performed a similar comparison, with results closely aligning and showing improved outcomes through RSM and ANN methods. Table 8 presents a comparison of experimental results, RSM predictions, and ANN predictions, demonstrating that both RSM and ANN accurately analyze the experimental data. However, the ANN approach achieves a prediction accuracy of 95%, surpassing RSM's results. The optimized ANN model facilitates the incorporation of process variables to develop composite materials with desired properties, offering a valuable, cost-effective, and time-saving tool for the polymer industry.
| Optimum factors combination | ||||
|---|---|---|---|---|
| Response | Factor and level | Experiment result | RSM | ANN |
| Tensile strength (MPa) | 90° fiber orientation, Sequence 3, and 5% Al2O3 filler | 95 | 96.27 | 94.63 |
| Impact strength (kj/m2) | 90° fiber orientation, Sequence 3, and 5% Al2O3 filler | 71 | 72.17 | 71.57 |
In this research, RSM and ANN were used to predict the values to validate the models under this research and compare predicted values from RSM and ANN with experimentally obtained results. The mean absolute percentage error (MAPE) and regression coefficient (R2) were used to assess the accuracy of the ANN model, which kept a minimum between the predicted and true values. To ensure the reliability of the ANN model, an application of cross-validation techniques was employed. It was justified that RSM would suffice in analyzing the effect of several factors and their interactions while ANN would be capable of capturing complex nonlinear relationships in composite material behavior.
4 Scanning Electron Microscopy (SEM)
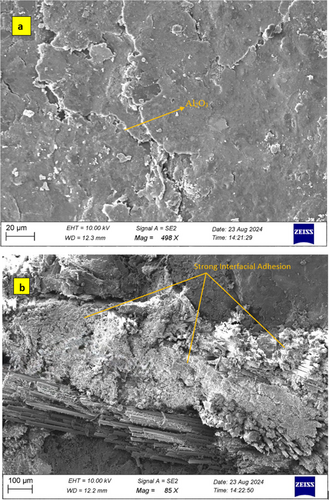
SEM images of the improved fiber matrix adhesion as a result of the incorporation of Aluminum Oxide nanoparticles are provided. The tensile SEM image shown in Figure 17a shows a more uniform and compact fiber–matrix interface, encouraging fewer voids and fiber pullout, increasing the load transfer efficiency. The improved adhesion serves to increase a tensile strength, which helps diminish premature failure mechanisms. Figure 17b shows the enhanced fracture resistance in the composite with better matrix continuity and less fiber debonding. Reinforcement of the matrix and restriction of crack propagation during impact loading are caused by the Al2O3 nanoparticles. The strong interfacial bonding essentially avoids microcracks and delamination zones and, therefore, improves the impact strength. Overall, the addition of Al2O3 significantly improves the mechanical performance of the composite by offering a stronger fiber matrix interface, preventing defects, and distributing stress in the composite, all of which is expected to make Al2O3 a good reinforcement for structural applications.
5 Conclusion
- Based on RSM analysis, the best mechanical strength was achieved with a Jute/Kenaf/Glass fiber mat weighing 300 gsm, arranged in various sequences and incorporating Al2O3 concentrations of 3%, 4%, and 5%, with a particle size of 25 μm.
- The ANN model demonstrated a strong correlation with actual results, with a mean inaccuracy rate of under 1%, underscoring its predictive precision for tensile and Impact properties.
- Tensile and Impact properties were significantly influenced by fiber orientation, fiber sequencing, and Al2O3 size. Specifically, 90° fiber orientation showed substantial improvements in both properties.
- The study found that g Al2O3 contributed 3214% to tensile strength variation and enhanced impact by 44.36% at a 5% concentration.
- The model employed the Levenberg–Marquardt (LM) algorithm, which, even without extensive dataset inputs, minimized mean squared errors. The ANN model's performance was notably effective with an architecture of eight neurons.
The findings highlight the effectiveness of using diverse neuron configurations to optimize predictive models for composite material properties.
However, ANN and RSM could make predictions, though experimental validation was only carried out on a few of the mechanical properties; other important factors, such as thermal stability, fatigue resistance, and long-term durability, were not investigated. Further research could be done on these findings by looking at other Al2O3 particle sizes and concentrations and what effect they have on composite performance. Furthermore, other fiber stacking sequences and orientations explored in this study are considered for deeper insight into hybrid composite structure optimization. Moreover, incorporating alternate machine learning techniques, including deep learning models, can improve the predictive accuracy further on complex composite behaviors. Real-world application testing, such as environmental aging and wear resistance analysis, would also prove to be the last step in validating the material's suitability for aerospace and automotive applications. The aerospace industry can benefit from composites that offer excellent weight-to-strength conditions together with impact resistance properties for interior panels, along with lightweight, non-critical structures and protective material systems. The ANN model's precise prediction ability enables efficient material selection and optimization, which shortens development times and minimizes production expenses. Research needs to include on-site experiments of these composites to test their reliability through industrial exposure conditions like heat exposure, humidity, and material fatigue. Adopting advanced manufacturing techniques like vacuum-assisted resin transfer molding (VARTM) and additive manufacturing will optimize composite processing and increase industrial manufacturing scalability for mass production.
Author Contributions
Solairaju Jothi Arunachalam: formal analysis, project administration, visualization, conceptualization, writing – original draft, writing – review and editing, data curation. Rathinasamy Saravanan: conceptualization, writing – original draft, methodology, project administration, supervision, writing – review and editing. Nashwan Adnan Othman: writing – original draft, writing – review and editing, validation, conceptualization, formal analysis, resources, data curation. Sathish Thanikodi: conceptualization, investigation, funding acquisition, methodology, writing – review and editing, writing – original draft, software, resources, data curation, validation. Jayant Giri: investigation, validation, visualization, supervision, resources, software, writing – review and editing. Muzhda Azizi: conceptualization, methodology, funding acquisition, writing – review and editing, writing – original draft, project administration, formal analysis, visualization. Taoufik Saidani: conceptualization, validation, writing – review and editing, project administration, software, resources.
Acknowledgments
The authors extend their appreciation to the Deanship of Scientific Research at Northern Border University, Arar, KSA, for funding this research work through the project number “NBU-FFMRA-2025-2225-03”.
Ethics Statement
The authors have nothing to report.
Consent
The authors have nothing to report.
Conflicts of Interest
The authors declare no conflicts of interest.
Open Research
Data Availability Statement
The data that has been used is confidential.


