Mechanism of Enhanced Gas Recovery and Carbon Storage Capacity in Gas Reservoirs With CO2 Injection: An Example of Dongfang Gas Field
Funding: This work was supported by the China National Offshore Oil Corporation South China Sea Oil and Gas Energy Academician Workstation Related Ltd. Comprehensive Scientific Research on “Research on Key Technologies for Comprehensive Utilization of CO2 and Geothermal Energy in Yingqiong Basin” (Project no. KJZH-2023-2203).
ABSTRACT
China's Yinggehai Basin gas field is in the middle and late stages of development and has a large CO2 sequestration potential. Moreover, the gas recovery is low, and it can be further enhanced by injecting CO2. In order to study the recovery ratio of the gas field and realize CO2 storage, numerical simulation studies were carried out on three types of gas reservoirs in Dongfang A gas field, including hypotonic, mesotonic depletion, and mesotonic water intrusion. The results show that: (1) competitive adsorption improves CO2 storage and CH4 recovery in low-permeability gas reservoirs; CO2 injection can effectively supplement the formation energy, and competitive adsorption and pressurization are the main controlling factors for the development of low-permeability gas reservoirs; (2) the recovery mechanism of medium permeability depleted gas reservoirs is to improve pressure and energy. Adsorption has almost no effect on methane recovery and cumulative production, and gas injection rate and gas injection components are the main controlling factors affecting CO2 sequestration; (3) CO2 injection in medium-permeability water intrusion gas reservoirs can inhibit water intrusion. The higher the injection–production ratio, the better the effect of inhibiting water intrusion. CO2 should be injected into the gas layer in the process of gas injection development, and the injection-production ratio and the gas injection components are the main controlling factors to improve CO2 storage. It is concluded that CO2 injection can improve pressure and energy, inhibit water intrusion, enhance gas recovery, and realize carbon sequestration, which makes CCUS-EGR expected to be a potential technology for the stable and increased natural gas production in the Yinggehai Basin and provides a theoretical basis for the further development of the integrated technology of gas injection, recovery, and sequestration.
1 Introduction
Since the industrial revolution, atmospheric CO2 concentrations have risen gradually, and according to the WMO Greenhouse Gas Bulletin (2022), atmospheric CO2 concentrations have risen to 417.9 ppm in 2022, which is 150% of the preindustrial level (280 ppm) [1]. The greenhouse effect has caused serious ecological problems such as receding glaciers and rising sea levels. In order to reduce the greenhouse effect, the CO2 capture, utilization, and storage (CCUS) technology was first proposed in 1972, which is considered to be one of the most important technologies for mitigating CO2 emissions, and then the CO2 sequestration and enhanced gas recovery (CSEGR) technology has become a hotspot for research, which is aimed at combining CO2 sequestration with enhanced oil and gas recovery and realizing CO2 sequestration at the same time. This technology aims to combine CO2 storage with enhanced oil and gas recovery and realize CO2 storage while enhancing oil and gas recovery. CSEGR technology has been studied globally for nearly 25 years since it was proposed [2], among which the successful storage of CO2 and natural gas recovery at the K12-B gas field in the Netherlands in 2004 demonstrated for the first time the great potential of CSEGR in energy saving and emission reduction strategies and in increasing natural gas production [3], injecting CO2 into oil and gas reservoirs is expected to enhance recovery and increase carbon storage [4], the efficiency of CO2-enhanced gas recovery (CO2-EGR) increases with the pressure differential between the injection pressure and the reservoir pressure. Meanwhile, The viscosity–density differences between CO2 and reservoir fluids, along with reservoir heterogeneity, can easily lead to viscous fingering. This phenomenon significantly reduces the sweep efficiency of displacement, thus limiting the potential for enhanced recovery and carbon sequestration [5]. Additionally, high fracture permeability, total organic carbon content, and the preferential adsorption capacity of CO2/CH4 mixtures are also important factors for CO2-EGR [3]. CO2 has advantages such as strong storage capacity, good sealing performance, and well-developed infrastructure. However, there are currently few depleted oil and gas reservoirs used for CO2 storage, and most are in the CO2 enhanced oil and gas recovery phase [6]. In 2020, with the “dual-carbon” goal, China has a more urgent need for CCUS technology [7], in order to realize the 2030 carbon peak emission reduction target, China has carried out a series of CSEGR project studies, including the study of Sichuan Basin CO2 driven gas enhancement recovery and evaluation of geological storage potential, the study of key parameters of CO2 gas injection development for enhanced recovery in CNOOC, and the synergistic study of gas injection enhancement in condensate reservoirs in Xinjiang Oilfield and the modification of gas storage, which will combine the CCUS technology with the EGR technology and have strategic significance for the efficient exploitation and utilization of energy and mitigation of the greenhouse effect in China. The combination of CCUS technology and EGR technology is of strategic significance for the efficient development and utilization of energy and the mitigation of the greenhouse effect in China [8].
Currently, gas reservoirs are the most suitable geological formations for gas storage, and natural gas reservoirs are not only effective in preventing gas leakage, but also in reducing economic costs [9], accurately characterizing the mechanisms of gas injection for enhanced oil recovery is crucial for a deeper understanding and effective prediction of CO2 migration and sequestration patterns in geological storage processes [10]. China is rich in natural gas resources, of which the Yinggehai Basin, as an important natural gas exploration area, has great potential and significant economic value [11], and its main gas-bearing areas are the Dongfang Gas Field and Dongle Gas Field. Dongfang A gas field is in the middle and late stages of development, with a large potential for CO2 sequestration, and there is still room for improvement in the recovery ratio. Injecting CO2 not only increases gas field recovery rates but also enables carbon sequestration. Supercritical CO2 can improve the mobility ratio and enhance sweep efficiency, resulting in a gas recovery rate that is 30% higher than when using pure methane or a CO2/CH4 gas mixture [12]. Consequently, the CSEGR technology is technically and economically feasible for the development of the gas field. Therefore, this paper takes the Oriental A gas field in Yinggehai Basin as the research object, and through numerical simulation, takes the competitive adsorption mechanism of CO2 and CH4 mixtures as the theoretical basis [12], studies the mechanism of gas injection in the A gas field to improve the recovery ratio, and analyzes and evaluates the effect of carbon sequestration in the field in order to provide a theoretical basis for the further improvement of the development of gas reservoirs in the Oriental A gas field and the effect of carbon sequestration.
2 Gas Reservoir Overview
Yingehai Basin is located in the sea between Hainan Island of China and Vietnam, spreading in a north–west direction, with an area of about 113,000 km2. The basin has a rapid sedimentation rate and is a typical under-compacted high-temperature, high-pressure Cenozoic oil- and gas-bearing basin [13-15]. After decades of exploration, several natural gas fields have been discovered, such as the Dongfang gas field and the Ledong gas field, and natural gas resources are mainly concentrated in the Dongfang and Ledong districts of the Central Depression Zone, with more than 95% of the resources located in these two exploration areas [16-18]. At present, the Dongfang A gas field is in the middle to late stage of development. Due to the demand for downstream components, the recovery is not balanced; the recovery degree of high hydrocarbon blocks can be up to 68%, the recovery degree of high-carbon blocks is 40%, and the nominal recovery ratio of the main gas reservoir is 60%–75%, and there is room for further improvement of the recovery ratio. The CO2 concentration of high-carbon gas wells in the Dongfang Gas Field mainly ranges from 50.8% to 82.7%; in addition, there are 14.4%–41.7% of hydrocarbon gases, and some of the recovered gases contain a small amount of N2. Therefore, it is proposed to improve the recovery ratio of the gas reservoir by using mixed gas injection, and the concentration of CO2 of the mixed gas is set at a level of 50%–90% to analyze and evaluate the effect of the development of the injection at different levels of the mechanism.
- The low-permeability block of the Dongfang A gas field is the one- and three-well area of I gas group, which is dominated by non-watercourse-sized dolomite at the front end of the submarine fan and locally develops eroded watercourse, with the thickness of the gas layer in the range of 4–30 m, and the average effective thickness of 2 m, and the thickness of the watercourse area is relatively large. The overall physical properties are poor; the average permeability is 5 mD, the average porosity is 0.22, which belongs to the medium-porosity and low-permeability gas reservoir, and the type of gas reservoir is tectonic-rocky gas reservoir.
- Typical blocks of middle permeability in Dongfang A gas field include the A area, B well area, and L2C well area of II upper gas group, which develops gravity flow submarine fan deposition, and the microphase is dominated by non-water channelized dolomite and water channelized dolomite subjected to modification. The whole reservoir is relatively continuous, with a thickness of 20–30 m, good reservoir physical properties, an average permeability of 30 mD, and an average porosity of 0.2.
- The middle-permeability water intrusion block of the Dongfang A gas field includes a four- and a five-well area of I gas group and the C area of II upper gas group; the depositional characteristics are gravity flow submarine fan. The microphase is dominated by a watercourse and non-watercourseized dolomite. The thickness of the gas layer of I gas group is thin (about 7 m), the planar continuity is stable, and the thickness of the watercourse of II upper gas group is larger (about 30 m). The physical properties of the whole reservoir are better, with an average permeability of 25 mD and an average porosity of 0.23, which is a medium-permeable gas reservoir It belongs to a medium-porosity and medium-permeability gas reservoir, and the type of gas reservoir is a tectonic-rocky gas reservoir.
| Component content (%) | |||||||
|---|---|---|---|---|---|---|---|
| Type of gas reservoir | Air group | Wells | Temperature (°C) | Current formation pressure (MPa) | CO2 | Hydrocarbon | Water saturation |
| Low osmosis | Y2I | 1 well area | 80–85 | 7.3–7.7 | 0.7–57.7 | 34.8–68.3 | Bondage water |
| Y2I | 3 well area | 80–85 | 7.3–8.5 | 0.4 | 77.9 | ||
| Middle-osmotic failure | Y2II | Well A area | 80–85 | 3.9–6.9 | 9.0 | 67.8 | Bondage water |
| Y2II | Well B area | 80–85 | 3.8–10.7 | 0.3–68.3 | 26.9– 84.0 | ||
| L2III | L2C well area | 70–80 | 4.5–5 | 0 | 83 | ||
| Water seepage | Y2I | Four well area | 80–85 | 6.5–7.4 | 1.4 | 76.0 | Edge bottom water |
| Y2II | Well C area | 80–85 | 5.3–8.0 | 1.6 | 67.3 | ||
| Y2I | 5 well area | 80–85 | 7.3–8.5 | 0.4 | 79.7 | ||
3 Simulation of Enhanced Recovery Mechanisms
3.1 Low Permeability Gas Reservoir
The low-permeability reservoir in Dongfang Gas Field is a closed reservoir with no side low water, but the bound water saturation is high (0.32), and the measured permeability is between 3.8 and 16.3 mD. The production capacity of a single well is low, with daily gas production ranging from 20,000 to 50,000 m3/day. The range of utilization of a single well is small, showing the characteristics of “double-low”; the reserve of a single well ranges from 200 to 600 million cubic meters, and the range of utilization expands with the production, and the degree of utilization is only 34%, and the degree of extraction is 32% at present. CO2 injection can increase formation pressure and replenish formation energy. The reservoir has a high mud content, with a certain adsorption capacity, and the competition between CO2 and CH4 adsorption needs further study. In addition to this, the influence of gas diffusion and convection on CSEGR should be considered in low-permeability reservoirs.
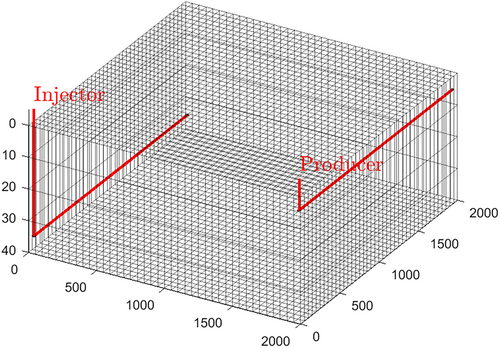
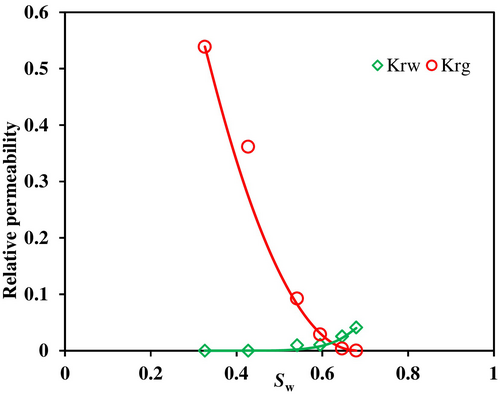
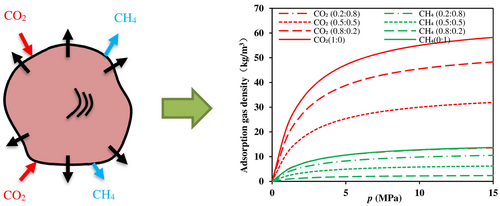
The modeling attributes of the low-permeability gas reservoir are shown in Table 2, and the grid model is a homogeneous model with a quantity of 40 × 40 × 4, as shown in Figure 1. The model obtained the phase permeability curve by fitting the relative permeability experimental data, as shown in Figure 2. Due to the low-permeability of the reservoir, horizontal well injection was used with an injection rate of 30,000 m3/day in the injection wells and constant pressure production (3.9 MPa) in the production wells. The Langmuir adsorption isotherm fitting constants were taken from Eliebid et al. [19]. As can be seen from Figure 3, the adsorption capacity of CO2 is much larger than that of CH4, and the adsorption of CO2 in the CO2–CH4 mixture is larger than that of CH4 under the same pressure conditions. Therefore, with the increase of CO2 content in the gas mixture, CO2 will be adsorbed on the rock surface, and CH4 becomes free gas. In addition, CO2 adsorption increases significantly with increasing pressure, while the increment of CH4 adsorption is smaller. Therefore, adsorption is favorable for CO2 sequestration and improved CH4 recovery.
| Parametric | Numerical value |
|---|---|
| Model size | 2000 m × 2000 m × 40 m |
| Gas reservoir thickness | 40 m |
| Porosity | 0.21 |
| Water saturation | 0.32 |
| Reservoir temperature | 81°C |
| Initial pressure | 3.9 MPa |
| CO2 and CH4 molecular diffusion coefficients | [1.6, 0.9] × 1−7 m2/s |
| Horizontal permeability | 5 mD xas |
| Vertical permeability | 0.5 mD |
| Mechanism | Well closure time (year) | CO2 mass fraction of producing wells at shut-in (%) | Total CH4 production (kg) | Total CO2 production (kg) | Total CO2 injection (kg) | CH4 geological reserves (kg) | CH4 recovery (%) | CO2 storage efficiency (%) |
|---|---|---|---|---|---|---|---|---|
| Diffusion | 21.68 | 19.90 | 2.87E08 | 1.08E07 | 4.44E09 | 5.14E08 | 55.84 | 99.76 |
| Convection | 20.94 | 19.57 | 2.65E08 | 9.27E06 | 4.29E09 | 5.14E08 | 51.51 | 99.78 |
| Adsorption | 63.57 | 20.12 | 1.47E09 | 2.44E07 | 1.30E10 | 1.75E09 | 83.94 | 99.81 |
3.1.1 Mechanistic Analysis
Considering the three mechanisms of adsorption, diffusion, and convection, Figure 4 shows the evolution of the mole fraction of CO2 in the gas phase with time considering the three mechanisms of convection, convection and diffusion, and convection, diffusion, and adsorption, respectively. Evolution of the molar fractions of the CO2 gas phase in the y-z plane as a function of time, from left to right, from top to bottom, for 5, 10, 20, and 30 years, respectively. Due to the low grid resolution, it is difficult to observe the mixing of CO2 and CH4 at the leading edge of the diffusion-accelerated displacement front. However, CO2 desorbs some of the CH4 to the free state by adsorption on the rock surface, so the CO2–CH4 mixing zone at the leading edge of the displacement front is smaller, which will be conducive to CO2 sequestration and improve the recovery ratio of the gas reservoirs. Meanwhile, the wells were shut in when the CO2 mass fraction of the producing wells was close to 20%, and the changes in CO2 sequestration and CH4 recovery were obtained, as shown in Table 3. The results showed that adsorption increased methane recovery by 20%, with diffusion and convection having little effect. In addition, the CO2 sequestration ratio is close to 100% under different mechanistic conditions, which is due to the high mud content of the reservoir, and almost all of the modeled CO2 is adsorbed to the rock surface, with obvious sequestration effects and only a very small amount of CO2 output.
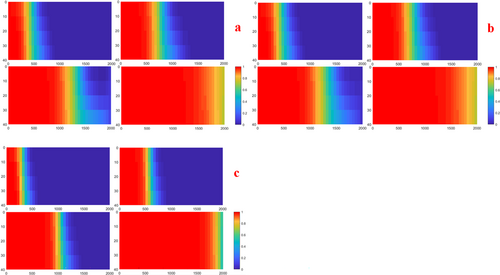
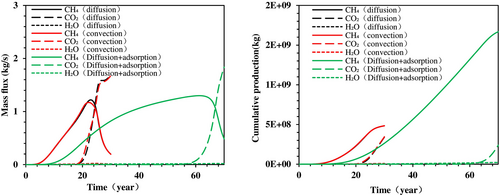
Figure 5 shows the production well production and cumulative production versus time. When adsorption is considered, the production wells produce for a longer period and have higher methane production, much higher than when diffusion and convection are considered, further suggesting that the factors affecting harvesting efficiency in low-permeability gas reservoirs are gas adsorption. Meanwhile, when adsorption is considered, the average formation pressure rises the most and lasts longer, and CO2 injection raises the average formation pressure to close to the original formation pressure, effectively replenishing the formation energy, and improving the recovery efficiency of the gas reservoir while effectively sequestering CO2.
3.1.2 Gas Injection Component
The injected gas from the Dongfang gas field has a high CH4 content, so it is crucial to study the effect of different injected gas compositions on CSEGR. By setting four different injected gas component ratios (CO2:CH4 = 0.975:0.025; CO2:CH4 = 0.95:0.05; CO2:CH4 = 0.7:0.3; CO2:CH4 = 0.5:0.5), CO2 sequestration rates and CH4 recovery were investigated under the conditions of different injection ratios.
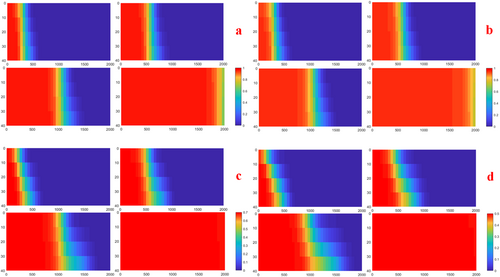
Figure 6 shows the evolution of gas-phase CO2 mole fraction with time for different injection gas ratios. Since CO2 is denser than CH4, most of the CO2 in the injected gas stays at the bottom, and CH4 is transported faster to the top. As a result, the leading edge of the drive is wider at the bottom and narrower at the top, and the higher the CH4 content, the more pronounced the changes in the leading edge of the drive.
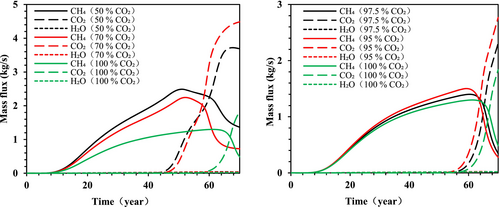
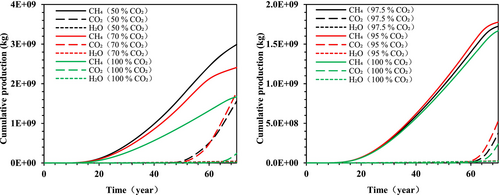
Figures 7 and 8 show the production and cumulative production of producing wells under different injected gas conditions, respectively. The higher the CH4 content of the injected gas, the higher the CH4 production of the producing well and the faster the CO2 breakthrough. As shown in Table 4, the reservoir recovery calculated without considering the injected CH4 is as high as 96.48% when the injected gas ratio is 0.5:0.5, but this does not reflect the real reservoir recovery rate, so the injected CH4 is assumed to be the reservoir geological reserve. The simulation results show that a higher proportion of CH4 in the injected gas results in a lower recovery rate and has little effect on the CO2 sequestration rate. Figure 9 shows that the higher the proportion of CH4 in the injected gas, the faster the average formation pressure rises, mainly due to the fact that the volume-specific deviation coefficient of CH4 is smaller than that of CO2.
| Injection gas CO2 ratio | Well closure time (year) | CO2 mass fraction of producing wells at shut-in (%) | Total CH4 production (kg) | Total CO2 production (kg) | Total CH4 injection (kg) | Total CO2 injection (kg) | CH4 geological reserves (kg) | Recovery without CH4 injection (%) | Recovery with CH4 injection (%) | CO2 storage efficiency (%) |
|---|---|---|---|---|---|---|---|---|---|---|
| 0.5 | 50.02 | 20.16 | 1.69E9 | 4.34E7 | 1.82E9 | 5.11E9 | 1.75E9 | 96.48 | 47.31 | 99.15 |
| 0.7 | 51.25 | 20.42 | 1.55E9 | 3.72E7 | 1.15E9 | 7.33E9 | 1.75E9 | 88.63 | 53.52 | 99.49 |
| 0.95 | 60.12 | 19.58 | 1.48E9 | 2.59E7 | 2.24E8 | 1.17E10 | 1.75E9 | 84.93 | 75.28 | 99.78 |
| 0.975 | 61.85 | 20.47 | 1.48E9 | 2.64E7 | 1.15E8 | 1.23E10 | 1.75E9 | 84.73 | 79.48 | 99.79 |
| 1.0 | 63.57 | 20.12 | 1.47E9 | 2.44E7 | 0 | 1.30E10 | 1.75E9 | 83.94 | 83.94 | 99.81 |
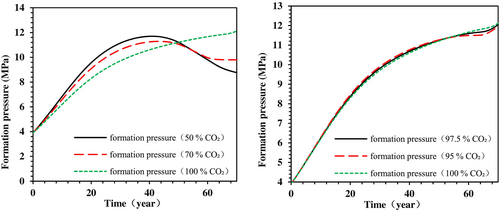
The results show that diffusion and convection have almost no effect on extraction and sequestration in low-permeability gas reservoirs, whereas competitive adsorption improves CH4 recovery by 30%, and thus adsorption is an important factor in improving low-permeability recovery. The higher the proportion of CO2 in the injected gas, the higher the recovery ratio; the CO2 injection can effectively supplement the formation energy and improve the recovery ratio of the gas reservoir, and the comprehensive analysis shows that competitive adsorption and pressure boosting, and energy supplementation are the major controlling factors in the injection of CO2 mixtures to enhance recovery from low-permeability gas reservoirs.
3.2 Medium Permeability Depleted Gas Reservoirs
Mid-permeability depletion model was built based on long-core replacement experiments. Long cores selected from medium permeability cores from the target reservoirs, carrying out gas-driven gas constant-pressure displacement experiment, got the Changes of gas components after different replacement conditions. Then, a long-core model was built to fit the experimental data, and the fitting schematic is shown in Figure 10, obtaining long-core models capable of simulating actual reservoirs, and on this basis, carrying out research on the mechanism of extraction and storage in medium-permeable gas reservoirs.
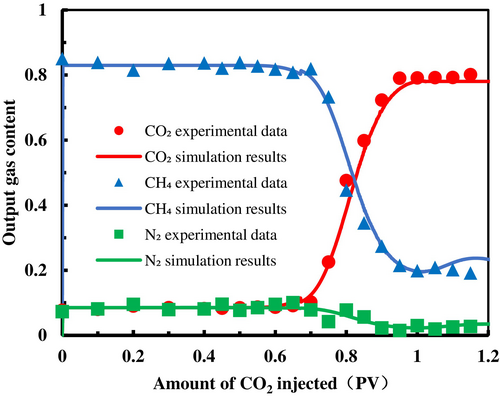
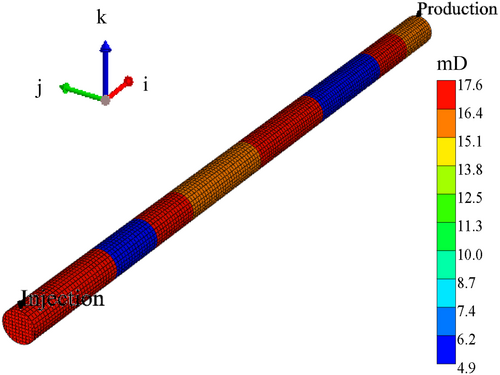
The number of long core grids is 180 × 14 × 10, and the model is shown in Figure 11. The formation pressure is 7 MPa, the temperature is 80°C, the injection rate is constant at 0.5 mL/min, and the initial concentrations of CH4, CO2, and N2 are 86.99%, 10.46%, and 2.55%, respectively.
3.2.1 Mechanistic Analysis
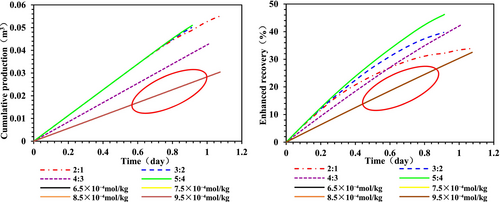
Considering the effect of pressurized make-up and competitive adsorption on recovery in medium permeability depleted gas reservoirs, a comparison of the effects of the two mechanisms on enhanced recovery by setting different injection ratios and adsorption coefficients is presented. The injection and extraction ratios were set at 2:1, 3:2, 4:3, and 5:4, and the CH4 adsorption coefficients were set at 6.5 × 10⁻⁴, 7.5 × 10⁻⁴ , 8.5 × 10⁻⁴ , and 9.5 × 10⁻⁴ mol/kg, and the results are shown in Figure 12. Meanwhile, it can be seen from Figure 13 that the higher the injection ratio, the lower the recovery rate when the gas injection is stopped, and the methane recovery rate is close to the cumulative yield under different adsorption conditions, which has almost no effect, while the pressure change has a significant effect on the yield and recovery efficiency, so the main mechanism of medium permeability gas reservoir recovery is to increase the pressure to compensate for the energy.

3.2.2 Gas Injection Components
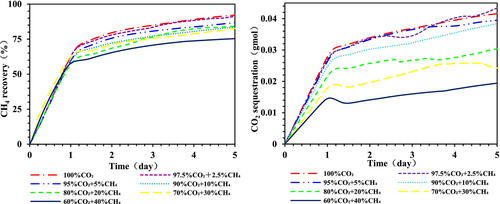
By changing the gas injection components, the results of the gas drive under different gas injection component conditions were obtained, as shown in Figure 14. The higher the CO2 concentration in the injected gas, the more efficient the drive; this is because high concentrations of CO2 enhance interactions with methane and facilitate its release from rock pores by improving fluid dynamics, altering wettability, and enhancing molecular diffusion. Therefore, medium permeability gas reservoirs should be developed by injecting high concentrations of CO2. The higher the CO2 concentration in the injected gas, the faster the CO2 concentration rises after breakthrough and the greater the amount of CO2 sequestration.
3.2.3 Gas Injection Rate
In the long core replacement experiments, the gas injection rate was constant at 7.2 × 10⁻⁴ m3/day. Therefore, the gas injection rates in the simulations were set to 7.2 × 10⁻⁴, 5.4 × 10⁻⁴, 3.6 × 10⁻⁴, and 1.8 × 10⁻⁴ m3/day. The period of gas injection was 5 days, and the results are shown in Figure 15. As the injection rate increases, the faster the CO2 breakthrough, the greater the methane recovery, due to the accelerated CO2 breakthrough, making the CO2 sequestration rise faster, and finally the CO2 sequestration at different injection rates tends to be the same.
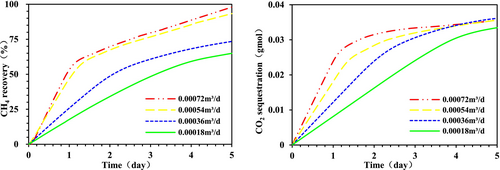
The results show that different adsorption coefficients have almost no effect on methane recovery and cumulative production in medium-permeability gas reservoirs in terms of recovery enhancement, whereas the larger the injection–production ratio, the larger the pressure rise and the significantly higher the methane recovery rate. Therefore, pressurization and energy replenishment are major factors in improving recovery from low-permeability gas reservoirs. The higher the injected gas CH4 concentration, the higher the cumulative methane production; the higher the injection rate, the faster the CO2 breakthrough; and the greater the methane recovery rate. For CO2 sequestration, the higher the gas injection rate, the faster the CO2 sequestration rises, and the higher the CO2 concentration of the injected gas, the higher the CO2 sequestration. Therefore, it is considered that the gas injection rate and the gas injection components are the main controlling factors to improve the CO2 sequestration.
3.3 Medium Permeability Gas Reservoirs With Water Intrusion
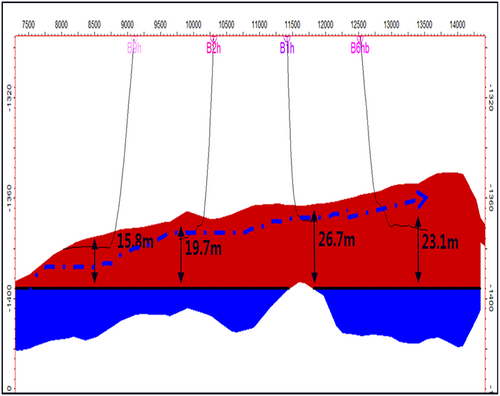
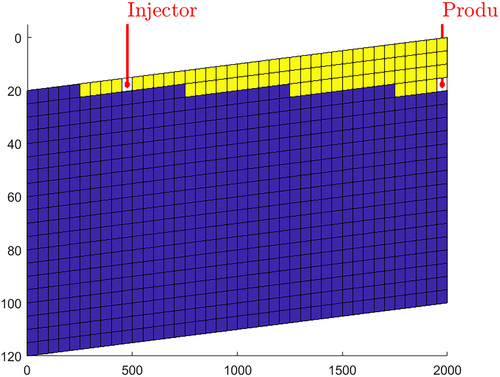
In Block C of the Dongfang Gas Field, there is a combination of edge and bottom water drive (as shown in Figure 16). The gas-to-water ratio in production wells is between 1.7 and 3.4 m3 10,000 m3. Some wells produce with water, while others are shut in after water breakthrough. Injecting CO2 can supplement reservoir energy and inhibit the upward movement of the gas–water contact. The reservoir modeling attributes are shown in Table 5, and a homogeneous grid model is established with a grid size of 40 × 1 × 20, and the reservoir is inclined, as shown in Figure 17. The bottom is a constant-pressure boundary condition, the rest are closed boundary conditions, and the initial state is hydrostatic equilibrium. The production wells produce 0.5 × 10⁴ m3/day. The injection volume for injection wells is set at 0.25 × 10⁴, 0.5 × 10⁴, and 1.0 × 10⁴ m3/day to study the ability to inhibit water intrusion under different injection-production ratios. A co-injection and coproduction scheme was used with a total simulation time of 10 years.
| Parametric | Parametric |
|---|---|
| Model size | 2000 m × 50 m × 100 m |
| Gas reservoir thickness | 100 m |
| Porosity | 0.23 |
| Water saturation | 0.32 |
| Reservoir temperature | 81°C |
| Initial pressure | 6.0 MPa |
| Height of gas–water interface to top of gas reservoir | 20 m |
| Horizontal permeability | 50 mD |
| Vertical permeability | 5 mD |
3.3.1 Injection-Production Ratio
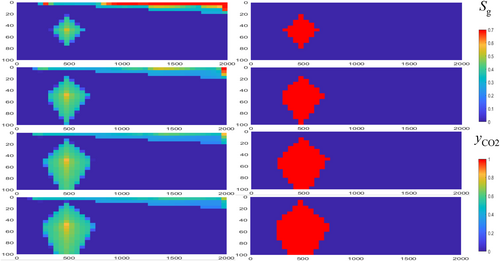
During gas reservoir extraction, the gas-water interface will shift upwards due to the reduction of bottom-hole pressure in production wells, which will result in a reduction of gas saturation. Figures 18-20 show the evolution of gas-phase saturation Sg (left) and gas-phase CO2 mole fraction yCO2 (right) over time after 10 years of production. From the figure, it can be seen that as the injection–production ratio increases, the bottom-hole pressure of the injection well rises, and the injected CO2 gas flow squeezes the gas–water interface downwards, so that the gas–water interface moves downwards, and the degree of downward movement increases with the increase of the injection ratio, while the energy of the gas reservoir can be replenished, and the replenishment of the energy increases with the increase of the injection ratio, and the final upward movement of the gas-water interface is suppressed, and the degree of water intrusion is reduced.
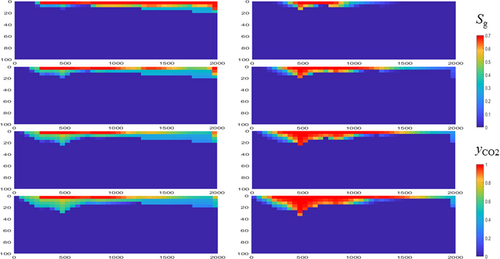
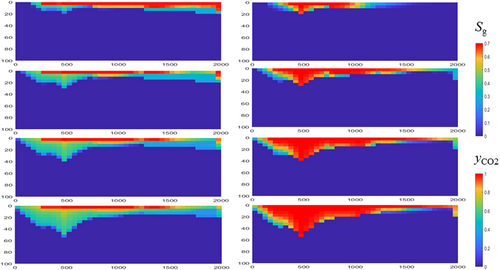
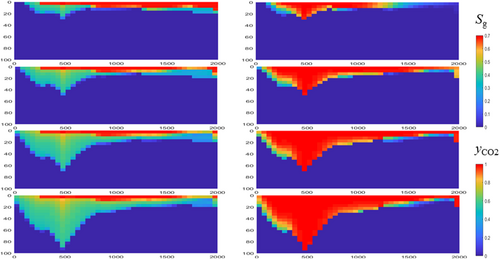
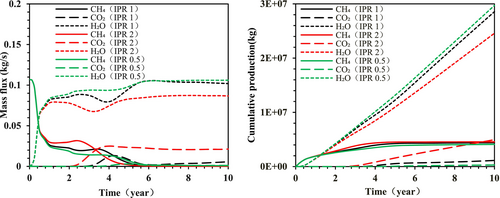
Figure 21 shows the gas production and cumulative production variations of the production wells obtained at different injection ratios. As can be seen from the figure, the higher the injection and extraction ratio, the higher the average pressure of the formation; the gas production increases while the water production decreases, the increase in formation pressure will lead to accelerated CO2 breakthrough, so it is recommended to shut down the wells in time when the CO2 content is high. Table 6 shows the changes in gas content under different injection-production ratios after 10 years of production, from which it can be seen that after 10 years of production, the higher the injection–production ratio, the higher the CH4 recovery rate, but the effect on the CO2 sequestration rate is smaller. The simulation results illustrate that CO2 injection can supplement formation energy to improve CH4 recovery and, at the same time, inhibit the upward movement of the gas-water interface, which can inhibit water intrusion to a certain extent.
| Injection–production ratio | Well closure time (year) | CO2 mass fraction of producing wells at shut-in (%) | Total CH4 production (kg) | Total CO2 production (kg) | Total CO2 injection (kg) | CH4 geological reserves (kg) | CH4 recovery (%) | CO2 storage efficiency(%) |
|---|---|---|---|---|---|---|---|---|
| 1 | 10 | 5.27 | 4.40E6 | 1.13E6 | 3.41E7 | 5.39E6 | 81.66 | 99.76 |
| 2 | 10 | 19.70 | 4.56E6 | 4.96E6 | 6.82E7 | 5.39E6 | 84.54 | 99.78 |
| 0.5 | 10 | 1.09 | 4.09E6 | 2.94E5 | 1.71E7 | 5.39E6 | 75.93 | 99.81 |
3.3.2 Gas Injection Component
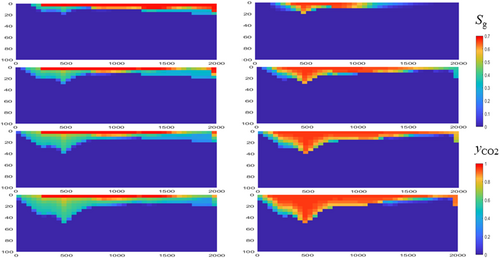
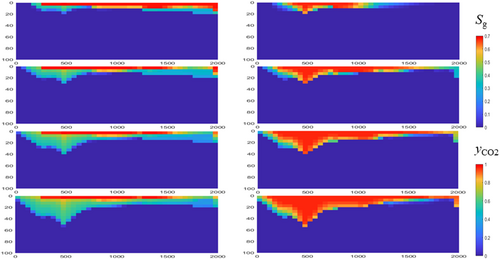
Considering that the CO2 capture and purification process can obtain CO2 with a concentration of 95%–97.5%, the effect of the injected gas components on the suppression of water intrusion was further investigated. As shown in Figures 22 and 23, the effects of gas replacement were simulated at 97.5% and 95% CO2 concentration, respectively, for 2.5, 5, 7.5, and 10 years, from top to bottom. From the figure, it can be seen that the gas mixture gradually moves downward with the increase in injection time, and there is no significant difference in the inhibition effect on water intrusion due to the similar proportion of CH4 in the injected gas.
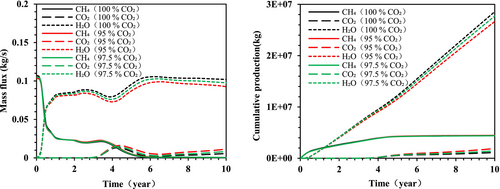
As shown in Figure 24, due to the close CH4 content of the injected gas, the cumulative yield and mass flux of the three fluids are close to each other, and the variation of the average formation pressure is almost the same under the conditions of different gas injection components. As can be seen from Table 7, the production dynamics such as the CH4 recovery rate and CO2 sequestration rate corresponding to the three injected gas fractions are relatively close to each other, which is also caused by the similar proportions of CH4 in the injected gas, indicating that there is no significant difference in their impact on water intrusion either.
| Ratio of CO2 in the injected gas | Well closure time (year) | CO2 mass fraction of producing wells at shut-in (%) | Total CH4 production (kg) | Total CO2 production (kg) | Total CO2 injection (kg) | CH4 geological reserves (kg) | CH4 recovery (%) | CO2 storage efficiency (%) |
|---|---|---|---|---|---|---|---|---|
| 1 | 10 | 5.27 | 4.40E6 | 1.13E6 | 3.41E7 | 5.39E6 | 81.66 | 96.68 |
| 0.95 | 10 | 11.06 | 4.45E6 | 1.90E6 | 3.23E7 | 5.39E6 | 82.59 | 94.11 |
| 0.975 | 10 | 7.79 | 4.42E6 | 1.45E6 | 3.31E7 | 5.39E6 | 82.01 | 95.63 |
3.3.3 Injection Site
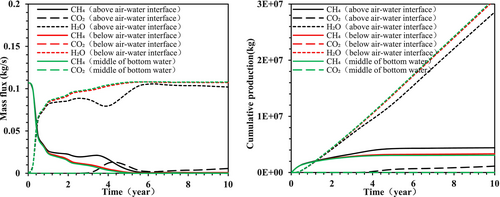
The injection layers are mainly above the gas–water interface, below the gas–water interface, and in the middle of the bottom water, and the simulation results are shown in Figures 25 and 26. Modeling times from top to bottom are 2.5, 5, 7.5, and 10 years, respectively. The results show that when the injection layer is under the gas-water interface, the CO2 gas flow is transported to the lower part of the water layer in the form of a funnel, and although the CO2 gas flow breaks through the gas-water interface and is transported to the top of the gas reservoir, the lateral transport is not obvious, and the CO2 is not transported to the production wells, and the effect of injecting CO2 for replacement is poor. When the injected layer is in the middle of the bottom water, CO2 is transported around the injected place without breaking through the gas–water interface, and the effect of gas expulsion is poor.
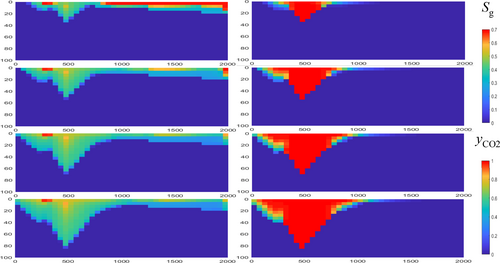
As shown in Figure 27, after the injection of CO2, the formation pressure is supplemented. With gas injection in the bottom water layer, the deeper the injection location, the lower the cumulative production of CH4, and the worse the effect of driving gas. As shown in Table 8, compared with the gas–water interface below and the water layer injection of CO2, the location of injection of CO2 in the gas zone when the effect of improving the recovery rate is the best.
| Injection site | Well closure time (year) | CO2 mass fraction of producing wells at shut-in (%) | Total CH4 production (kg) | Total CO2 production (kg) | Total CO2 injection (kg) | CH4 geological reserves (kg) | CH4 recovery (%) | CO2 storage efficiency (%) |
|---|---|---|---|---|---|---|---|---|
| Above | 10 | 5.27 | 4.40E6 | 1.13E6 | 3.41E7 | 5.39E6 | 81.66 | 96.68 |
| Below | 10 | 0 | 3.32E6 | 178 | 3.41E7 | 5.39E6 | 61.63 | 100.00 |
| Middle | 10 | 0 | 3.08E6 | 3 | 3.41E7 | 5.39E6 | 57.10 | 100.00 |
4 Conclusion
- Competitive adsorption improves CO2 sequestration and CH4 recovery in low-permeability gas reservoirs. CO2 injection can effectively replenish formation energy, and the higher the proportion of CO2 in the injected gas, the higher the recovery rate of low-permeability gas reservoirs. Competitive adsorption, pressure boosting, and replenishment are the main controlling factors for the development of low-permeability gas reservoirs.
- The main extraction mechanism of the medium permeability depletion gas reservoir is to increase the pressure to make up the energy. Different adsorption conditions have almost no effect on the methane recovery rate and cumulative production. The greater the pressure rise, the higher the methane recovery rate. The injection rate and the injection component are the main controlling factors affecting the CO2 sequestration.
- CO2 injection in medium permeability water intrusion gas reservoirs can inhibit water intrusion; the higher the injection ratio, the better the effect of inhibiting water intrusion. However, there is no obvious difference in the effect of water intrusion when the injected gas components are similar. The location of gas injection has a significant effect on the inhibition of water intrusion and improves the recovery rate; the deeper the location of the injected water layer, the lower the recovery rate of CH4 and the worse the effect of gas repulsion. Therefore, CO2 should be injected into the gas layer in the process of gas injection and development. The injection ratio and gas injection components are the main controlling factors to improve CO2 sequestration.
Author Contributions
Yuqiang Zha: conceptualization. Qing Ye: project administration. Nan Zhao: resources. Runfu Xiong: supervision. Bao Cao: data curation. Yulong Zhao: validation. Yu Li: writing – original draft. Wei Xiong: writing – review and editing. Ye Tian: investigation. Cheng Cao: funding acquisition.
Conflicts of Interest
The authors declare no conflicts of interest.
Open Research
Data Availability Statement
The data that support the findings of this study are available on request from the corresponding author. The data are not publicly available due to privacy or ethical restrictions.


