Transparency, Resiliency, and Sustainable Supply Chain Network Design by Considering New Technology
ABSTRACT
The design of a transparent supply chain is a crucial factor in building trust for traceability and cost allocation across various industries, especially in the pharmaceutical sector. Therefore, when designing a supply chain, both the product's position and the payment process must be simultaneously considered. To address the complexities of this model, emerging technologies have been integrated into a robust stochastic programming model. In this model, a probabilistic optimization approach is employed to minimize costs while considering factors such as sustainability, flexibility, and transparency. Results indicate a cost reduction of approximately 0.1% compared to traditional methods. A sensitivity analysis revealed the impact of various parameters on the model's accuracy. Additionally, it was found that the utilization of Transparency Tools (TRT) within the supply chain can enhance flexibility, transparency, and efficiency, leading to cost reductions, particularly at all levels of demand.
1 Introduction
Recently, the possibility of using new technologies such as Radio Frequency Identification (RFID), Artificial intelligence (AI),Blockchain System Technology (BCT), Internet of Things (IoT), and other TRTs in many industries for transparency and traceability has received increasing attention. A decentralized and distributed ledger system, BCT, digitally records data as assets. This data is immutable and can be applied to payment industries, cybersecurity, and to enhance transparency [1]. New technology can help in the transparency and resiliency of the Supply Chain (SC) [2]. Establishing a BCT in SCND requires careful programming to ensure accurate input and output. This can help mitigate risks and transaction costs [3]. Individual physical objects are identified using radio waves by RFID, a type of auto-identification technology. RFID technology, combined with appropriate IT infrastructure, assists major distributors, manufacturers, and other logistics operations, including pharmaceutical systems and various industries, in managing complex and global SC. RFID enables non-contact and wireless tracking and identification of products and shipments using a computer network [4]. IoT is one of the most significant advancements in information technology. The term IoT was coined in 1999 by Kevin Ashton [5]. An interconnected system of physical and virtual components through a network can be defined as an IoT system, where communication, measurement, and interaction with both internal and external environments are facilitated. A network of physical and virtual objects that are digitally connected to measure, monitor, and interact within and across companies is defined as the IoT related to SCND. These objects enable the sharing of agility, visibility, and transparency. The purpose of using IOT in SCND is to establish communication between SC entities and processes. Automatically, products and goods are identified, their flow is tracked at each stage, and complete information is provided throughout the life cycle of products, achieving transparency in the SC system to overcome traditional SC challenges [6]. Goli and Tirkolaee [7] designed a closed-loop dairy product supply chain with a bi-objective of maximizing net cash flow and shareholder payouts. They considered both financial and physical flows and used an Accelerated Benders Decomposition (ABD) algorithm to solve the model. Furthermore, three multi-objective optimization methods: Weighted Sum Method (WSM), Augmented Epsilon-Constraint (AEC), and Fuzzy Multi-Objective Programming (FMOP) were employed for optimization.
Transparency, Resiliency and Sustainable Supply Chain Network Design (TRSSCND) is a new form of SC design. In this way, transparency is a new concept that SC designers use to deal with all kinds of disturbances, such as preventing counterfeit products and instability of product acquisition by customers. The Fourth Industrial Revolution, marked by technologies like RFID and BCT, has significantly enhanced SC Transparency (SCT) [8]. Goli [9] used a robust optimization approach based on Bertsimas and Sim's method to control uncertainty and demonstrate the impact of Industry 4.0 technologies. Zelbst [8] designed the integration of three technologies: BCT, RFID system and IoT to improve the SCT system. They presented a structural model in which RFID, IoT and BCT were combined as prerequisites for SCT. Their overall hypothesis was based on the principle that these technologies would enhance information-sharing capabilities and transparency throughout the SC. Weißhuhn and H. [10] investigated the impact of IoT on SC, particularly within the context of Vendor-Managed Inventory (VMI) relationships between manufacturers and consumers. Their research focused on the advantages and operational designs of VMI in a Business-to-consumer (B2C) setting, which differs from traditional Business-to-Business (B2B) VMI due to the involvement of lay consumers. By leveraging IoT technology, undistorted demand signals can be captured, enabling more effective inventory management. The study demonstrated that VMI can yield significant benefits for both producers and consumers, such as improved service levels, reduced sales losses, and increased profitability. Additionally, the research explored the influence of various factors, including demand distribution, capacity constraints, and lead time, on the effectiveness of VMI in this B2C context. A study addressed the challenge of uncertainty in organ transplantation supply chains by employing a possibilistic programming model and a simulation-based approach. The model minimized costs while accounting for uncertainties in demand and transportation time, which were represented as fuzzy variables. To manage these uncertainties, the study utilized simulation-based optimization incorporating credibility theory [11]. Funlade Sunmolaa [12] examined the role of BCT in supply chains. They concluded that the distributed consensus algorithm, decentralization, overall productivity and expectations, the reliability of systems and data, and the transparency of BCT, are factors that enable SCs to enhance end-to-end visibility and traceability. This, in turn, leads to SCs experiencing increased levels of transparency's investigated how BCT could enhance the efficiency of traditional SC. They explored Block BCT's potential to address issues of transparency and fraud by leveraging features such as traceability, inventory and logistics optimization, and smart contracts within the SC.
1.1 The Principal Idea, Contributions, and Novel Aspects of This Research Are as Follows
Applying TRT to reduce total costs and increase transparency in SCND using a new mathematical model. Sustainability, Resilience, and Transparency, along with TRT, are added to SCND. The following is the organization of this paper: Section 2 examines prior research and delineates knowledge gaps within the scope of SCND. Section 3 formulates the mathematical model for TRSSCND. Section 4 provides the findings, results, and sensitivity analysis of the proposed model. Sections 5 and 6 provide Strategic Insights and conclude with a future outlook.
2 Previous Studies Concerning SCND
Transparency within supply chains (SCs) is paramount today, driven by evolving consumer expectations. Consumers increasingly demand environmental responsibility, sustainable practices, robust product traceability, the prevention of counterfeits, and full visibility into the product lifecycle. To fulfill these demands, industries are embracing advanced technologies that enhance SC transparency and traceability. This critical issue has spurred significant research activity among scholars, as will be further explored.
2.1 Transparency Supply Chain Network Design (TSND)
New [13] suggests that RFID is a tool for transparency. Abdel-Basset et al. [6] investigated the impact of the IoT on the set of services. The relationship between BCT and the SC was also investigated by Saberi et al. [14]. The combined impact of RFID, IoT, and BCT on SCND was investigated by Zelbst et al. [15]. They analyzed data from about 200 manufacturing managers in the United States utilizing structural equation modeling and covariance analysis. The findings showed that RFID technology directly and positively influences IoT and BCT, which in turn directly affects transparency in SCND. Additionally, RFID technology indirectly affects SCND through IoT and BCT [15]. Chunguang Bai et al. [16] conducted a comprehensive investigation into the potential of BCT to enhance the sustainability and transparency of agricultural SCs. By employing the Technology-Organization-Environment (TOE) framework, the researchers identified key factors driving the adoption of BCT in this sector. To assess the relative importance of these factors, the Best-Worst Method (BWM) was utilized. The findings of the study underscored the critical role of technical features, particularly smart contracts, in ensuring product security and traceability. These BCT-based solutions have the potential to significantly improve SSCND by minimizing fraud, counterfeiting, and food safety risks. Goli et al. [11] investigated the role of BCT in product portfolio design within a Closed-Loop Supply Chain (CLSC). They utilized a BC-based platform to manage financial flows.
Iqbal and Butt [17] has proposed a novel approach to secure agricultural SCs through the integration of BCT. This innovative system aims to address the multifaceted challenges inherent in agricultural SCs, from production to consumption. A key component of this system is an IoT and BCT-based preventive measure designed to mitigate the risk of animal attacks on agricultural products. By deploying sensor nodes across fields, real-time data on potential threats can be collected and transmitted to a field Response and Notification System (RNS). This proactive approach enables rapid response to emergencies and minimizes losses. While the proposed system offers a promising solution to enhance security and transparency in agricultural SCs, it is important to note that the research did not delve into the application of quantitative SC models. Such models could provide valuable insights into optimizing resource allocation, reducing costs, and improving overall SC efficiency. Conducted a comprehensive study exploring the synergistic potential of IoT, Building Information Modeling (BIM), and BCT in revolutionizing SC [18]. By integrating these technologies, the researchers aimed to address critical challenges such as product traceability, data integrity, and transparency. The proposed framework leverages IoT devices to capture real-time data on products and assets, BIM to create detailed digital models of physical assets, and BCT to ensure the immutability and security of SC records. This integrated approach offers significant advantages, including enhanced product traceability, reduced data manipulation, and increased transparency across supply chain layers. Reza Lotfi et al. [19] the role of BCT in sustainable supply chains. They concluded that BCT can be increasingly used in SCND due to its potential features. By employing smart contracts within the BCT, they demonstrated that costs can be reduced in the SC. However, they did not specifically address the role of BCT in creating SC transparency. Their model was a robust two-stage optimization model.
A comprehensive literature review of over 280 papers, employing bibliometric analysis and Data mining, was conducted by Montecchi et al. [20] to identify six distinct clusters within the domain of transparent SCs: transparency and visibility technologies, Information integration, governance, sustainability, traceability, and resilience. Building upon these findings, a conceptual framework was constructed to systematically categorize and connect the insights derived from these clusters, with a particular focus on the interrelationships between transparency management systems. While their research offers valuable qualitative insights, it does not delve into quantitative modeling, such as the development of mathematical models specifically tailored to transparent SCs. In an article, Sodhi [21] examined SC transparency among certain companies. They concluded that SC information and operations significantly influence a company's Product innovation advantage, manufacturing expenses, product quality, and shipping time. Sodhi argued that companies are hesitant to make their SC operations transparent due to the fear of losing Intellectual property and vulnerability concerns. Their models do not account for the role of modern technologies in enhancing SC transparency. Emerging technologies such as BCT, RFID, AI, and IoT have the potential to significantly TRSCND. By prioritizing decentralization, continuous monitoring, cost reduction, and increased transparency, these technologies can revolutionize the way goods move through the supply chain. V G Venkatesh et al. [22] explored the potential of sustainable and transparent supply chains, emphasizing the creation of safe working conditions for employees. Their model integrated BCT and IoT technologies, enabling sellers to monitor social sustainability metrics and utilize big data analytics.
2.2 Transparency and Sustainable Supply Chain Design (TSSCND)
Bastian and Zentes [23] investigated the factors influencing TSSCND and its effect on Sustainable Supply Chain (SSC) performance. Their study, employing partial least squares regression, analyzed 131 supply chains led by firms in German-speaking countries. Their findings indicate that several structural antecedents, such as disintermediation, intensive communication, third-party integration, and formal specifications, positively contribute to Increasing SCT. Furthermore, their research revealed a positive correlation between higher levels of TSSCND and improved performance across all four dimensions of SSCN: social, environmental, operational, and long-term relationship success. Lotfi et al. [24] posit that sustainability is contingent upon the implementation of sound cost management strategies within a SC framework.
Saurabh and Dey [25] investigated the potential of AI to enhance SSCN. A mixed-methods approach, combining qualitative and quantitative techniques, was employed in their research. This method included the application of predictive analytics for demand forecasting, intelligent automation for carbon reduction, real-time tracking for increased transparency, machine learning-based supplier evaluation using sustainability parameters, and various other AI-driven applications within SSCN. Findings suggest that AI is effective in improving SC visibility, promoting ethical and sustainable practices, and optimizing resource utilization to minimize waste. However, the research also identified challenges such as high costs, data privacy concerns, and skill gaps as barriers to AI adoption. Dey conducted research into the application of AI in enhancing SSCN [26]. Their study revealed that AI can be effectively employed in various SC operations such as demand forecasting, carbon footprint reduction, real-time tracking, and supplier evaluation. The researchers concluded that AI is a valuable tool for developing SSCN and advocated for its wider adoption to meet increasing environmental and regulatory requirements.
2.3 Viable Sustainable Supply Chain Design (VSSCD)
Resiliency, Sustainability, and Agility in network design characterize a Viable Supply Chain (VSC). This concept was proposed by Ivanov [27]. Lotfi et al. [1] introduced the concept of viability in their Healthcare Waste Chain Network (HWCN) paper, a novel robust stochastic optimization approach with a sustainability focus. This approach incorporates Conditional Value at Risk (CVaR) as a risk measure and leverages robust optimization and agility techniques within a network framework to mitigate demand fluctuations and enhance adaptability. Reza Lotfi et al. [19] proposed a novel two-stage robust optimization model in a paper for designing a Virtual Supply Chain Network Design (VSCND) integrated with BCT. In the first stage, they determined facility locations and activation decisions, while the second stage focused on optimizing the flow transshipment between components. Guo et al. [28] introduced BC4Regu, a novel information management framework leveraging BCT and IoT technologies to address information asymmetry in Supply Chain Finance (SCF). By integrating capital, information, logistics, and trade flows, BC4Regu has the potential to significantly reduce operational costs across the SC. Towfique Rahman et al. [29] developed resilient and agile SC strategies to mitigate panic buying during large-scale disruptions. Their integrated agent-based modeling and optimization approach simulated SC behavior under various scenarios. The results indicate that decentralized manufacturing, supplier diversification, and third-party logistics partnerships can effectively manage panic buying and ensure the availability of essential goods.
2.4 Transparency and Resiliency Supply Chain Network Design (TRSCND)
Pournader et al. [30] proposed a novel framework combining Data Envelopment Analysis (DEA) and Fuzzy Network Models (FNM) to evaluate flexibility and transparency within the SC. By applying this methodology at both the system and layer levels, their research highlighted significant disparities in flexibility across different hierarchical tiers of the SC. Shoufeng Cao et al. [31] in a research paper examined the benefits of using technologies such as IoT, RFID, and BCT to track products in the SC to increase sustainable communication in the Food SC. They proposed a high-level architectural framework using a systems approach that can guide the design and development of BCT solutions for sustainable and transparent communications in the food SC. Sunny et al. [32] utilized a Proof-of-Concept (PoC) approach to examine the influence of BCT on the traceability of specific SC distribution network configurations. Their research further delved into the potential of BCT-based Traceability (BCT) to be augmented by technologies like the IoT and smart contracts, thereby enhancing the SC in transparency. Trust, traceability, and transparency have been identified as critical factors in enhancing control over waste movement and return management activities within SC design. To integrate these three processes into Circular SCs (CSC), involving recycling, redistribution, and remanufacturing, the Triple Retry framework has been proposed [33].
2.5 Organizational Factors
- Organizational Culture: A culture that encourages innovation, learning, and collaboration facilitates the adoption of new technologies. Managers can foster such a culture by communicating clearly about the benefits and necessity of technology, creating a sense of urgency, providing training and support, identifying and recognizing early adopters, and creating a safe environment for experimentation and learning from mistakes.
- Employee Training: Effective training of employees on how to use new technologies and their connection to their tasks is essential. Organizations should identify training needs, develop appropriate training programs, deliver training effectively, and evaluate its effectiveness.
- Change Management: Implementing new technologies often requires significant changes in how people and organizations work. Effective change management helps individuals and organizations adapt to these changes by providing a clear plan, communicating with stakeholders, supporting employees, and celebrating successes.
By considering these organizational factors, organizations can increase their chances of successfully implementing proposed technologies.
2.6 Research Gap
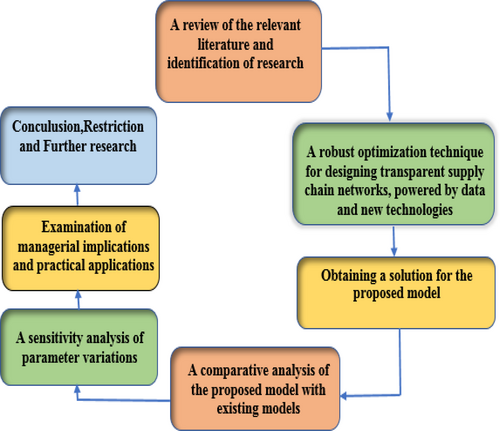
This research explores building a TRSSCND using modern technologies to address the transparency issues of traditional SCNDs. Figure 1 outlines the research method and steps. The second phase involves designing the TRSSCND using the TRT (presumably a specific design methodology or framework). This model integrates tools like BCT, RFID, the IoT, Artificial Intelligence AI, Tag Labels, and Cameras to improve visibility, lower costs, and build trust among supply chain stakeholders. The TRSSCND envisions a collaborative network of customers, retailers, distributors, and manufacturers. All participants will have real-time access to information on order status, product details, tracking, and payments. This transparency should streamline operations, reduce costs, and improve relationships within the supply chain. To optimize performance, the model incorporates strategic flexibility through adaptable facility capacity, sustainability considerations, and technological advancements. The research compares traditional and transparency-driven supply chain models to find the most cost-effective and sustainable solution. Although implementing and maintaining TRT might have high initial fixed costs, the potential savings in variable costs make adopting this new approach attractive.
3 Problem Description
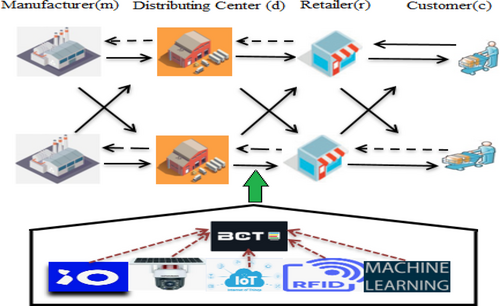
The use of new technologies and advanced technologies in the SC can be one of the approaches to transparency when receiving a request in the SCND. In this research, considering the TRT, a TRSSCND is designed. Table 1 shows the lack of research on transparency and product tracking in an agile SC using TRT. In this model, we have customers who announce their orders to retailers and manufacturers in a transparent space and trade with each other. The layers of the SC use BCT in payment transactions, FRID in product tracking, and other tools for transparency, and thus orders are automatically and transparently executed and tracked between the layers of the SC. Finally, a flexible TRSSCND is designed through facility flexibility, considering sustainability, agility, and TRT. In Figure 2, we have used new technologies in SC design. These technologies allow customers to view and track all their orders and payments from the time a request is registered until the goods are delivered at all levels of the SC. In this model, TRT is used in the SC, which will reduce total costs. A model is designed that can choose to use either a traditional SC or a fourth-generation SC. Therefore, we consider the following assumptions for the model.
| Ref. | SCND type | Focus | Advantages and disadvantages of design | New technology and role in SCND | Attributes of the utilized technology |
|---|---|---|---|---|---|
| [25] | SCND | How the BCT based can reduce costs Help in several supply chain scenarios | It provides the possibility of system integration and cost reduction | — | Smart contracts |
| [27] | TRSCND | How BCT-based traceability can contribute to TRSCND | Enables system unification |
Monitoring, transparency, counterfeit prevention, Safety |
Smart contracts data integrity |
| [33] | CLSCND | BCT can be used to enhance trust, traceability, and Transparency CLSCND | Decentralization and system integration |
Trust, reduce business costs Improve productivity |
Smart contracts; privacy protection |
| [1] | SCND | The impact of BCT on project scheduling | Considering BCT to reduce risk and robustness in project scheduling | — | Risk and robustness |
| [13] | SCND | Factors by which SSCND transparency is promoted | — | SC accountability and product disclosure | Sustainability |
| [6] | SCND | IoT and BCT-based protective systems for sustainable agriculture | Facilitates system integration | — | Sustainability |
| [34] | SCND | Increasing information transparency in supply chain financing through BCT and IoT | System topology | Business operations | — |
| [14] | SCND | Using IoT and BCT integration to improve traceability and security | Enhanced security, process improvement mechanism | Enhanced data traceability and transparency | Integration of IOT-BIM and BCT |
| [15] | SCND | Applying RFID and IoT technology to BCT. | Effects of RFID and IoT on BCT | Traceability, transparency | — |
| [35] | SCND | How to use AI in the SCND | To enhancing SSCM | Transparency | Sustainability and transparency |
| [20] | SCND | Using partial least squares regression in the SCND | To enhancing SSCM |
Sustainability, transparency |
— |
| [31] | FSCND | Using RFID, IOT, and BCT in FSCND | Increase sustainable communication | Developed a high-level architectural framework | — |
| This research | TRSSCND | Using new technologies such as TRT | Design TRSSCND | Resiliency, sustainable and transparency | Information integration, vision, and tracking sensors |
3.1 Assumptions
- Full demand coverage and Rapid response flexibility (agility).
- SC forwarding is being actively regulated by flow and capacity constraints (agility).
- Transparency across SC layers is being facilitated by tools to reduce variable costs (agility).
- Sustainability constraints are defined in terms of emission and energy consumption limitations (sustainability).
- The facility's resilience is being fortified through the implementation of a flexible, scenario-based capacity strategy (resiliency).
- Fluctuating demand is being addressed through the use of robust stochastic programming (resiliency).
- Fixed costs undergo a reduction upon the activation of TRT.
Sets (indices)
| Set of manufactures, | |
| Set of distributors, | |
| Set of retailers, | |
| Set of costumers | |
| Set of goods | |
| Set of scenarios, | |
| Set of periods | |
| Set of TRT |
Parameters:
| Parameters: | Description | Value for parameter | Unit |
| The demand of customer c for good g in period t on scenario s | [Un (2000,2100)].1000. ((s−1)/((|s|)−1)). (0.18 + 0.9) | Number | |
| Fixed cost for establishing manufacture m with Euro | [Un (80,85)]0.1000 | Euro | |
| Fixed cost for establishing distributer d with Euro | [Un (200,210)]0.1500 | Euro | |
| Fixed cost for establishing retailer r with Euro | [Un (200,210)]0.200 | Euro | |
| Variable cost from manufacturer m to Distributer C (DC) d for good g in period t on scenario s | [Un (4,5)]/1000 | Euro/Number | |
| Variable cost from DC d to retailer r for good g in period t on scenario s | [Un (2,3)]/1000 | Euro/Number | |
| Variable cost from retailer r to customer c for good g in period t on scenario s | [Un (1.2,2.2)]/1000 | Euro/Number | |
| Capacity of manufacture m for good g to period t on scenario s | [Un (5500,6600)].10000 | Number | |
| The capacity of distributer d for good g to period t on scenario s | [Un (3350,4450)].10000 | Number | |
| The capacity of retailer r for good g to period t on scenario s | [Un (3350,4450)].10000 | Number | |
| Energy utilization for movement from manufacture m to DC d for good g in period t on scenario s | [Un (1,2)]. | Megajoule (MJ)/Number | |
| Energy utilization for movement from DC d to retailer r for good g in period t on scenario s | [Un (1,2)]. | MJ/Number | |
| Energy utilization for movement from retailer r to customer c for good g in period t on scenario s | [Un (1,2)]. | MJ/Number | |
| CO2 produced for movement from manufacture m to DC d for good g in period t on scenario s | [Un (1,2)]. | MJ/Number | |
| CO2 produced for movement from DC d to retailer r for good g in period t on scenario s | [Un (4,5)]. | MJ/Number | |
| CO2 produced for movement from retailer r to customer c for good g in period t on scenario s | [Un (4,5)]. | MJ/Number | |
| Coefficient of conservative | 90 | % | |
| Availability coefficient of manufacture m | 90 | % | |
| Availability coefficient of distributed d | 90 | % | |
| Availability coefficient of retailer r | 90 | % | |
| Highest emission is allowable for period t on scenario s | 5500. | Ton | |
| Maximum energy is allowable for period t on scenario s | 7800. | MJ | |
| Cost of maintenance transparency facility | 8000 | Euro | |
| Cost of variable transparency facility | [Un (10,000,12,000)] | Euro | |
| Minimum score for transparency variable | 0 | Number | |
| Budget for transparency facility | 1/4. | Euro | |
| Transparency score | 100 | Number | |
| Total cost of transparency facility | [Un (400,420)] | Euro |
Decision variables:
| Binary (zero–one) variables |
| Equal 1, if manufacture m is established; otherwise, 0 |
| Equal 1, if distributed d is established; otherwise, 0 |
| Equal 1, if retailer r is established; otherwise, 0 |
| Equal 1, if transparency tr is established; otherwise, 0 |
| Positive (continues) variables |
| The transfer between manufacture m and DC d for good g in period t on scenario s. |
| The transfer between DC d and retailer r for good g in period t on scenario s. |
| The transfer between retailer r and customer c for good g in period t on scenario s. |
| Auxiliary (slack) variables |
| Fixed cost for established facilities. |
| Fixed cost includes FCf and tctrans. |
| Variable cost related to SCND. |
| Variable cost includes related to transparency facility. |
| Total cost includes FC and . |
| Objective function. |
3.2 Model: TRSSCND
Subject to:
The objective function (1) is designed to minimize total cost and maximum transparency cost. This approach is intended to enhance the system's robustness against demand disruptions by considering worst-case scenarios. Constraint (2) shows the maximum transparency costs are greater than the total costs. Constraint (3) includes the total fixed costs and transparency costs. Constraint (4) includes the total variable costs. Constraint (5) stipulates that the total cost is determined by the aggregation of fixed and variable costs. Constraint (6) shows the cost of transparency facility setup and fix cost facility. Constraint (7) The satisfaction of demand is shown. Constraints (8) and (9) The flow quantities between facilities are presented. Constraints (12) and (13) The presentation of resiliency strategies, facility constraints, and capacity constraints is contingent upon the specific scenario being analyzed. Constraints (14) and (15) The presentation of sustainability strategies is accompanied by an assurance that total emissions and energy consumption will not exceed maximum limits. Constraint (18) indicates the total score of transparency. (19) Shows the total cost of setting up TRTs. Constraint (20) indicates the total score of transparency is greater than the minimum score. Constraint (21) shows total transparency cost is less than the transparency budget. Constraint (22) The locations, binary variables, and the activation of TRTs are depicted. Constraint (23) shows decision variables.
3.3 Complexity of the Problem
4 Results and Discussion
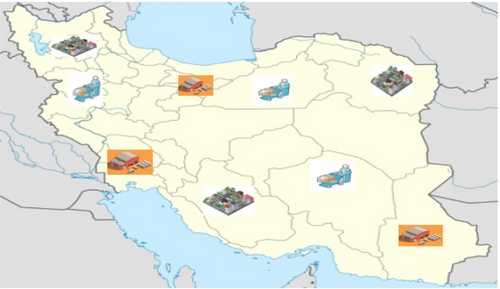
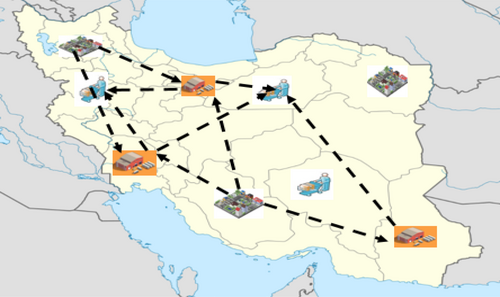
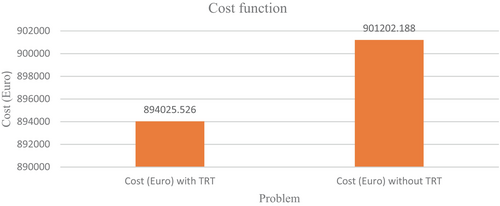
A mathematical model was developed to identify the optimal locations for implementing TRT and emerging technologies in the SC. The model, detailed in Table 2, combines multiple sets of indicators to represent different decision variables and parameters. Three distinct scenarios, including optimistic, pessimistic, and possible, were analyzed to explain different levels of uncertainty. The computational resources used to derive the solution included an Intel(R) Core (TM) i5-3210U CPU operating at a base frequency of 2.50 GHz and a maximum Turbo Boost frequency of 2.50 GHz and 4 GB of RAM. The system ran on a 64-bit operating system. The GAMS modeling language and CPLEX solver were used to determine the optimal solution. Figure 3 and Table 3 show the potential locations of manufacturers, distribution centers, and retailers in Iran. By solving the model using TRT, the optimal locations for deploying TRTs were determined, as shown in Figure 4 and the optimal value is presented in Tables 4 and 5. A comparative analysis was conducted to assess the impact of new TRTs on overall SC performance. The total objective function, which represents the total cost, was calculated to be 894,025.526.
| Problem | Conservative coefficient () | Cost (Euro) with TRT | Cost (Euro) without TRT | Gap (%) |
|---|---|---|---|---|
| P1 | 0 | 773594.322 | 780770.984 | 0.9908 |
| P1 | 30% | 814672.926 | 821849.588 | 0.9912 |
| P1 | 45% | 835212.227 | 842388.889 | 0.9914 |
| P1 | 50% | 842058.661 | 849235.323 | 0.9915 |
| P1 | 75% | 874662.300 | 881838.962 | 0.9918 |
| P1-Main Model | 90% | 894025.526 | 901202.188 | 0.9920 |
| P1 | 1 | 906934.344 | 914111.006 | 0.9921 |
| Problem: P1 | Variables | City | ||
|---|---|---|---|---|
| Manufacturer |
Shiraz 1 |
Tabriz 1 |
Mashhad 0 |
|
| DC |
Ahvaz 1 |
Zahedan 1 |
Tehran 1 |
|
| Retailer |
Semnan 1 |
Kerman 0 |
Hamadan 1 |
| Problem | Binary variable | Positive variable | Free variable | Constraint | Cost (Euro) function | Time (second) |
|---|---|---|---|---|---|---|
| 3.3.3.3.3.3.3.8 | 17 | 1296 | 30 | 1374 | 894025.526 | 1.876 |
| Model | Cost (Euro) with TRT | Cost (Euro) without TRT | Gap (%) |
|---|---|---|---|
| Cost (Euro) | 894025.526 | 901202.188 | 0.99203 |
4.1 Comparison of Models
Implementing new technologies such as TRT in supply chains with a 25% budget allocation for facility creation at each demand level can lead to a 0.1% reduction in P1-TRSSCND costs compared to a model that does not consider these tools. This amount of cost reduction can lead to increased profitability in industries. As shown in Table 5 and Figure 5, the overall performance of the main problem was improved using TRT.
4.2 Conservative Coefficient of Variation
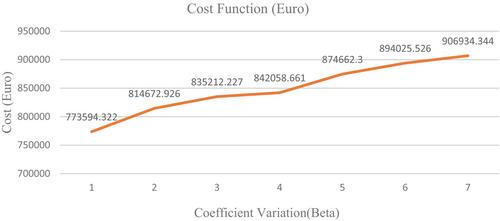
The conservative coefficient () is a measure of the decision-maker's risk aversion, and it can vary between 0 and 1. By adjusting this coefficient, we can simulate different levels of risk-taking behavior. As shown in Table 2 and Figure 6, when the conservative coefficient approaches 1, indicating a higher degree of risk aversion, the associated cost function experiences a marginal increase. Furthermore, if the conservative coefficient remains within a range of 0 to 1%, we observe negligible changes in both cost and computational time.
4.3 Variation in the Number of TRT
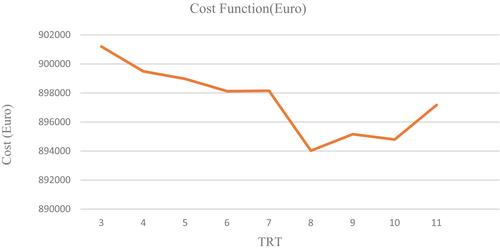
A sensitivity analysis was conducted to assess the impact of varying the number of TRTs on the mathematical model's performance, as illustrated in Table 6 and Figure 7. The results indicate that increasing the number of TRTs from 3 to 8 and from 9 to 11 led to an increase in the cost function. Based on these findings, it can be concluded that a TRT count of 8 optimizes the model's performance.
| Problem | TRT number () | Cost (Euro) | Gap (%) | Time (second) |
|---|---|---|---|---|
| P1 | 3 | 901202.188 | 1.0080% | 0.592 |
| P1 | 4 | 899493.981 | 1.0061% | 0.497 |
| P1 | 5 | 898972.433 | 1.0055% | 0.611 |
| P1 | 6 | 898121.681 | 1.004% | 0.811 |
| P1 | 7 | 898153.077 | 1.0046% | 0.518 |
| P1-Main Model | 8 | 894025.526 | 0 | 1.876 |
| P1 | 9 | 895159.191 | 1.0012% | 0.945 |
| P1 | 10 | 894794.227 | 1.0008% | 0.809 |
| P1 | 11 | 894794.227 | 1.0008% | 0.607 |
4.4 Variation in the Number of Scenarios
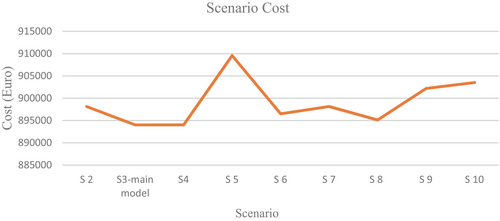
As depicted in Table 7, the costs associated with the gentle slope exhibit an increasing trend as the scenario number increases up to Scenario 5. Beyond this point, the trend reverses, and costs decrease until scenario 8. Subsequently, the costs resume their upward trajectory. Notably, the lowest total cost across the entire SC is observed at scenario level 3 when employing the TRT strategy (refer to Figure 8).
| Scenario | Scenario number () | Cost (Euro) | Gap (%) | Time (Seconds) |
|---|---|---|---|---|
| P1 | 2 | 898135.595 | 1.004 | 0.339 |
| P1-main model | 3 | 894025.526 | 0 | 1.239 |
| P1 | 4 | 894125.366 | 1 | 1.892 |
| P1 | 5 | 909568.647 | 1.017 | 1.156 |
| P1 | 6 | 896502.846 | 1.002 | 3.043 |
| P1 | 7 | 898153.077 | 1.004 | 2.111 |
| P1 | 8 | 895122.293 | 1.002 | 2.581 |
| P1 | 9 | 902186.020 | 1.009 | 2.331 |
| P1 | 10 | 903528.029 | 1.010 | 4.490 |
4.5 Changes Made to the Scale of the Original Model
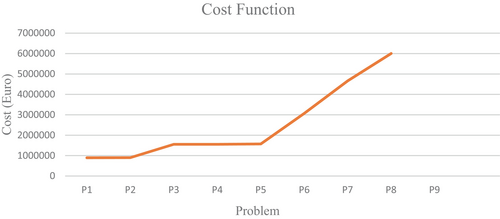
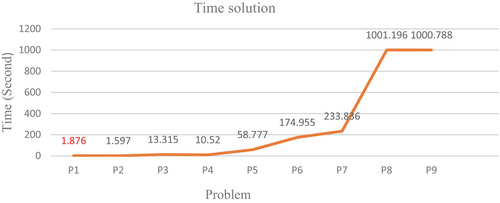
This research identified several large-scale computational challenges, as shown in Figure 9 and detailed in Table 8, where there is a direct correlation between problem scale and computational time and cost. Furthermore, as shown in Figures 9 and 10, the state-of-the-art heuristic, metaheuristic, and novel exact solution techniques to reduce computations reveal exponential growth in solution time for large-scale instances, classifying the problem as NP-hard. To address these complexities, we propose the use of combinatorial payloads to achieve efficient solutions for large-scale problem instances.
| Problem | Binary variable | Positive variable | Free variable | Constraint number | Cost function (Euro) | Time (second) | |
|---|---|---|---|---|---|---|---|
| P1 | 3.3.3.3.3.3.3.8 | 17 | 1296 | 30 | 1374 | 894025.526 | 1.876 |
| P2 | 4.4.4.4.4.4.4.4 | 16 | 3072 | 24 | 1575 | 1553104.097 | 13.315 |
| P3 | 4.4.4.4.4.4.4.12 | 24 | 3122 | 40 | 4679 | 1556008.331 | 10.520 |
| P4 | 4.6.4.4.4.4.4.8 | 22 | 8192 | 32 | 3639 | 1571654.216 | 58.777 |
| P5 | 6.6.6.10.5.3.12 | 30 | 5940 | 20 | 1831 | 3068894.517 | 174.955 |
| P6 | 5.5.7.9.9.3.3.4 | 21 | 12,420 | 24 | 4139 | 4663313.599 | 233.836 |
| P7 | 6.6.6.6.6.6.6.6 | 24 | 7776 | 32 | 7829 | 6004554.758 | 1001.196 |
| P8 | 6.6.6.6.6.6.4.8 | 26 | 20,736 | 32 | 6967 | — | 1000.788 |
| P9 | 20.25.17.32.25.12.10.12 | 74 | 2,115,360 | 52 | 60,236 | — | 806.693 |
4.6 Discussion
This research introduces the TRSSCND model, a novel mathematical framework designed to enhance SC transparency and bolster customer trust within manufacturing enterprises. The model prioritizes transparency, resilience, and sustainability, integrating advanced technologies such as BCT, IoT, and RFID into the SCN design. By leveraging these technologies, SCNs can become more resilient and adaptable to disruptions, ultimately driving organizational growth, improving transparency, and fostering stronger customer relationships. The proposed framework holistically considers factors such as sustainability (CO2 emissions and energy consumption), agility (demand fulfillment and customer satisfaction), flexibility (capacity adjustment based on different scenarios), and SC transparency (through the deployment of Traceability and Transparency Technologies, or TRT). The model incorporates suppliers, manufacturers, diverse technological platforms (IoT, RFID, BCT, and Operational Intelligence, or OI), and customer demand, utilizing a data-driven robust optimization (DDRO) approach to effectively manage uncertainties. Building upon the foundational work of [36, 37], this research further develops the TRSSCND model. A comprehensive sensitivity analysis was conducted to evaluate the model's performance based on changes in the conservative coefficient, the number of scenarios, and the quantity of TRTs. The findings reveal that the TRSSCND model outperforms traditional models, particularly in terms of cost reduction and efficiency improvement. However, it is crucial to determine the optimal number of scenarios, as both underestimation and overestimation can lead to increased costs. To fully leverage the benefits of the TRSSCND model, manufacturing managers are encouraged to adopt innovative technologies that promote transparency, flexibility, and sustainability within their SC networks.
5 Managerial Insights and Practical Applications
Resiliency against environmental disturbances and creating transparency through new technologies TRT is one of the topics that needs more attention from SCM. Attention to TRT and goals such as resilience and durability for the product SC is increasing daily, and customers tend to receive products and services that are sustainable and transparent according to SC requirements. In surveys, many tools and pillars are proposed for SC transparency and sustainability. This research proposes the integration of new technologies, known as TRTs, as a tool for transparency, resilience, and sustainability of SCs at any level of demand. Implementing TRT in the SC requires high fixed costs, and maintenance costs can only be supported by increasing sales and demand. However, certainly, all SCs (SC) are gradually moving towards applying TRTs in their supply network design (SCND), as a transparent SC is necessary to reduce costs and increase trust between SC layers. As SC managers, we must accept this subject and equip SCs with new technologies to increase transparency. The use of TRT can increase confidence building, and we can also research and develop products and increase social welfare.
6 Conclusions
The necessity and importance of transparency in the SC are undeniable. Consequently, we propose a new SCND that leverages new technologies to enhance transparency and flexibility. This SCND encompasses suppliers, distribution centers, retailers, and customers. Each component of the SC seeks to utilize the latest technologies as tools for transparency. We have defined a novel objective function for all decision-makers to increase transparency, flexibility, and model robustness. The first stage determines the capacities, and the second stage determines the flow between SC layers.
- We conducted a comparison of the main problem's performance with and without the utilization of new technologies such as TRTs. The analysis revealed that the incorporation of TRT into the problem-solving approach resulted in a 0.1% reduction in P1-TRSSCND costs compared to a scenario where these tools were not employed. This finding suggests that the use of TRT positively contributed to the overall performance of the original model, as evidenced by Table 3 and Figure 5.
- When the conservative coefficient () changes, it shows that when this value increases, the cost function grows, (can be seen in Table 2 and Figure 7).
- The results indicate that increasing the number of TRTs from 3 to 8 and from 9 to 11 led to an increase in the cost function. Findings suggest that the optimal number of TRTs is 8. To enhance transparency, it is emphasized that this value of TRT should be used. This is demonstrated in (Table 6) and (Figure 7).
- As the number of scenarios increases, costs associated with a gentle slope increase until scenario 5. Beyond this point, the trend reverses, and costs decrease until scenario 8. It is noteworthy that the lowest total cost in the entire SC is observed at scenario level 3 when using the TRT strategy (refer to Table 7 and Figure 8).
- The major problem scale changes this section, and it is evident that the elevation of the model scale results in an increase in both the cost function and computation time. It can be seen that scaling up the model scale leads to longer calculation times and a higher cost function (can be seen in Table 8 and Figures 7 and 8).
One significant research limitation lies in solving the large-scale primary model. Exact algorithms such as Benders decomposition, Swarm intelligence algorithms, Standby algorithms, and metaheuristic algorithms are proposed to be applied to address this. Additionally, resilience, sustainable strategies, and multi-objective considerations, such as the inclusion of backup suppliers and improved node complexity, can be incorporated into the model to enhance resilience and sustainability. Furthermore, robust risk criteria such as Robust Conditional and Entropic Value at Risk (RCVaR and EVaR) are suggested to be considered. The researchers aim to investigate uncertainty methods such as robust and stochastic convex programming to better approximate real-world conditions. The use of robust and novel fuzzy optimization as a data-driven approach has been considered beneficial for risk-averse decision-makers in recent times. Uncertainty methods such as stochastic programming are aimed at being investigated by the researchers to better approximate real-world conditions. The use of robust and novel fuzzy optimization as a data-driven approach has been considered beneficial for SC managers and designers in recent times.
- Develop and Enforce Robust Ethical Guidelines and Regulations: Ethical BCT and IoT development require government and industry collaboration to create comprehensive ethical frameworks and enforceable regulations governing data practices, including informed consent, data minimization, purpose limitation, and data security.
- Prioritize Transparency and Empower User Control: Transparency is key to ethical BCT and IoT systems. Users must understand data collection practices and control their data through clear explanations of data usage, granular consent options, and easy-to-use mechanisms for accessing, correcting, or deleting their personal information.
- Implement Strong Data Security and Privacy Measures: Robust data protection requires strong security measures and Privacy-Enhancing Technologies (PETs). Key elements include encryption, access controls, anonymization, differential privacy, and secure multi-party computation. Regular security audits and penetration testing are crucial for vulnerability identification and mitigation.
- Mitigate Algorithmic Bias and Ensure Fairness: To prevent biased outcomes, algorithms in BCT and IoT systems must be carefully designed and rigorously tested. This involves using diverse and representative training data, employing bias detection and mitigation techniques, and utilizing explainable AI (XAI) to understand algorithmic decision-making. Regular fairness and non-discrimination audits are also essential.
- Establish Clear Accountability and Responsibility Frameworks: Clear lines of responsibility and accountability must be established for data breaches, misuse of BCT and IoT systems, and algorithmic harms. This includes identifying data controllers and processors, defining their obligations, and implementing effective enforcement mechanisms. Independent oversight bodies can play a crucial role in ensuring compliance and protecting individual rights.
Author Contributions
Mansour Bazregar: writing – review and editing, data curation, writing – original draft, funding acquisition, investigation, conceptualization, visualization, methodology, validation, formal analysis. Seyed Ali Reza Derakhshan: supervision, project administration. Nowrouz Nuorollahzadeh: software, formal analysis, resources.
Conflicts of Interest
The authors declare no conflicts of interest.
Open Research
Data Availability Statement
The data that support the findings of this study are available on request from the corresponding author. The data are not publicly available due to privacy or ethical restrictions.


