Fatigue Analysis and Load Spectrum Generation for Wing-Fuselage Lug Joint With a Focus on Human Safety Transport Category Aircraft
Funding: The authors received no specific funding for this work.
ABSTRACT
This research work focuses on fluctuating load spectrum generation and fatigue analysis of a wing-fuselage attachment lug joint, in accordance with the requirements outlined in 14 CFR Part 25 for transport category aircraft. The study involves the generation of a fatigue load spectrum using an exceedance curve, followed by finite element analysis of a simple round-ended lug. The exceedance curve is a statistical tool used to represent the probability of a variable exceeding a particular threshold over a specified time period. It is particularly useful in fatigue analysis as it helps quantify the likelihood of stress levels surpassing critical limits, aiding in the assessment of structural integrity and durability. The CAD model of the lug is created in CATIA, and the corresponding FE model is obtained using Altair HyperMesh. The investigation pertains to a turboprop aircraft weighing approximately 25,000 kg and accommodating 70–90 seats, with ATR 72 and Dash Q 400 being the prominent choices in this category within India. Mission Profiles for these aircraft are obtained from the Directorate General of Civil Aviation (DGCA) website, utilizing scheduled flight data. To ensure the structural integrity of the lug, a static analysis is performed for FE model convergence, leading to the determination of stress concentration factors. Subsequently, fatigue analysis is conducted using Nastran Embedded Fatigue (NEF), considering constant amplitude loading with stress ratios of −1 and 0.1. the fatigue life of the component is predicted based on Goodman and Gerber failure criteria. The analysis yields crucial insights into the fatigue life of the lug and its damage accumulation over time.
1 Introduction
Human safety is a paramount consideration in the design, manufacturing, and maintenance of aircraft. Among the critical factors influencing safety is the fatigue behavior of aircraft components, which can lead to progressive and often undetectable damage under repeated loading conditions [1-3]. Fatigue failures, if not addressed, pose significant risks to structural integrity, potentially compromising an aircraft's operational safety [4-6]. By identifying potential failure points and assessing damage tolerance, fatigue analysis prevents catastrophic failures, thereby safeguarding passengers and crew. This approach underpins the industry's commitment to achieving the highest safety standards while maintaining efficiency and performance [1].
Fatigue analysis is crucial in aircraft design to ensure structural integrity and safety, as it helps predict and prevent potential failures caused by cyclic stresses [7-11]. In addition, it enhances environmental sustainability by optimizing materials and extending component lifespan while maintaining passenger health and safety standards [12-15].
Lug joints, particularly wing-fuselage attachments, are critical elements in aerospace structural applications that provide structural integrity and load transfer between these primary structural components [16, 17]. Understanding the behavior and predicting the fatigue life of lug joints is of utmost importance to ensure the overall reliability and safety of aircraft structures. This research aims to contribute to the existing knowledge by providing comprehensive insights into the behavior of lug joints used for wing-fuselage attachments. The FEA and fatigue analysis results will help validate the structural performance of these critical components, thereby enhancing the overall safety and performance of complex structures [19, 18, 20].
The primary objective of this research is to perform an FEA analysis of lug joints subjected to the load spectrum derived from a specific load exceedance spectrum representative of realistic flight conditions. The construction of this load spectrum is tailored to the unique mission profile data of a specific aircraft. This customization is essential due to the distinct mission profiles that vary among different aircraft, influenced by diverse environmental conditions and operational requirements. By utilizing Altair HyperMesh and MSC Nastran Embedded Fatigue (NEF), the mechanical response of the lug joints under these loads can be simulated and evaluated. The analysis will consider factors such as material properties, geometric configurations, and load distribution as inputs to assess the potential fatigue life and damage of the component accurately.
2 Literature Survey
2.1 Mission Profile Data
The frequencies of operation for ATR 72 aircraft at different sector lengths are obtained from the DGCA website [1]. The data available on the website specifically pertain to the aircraft operations in India by airlines such as SpiceJet, IndiGo, Alliance Air, and TrueJet, as of March 31, 2019.
2.2 Load Spectrum Generation
The AFGROW data hand book [2] provides comprehensive information on the utilization of load exceedance spectra to develop fatigue load sequences. It offers a detailed procedure for deriving load sequences using load exceedance spectra specifically for aircraft wings of various categories. The handbook extensively explains the concepts of number of exceedances and occurrences of a load, which are derived from the mission profile details of an aircraft. The typical load spectrum plot for transport category aircraft is derived from this data handbook for deriving the load spectrum.
2.3 Fatigue Analysis Using the Finite Element Method
The journal article by Shridhar [3] focuses on conducting a fatigue analysis of the wing-fuselage lug section of a transport aircraft. The research commences with a static analysis, considering three different radius ratios of the lug (1.5, 2, and 3) under a test load of 50 kN. The study concludes that the lug with a radius ratio of 3 exhibits lower stress concentration at the hole section compared to the other ratios.
2.4 Importance of Stress Concentration Factor
Peterson's stress concentration factors textbook [4] serves as a valuable resource, offering in-depth insights into the geometric parameters of diverse lug configurations and their consequential effects. This textbook also encompasses essential formulas for determining the stress concentration factor and nominal stresses, particularly applicable to simple rounded lugs.
2.5 Technical Assessment of Fatigue Analysis
Shigley's Mechanical Engineering Design textbook [5] provides a comprehensive exploration of failures resulting from fatigue loading. It extensively covers the properties of stress cycles and their distinct characteristics. In addition, the book thoroughly delves into the concept of fatigue, offering in-depth discussions on design philosophies and failure criteria. This comprehensive coverage has significantly fortified the theoretical foundation of the research [13-17].
3 Methodology
3.1 Mission Profile Data
Table 1 shows the flight frequency and duration of ATR 72 aircraft as provided on the DGCA website. The time for all the mission operations is derived and approximated from the flight schedule documents.
| Sector length (NM) | Cruise altitude (ft) | Cabin differential pressure (psi) | Percentage of total operations (%) | Time (min) | |||
|---|---|---|---|---|---|---|---|
| Taxi (take off) | Mission (climb + cruise + descent) | Taxi (landing) | Total | ||||
| 100 | 15,000 | 2.62 | 2 | 45 | 35 | 30 | 110 |
| 150 | 20,000 | 4.16 | 19 | 45 | 50 | 30 | 125 |
| 200 | 22,000 | 4.8 | 22 | 45 | 64 | 30 | 139 |
| 250 | 25,000 | 5.46 | 27 | 45 | 77 | 30 | 152 |
| 300 | 25,000 | 5.46 | 20 | 45 | 85 | 30 | 160 |
| 350 | 25,000 | 5.46 | 5 | 45 | 96 | 30 | 171 |
| 400 | 25,000 | 5.46 | 4 | 45 | 107 | 30 | 182 |
| 450 | 25,000 | 5.46 | 1 | 45 | 118 | 30 | 193 |
3.2 Exceedance and Occurrence Data
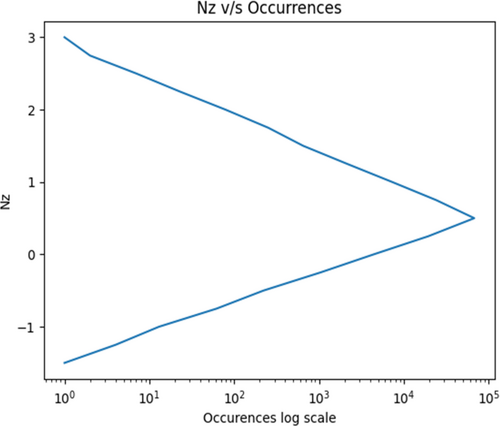
The typical exceedance spectra for a transport category aircraft are derived from the AFGROW data handbook [2]. In this context, the number of occurrences is determined through a stepped approximation method of the spectrum. The accuracy of this approximation in capturing the spectrum shape improves as the discrete load levels become more numerous. To achieve this precision, we employ a step size of 0.25, as outlined in Table 8. The resulting occurrence plot is visually presented in Figure 1, generated using the Matplotlib library.
3.3 Lug Joint Geometry, CAD Model, and Material Properties
According to [3], a radius ratio of 3 was selected for the lug model. The 7075T-6 alloy, which primarily consists of aluminum (87.1–91.4 wt%) and zinc (5–6.1 wt%), was chosen for this lug joint. According to ASTM documentation, aluminum–zinc alloys tend to exhibit superior fatigue life for a lug joint compared to aluminum–magnesium and aluminum–manganese alloys. Furthermore, 7075T-6 demonstrates favorable fatigue strength when compared to aluminum 2024-T351, aluminum 2014-T6, and 2014-T651 alloys. Figure 2 illustrates the CAD model and geometric details of the simple rounded lug. Table 2 contains the mechanical and fatigue properties of aluminum 7075T-6 material.

| Sl. no. | Material properties | Values |
|---|---|---|
| Mechanical properties | ||
| 1 | Young's modulus (E) | 71,700 MPa |
| 2 | Poison's ratio (μ) | 0.33 |
| 3 | Density (ρ) | 0.28335e−9 t/mm3 |
| 4 | Ultimate tensile strength (Sult) | 572 MPa |
| 5 | Yield strength (Sy) | 503 MPa |
| 6 | Shear modulus (G) | 26,900 MPa |
| Fatigue properties | ||
| 7 | Fatigue strength (Se) | 159 MPa |
| 8 | Cycle corresponding to Se | 5E+8 cycles |
3.4 Finite Element Model Mesh Quality and Boundary Conditions
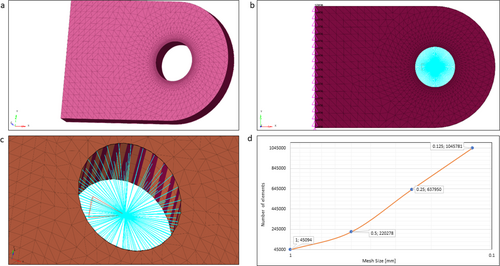
Figure 3a depicts the finite element (FE) model of the round-ended lug, utilizing a solid mesh due to the component's solid nature. A four-noded tetrahedral element is employed, with mesh refinement applied near the lug hole and a mesh transition, as depicted in Figure 3a. The lug pin is simulated using an RBE3 MPC element for a perfectly fitting pin, as shown in Figure 3c. The applied force is axially directed along the x-axis at the MPC node, and the model is effectively constrained in all directions, as shown in Figure 3b,c. As indicated in Table 3, the mesh quality adheres to industry standards, with a maximum tet collapse value above 0.6, indicating an acceptable/good quality mesh. The aspect ratio is maintained within 2.5. Furthermore, Figure 3d portrays a graph demonstrating how reducing the mesh size gradually increases the number of elements. The model used to perform fatigue analysis assumed homogeneous, isotropic, and linear elastic [21] conditions without considering thermal changes [22].
| Sl. no. | Parameters | Values | |||
|---|---|---|---|---|---|
| 1 | Mesh size | 1 mm | 0.5 mm | 0.25 mm | 0.125 mm |
| 2 | No. of elements created | 45,094 | 2,20,278 | 6,37,950 | 10,45,781 |
| 3 | Maximum aspect ratio | 1.98 | 2.01 | 2.13 | 2.38 |
| 4 | Maximum equiangular skew | 0.728335 | 0.73161 | 0.75935 | 0.798535 |
| 5 | Minimum Jacobian | 1 | 1 | 1 | 1 |
| 6 | Minimum tetra collapse | 0.725465 | 0.700693 | 0.695846 | 0.682002 |
| 7 | Minimum tria face angle | 35.31 | 35.45 | 30.61 | 29.53 |
| 8 | Maximum tria face angle | 100.01 | 100.21 | 111.23 | 115.30 |
3.5 Stress Concentration Factor Prediction
3.6 High Cycle S-N Life Prediction
3.7 Fatigue Load Spectrum Generation
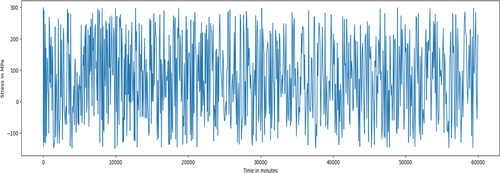
In this research, we aim to create a fluctuating stress cycle-based fatigue load spectrum. To visualize this dynamic load spectrum, we employ Python scripts within the Jupyter Lab notebook, leveraging the Pandas and Matplotlib libraries. The methodology involves calculating occurrences from the exceedance spectra using a discrete but manageable number of data points. It is important to strike a balance and do not want an excessive number of points. This is because, for plotting stress points against time (i.e., number of cycles), we employ a randomization function. If we have too many points, it can result in an overwhelming number of combinations of random numbers, based on load factor occurrences within the specified time frame (i.e., for the estimated number of cycles).
4 Results and Discussion
4.1 Stress Convergence Study
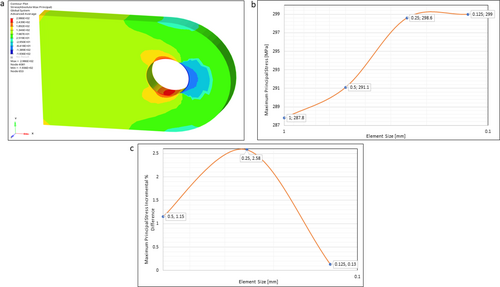
A static analysis is performed on four FE models with varying mesh refinement sizes of 1, 0.5, and 0.25 mm. A load of 150 kN is applied at the MPC node, and the resulting maximum principal stress is recorded. Table 4 presents the maximum stress values for each mesh size element. The model converges at a mesh size of 0.125 mm, with an incremental stress difference of 0.13%. For further analysis, the model with a mesh size of 0.25 mm is chosen as it has fewer elements than the 0.125 mm mesh size. The stress plot for mesh size 0.25 mm is shown in Figure 4a. Figure 4b,c show the plots of element size, maximum stress, and its incremental difference, respectively.
| Mesh size (mm) | Maximum principal stress (MPa) | Vonmises stress | Displacement (mm) | Maximum principal stress incremental % difference |
|---|---|---|---|---|
| 1 | 287.8 | 309 | 0.2229 | — |
| 0.5 | 291.1 | 319.3 | 0.2229 | 1.15 |
| 0.25 | 298.6 | 339.4 | 0.2219 | 2.58 |
| 0.125 | 299 | 341 | 0.2219 | 0.13 |
4.2 Stress Concentration Factor (Kt)
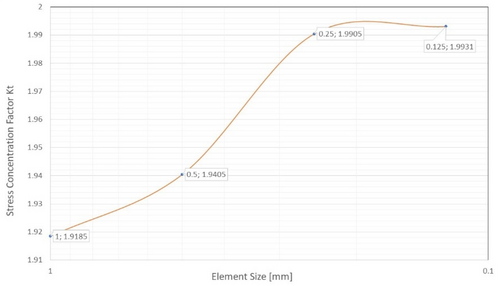
Table 5 and Figure 5 present the results of the convergence study conducted on the stress concentration factor for the FE lug model. The Kt value is found to converge from 1.9185 to 1.9931, with a decrease in the incremental percentage difference of Kt to 0.0013 when the mesh size is set to 0.125. therefore, based on the FE analysis, Kt is determined as 1.99 (rounded to two decimal places).
| Element size (mm) | Maximum principal stress (MPa) | Applied nominal stress (MPa) | Stress concentration factor (Kt) | Stress concentration factor (Kt) incremental % difference |
|---|---|---|---|---|
| 1 | 287.8 | 150.015 | 1.9185 | — |
| 0.5 | 291.1 | 150.015 | 1.9405 | 1.1467 |
| 0.25 | 298.6 | 150.015 | 1.9905 | 2.5767 |
| 0.125 | 299 | 150.015 | 1.9931 | 0.0013 |
4.3 Fatigue Life Prediction and Correlation Using S-N Approach
Node 4081, located near the lug hole, exhibits the maximum stress within the finite element method (FEM) model. The fatigue analysis will be focused on the elements surrounding this region. Considering the ultimate load factor of 3g and a factor of safety of 1.5g, static analysis will be performed on the FEM model with a load of 150 kN. Based on the material fatigue parameters provided in Table 2, an S-N life exceeding 5E+08 cycles is considered to be infinite. Table 6 compares the analytically predicted and FE-predicted S-N life values, based on the Goodman and Gerber Criteria, for stress ratios −1 and 0.1, respectively. Figure 6 illustrates the fatigue analysis plots.
| Sl no. | Load applied at the MPC node (kN) | FE analysis maximum stress (MPa) | Stress ratio | Fatigue life calculations | ||
|---|---|---|---|---|---|---|
| Analytically calculated life (cycle) | NEF life (cycle) for 99.9% certainty of survival | Percentage error % | ||||
| Based on Goodman criteria | ||||||
| 1 | 150 | 298.6 | −1 | 2.37E+04 | 2.31E+04 | 2.6 |
| 2 | 150 | 298.6 | 0.1 | 3.64E+05 | 3.61E+05 | 0.83 |
| Based on Gerber criteria | ||||||
| 3 | 150 | 298.6 | 0.1 | 1.63E+06 | 1.59E+06 | 2.52 |
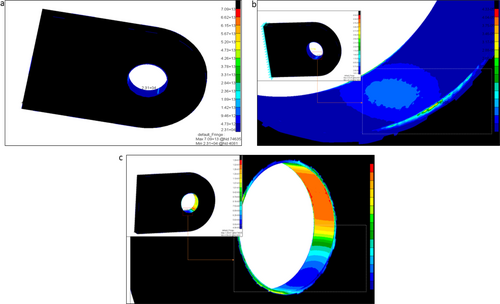
When The stress ratio is −1, the fatigue life determined by the Gerber failure criteria will be identical to that obtained using Goodman criteria since the mean stress is zero. Figure 6a–c illustrate the fatigue results for the elements adjacent to the lug hole region under an applied load of 150 kN. In Figure 6a, the fatigue life results based on Goodman criteria are shown, with node 4081 exhibiting the lowest fatigue life of 2.31E+04. Figure 6b illustrates the fatigue damage results, with node 4081 having the highest damage value of 4.33E−05. In addition, Figure 6c displays the log life results, revealing that node 4081 has a minimum log life of 4.36.
4.4 Fatigue Load Spectrum
The fatigue load spectrum is generated in a dynamic format by utilizing exceedance spectra data for a transport category aircraft. Specifically, we employ mission profile data from Table 1 for the ATR 72 aircraft to determine the number of cycles, the duration of each cycle, and the total duration, all with respect to a 1000-h flight. Table 7 presents a total duration for all flight sectors of approximately 995.89 h, which can be approximated as 1000 h. This approximation highlights the accuracy of our calculations for estimating the number of cycles and the duration of each cycle. This data analysis process is based on the information contained in Tables 7 and 8. Figure 7 displays a one block of the load spectrum for a 1000-h flight, offering a visual representation of the dynamic load variations experienced by the aircraft during its operational mission.
| Serial no. | Sector length | Percentage of operation % | Number of cycles | Duration of each cycle (min) | Total duration (h) |
|---|---|---|---|---|---|
| 1 | 100 | 2 | 11 | 110 | 20.17 |
| 2 | 150 | 19 | 91 | 125 | 189.58 |
| 3 | 200 | 22 | 95 | 139 | 220.08 |
| 4 | 250 | 27 | 106 | 152 | 268.53 |
| 5 | 300 | 20 | 75 | 160 | 200 |
| 6 | 350 | 5 | 17 | 171 | 48.45 |
| 7 | 400 | 4 | 13 | 182 | 39.43 |
| 8 | 450 | 1 | 3 | 193 | 9.65 |
| Total | 411 | 995.89 | |||
| Load factor (nz) | Exceedances | Occurrences | Stress (MPa) |
|---|---|---|---|
| 3 | 1 | 1 | 298.62 |
| 2.75 | 5 | 4 | 273.74 |
| 2.5 | 18 | 13 | 248.85 |
| 2.25 | 80 | 62 | 223.97 |
| 2 | 302 | 222 | 199.08 |
| 1.75 | 1343 | 1041 | 174.2 |
| 1.5 | 5756 | 4413 | 149.31 |
| 1.25 | 25,137 | 19,381 | 124.43 |
| 1 | 92,808 | 67,671 | 99.54 |
| 0.75 | 34,521 | 24,063 | 74.66 |
| 0.5 | 10,458 | 7290 | 49.77 |
| 0.25 | 3168 | 2153 | 24.89 |
| 0 | 1015 | 651 | 0 |
| −0.25 | 364 | 252 | −24.89 |
| −0.5 | 112 | 79 | −49.77 |
| −0.75 | 33 | 23 | −74.66 |
| −1 | 10 | 7 | −99.54 |
| −1.25 | 3 | 2 | −124.43 |
| −1.5 | 1 | 1 | 149.31 |
5 Conclusion
Stress convergence in the FE model was achieved at a mesh size of 0.125 mm, resulting in a maximum principal stress of 299 MPa and a final incremental difference of 0.13%. The converged model exhibited a stress concentration of 1.99 with a final incremental difference of 0.0013%. Consequently, a 0.25 mesh size model was considered for further analysis, which saved time for both static and fatigue analysis. In addition, further research is to be conducted to determine the stress concentration factor analytically using “Peterson's Stress Concentration” plots for perfectly fit pins. The life of the lug joint for constant load of 150 kN (3g) is 23,000 flights. But the lug does not experience a constant load but a fluctuating load condition. Hence a crack growth model is to be developed to perform damage tolerance analysis using the fluctuating load spectrum obtained. Software's like Nasgro and FRANC 3D can be used for this type of fluctuating loading sequence for further research to complete the F&DT analysis. NEF does not have variable loading sequence interface. The developed load spectrum contains 411 stress cycles considered as one block for a 1000 h flight.
Nomenclature
-
- E
-
- Young's Modulus of the material, N/mm2 or MPa
-
- μ
-
- Poisson's ratio
-
- ρ
-
- density of the material, t/mm3
-
- Sult, Sy, and Se
-
- ultimate tensile strength, yield strength, and endurance limit or fatigue strength of the material, respectively, MPa
-
- G
-
- shear modulus of the material, MPa
-
- H, d, and h
-
- width, diameter, and thickness of the lug respectively, mm
-
- Kt
-
- stress concentration factor
-
- P
-
- applied load, N
-
- σmax, σnom, σm, and σa
-
- maximum stress, nominal stress, mean stress, and stress ratio of the component, respectively, MPa
-
- n
-
- factor of safety
-
- f
-
- fatigue strength fraction
Author Contributions
Rajadurai Murugesan: investigation, formal analysis, data curation, writing – original draft. Srikanth Holalu Venkataraman: writing – review and editing, software, visualization. Pradeep Kumar Sahoo: writing – review and editing, resources, supervision. Praveena Bindiganavile Anand: conceptualization, methodology, supervision. Rithick Rithick: conceptualization, writing – review and editing, methodology. Muhammad Imam Ammarullah: writing – review and editing, validation, project administration.
Acknowledgments
The authors gratefully thank the authors' respective institutions for their strong support in this study. The authors declare the use of generative artificial intelligence (AI) and AI-assisted technologies to improve the readability and language of this article.
Ethics Statement
The authors have nothing to report.
Consent
The authors have nothing to report.
Conflicts of Interest
The authors declare no conflicts of interest.
Open Research
Data Availability Statement
The necessary data used in the manuscript are already present in the manuscript.


