Thermal Investigation of a Solar Collector Using an Efficient Computational Technique
ABSTRACT
The thermal efficiency of a flat-plate solar collector is theoretically analyzed in this study. For this purpose, a novel computational technique called the Akbari-Ganji method (AGM) is applied. The solution function derived using this method is examined for three different cases, including four-term, six-term, and eight-term approximations. To validate the proposed method, the obtained results are compared with those from a published work, showing very good agreement. The thermal efficiency of the collector is comprehensively assessed under the influence of collector length, effectiveness coefficient, and heat loss coefficient. The results reveal that an increase in the effectiveness coefficient enhances the collector's thermal efficiency.
1 Introduction
Solar energy has emerged as a promising renewable energy source, with solar collectors playing a crucial role in converting solar radiation into thermal energy. Enhancing the thermal efficiency of these collectors has been a key research focus, particularly through the use of nanofluids and innovative structural modifications.
The integration of nanofluids as working fluids in solar collectors has been extensively studied due to their superior thermal properties compared to conventional fluids. Ghasemi and Ranjbar [1] conducted a computational fluid dynamics (CFD) analysis on the thermal performance of parabolic trough collectors (PTCs) using nanofluids, demonstrating significant enhancements in heat transfer and efficiency. Another approach involved the evaluation of solar rings inside tubes, which further improved heat retention and fluid temperature distribution [2]. Ghasemi and Ranjbar [3] proposed the inclusion of porous rings within PTC tubes to improve heat transfer efficiency. Their numerical simulations indicated that these structural enhancements could lead to substantial gains in overall collector performance. A subsequent study explored the effects of different nanofluid compositions on PTC efficiency in solar thermal power plants, confirming their potential in improving thermal performance [4]. Recently, a novel circular tube design with enhanced thermal performance characteristics was investigated by Ghasemi [5], demonstrating improvements in hydrothermal behavior and heat transfer efficiency for solar collector applications. Ghasemi et al. [6] further investigated the heat transfer behavior of nanofluid-based PTCs using an Eulerian two-phase approach, emphasizing the importance of particle-fluid interactions in optimizing heat transfer rates. Similarly, the influence of solar radiation on magnetohydrodynamic (MHD) stagnation point flow and heat transfer in nanofluids over a stretching sheet was analyzed, highlighting the complex interplay between solar flux and fluid dynamics [7]. Vahidi et al. [8] conducted an analytical study on photovoltaic (PV) systems, assessing different rates of absorbed photon energy and emitted electron energy to optimize efficiency. This study highlights the necessity of considering not only thermal enhancements but also electronic efficiency improvements in solar energy applications. Dabiri et al. [9] conducted a parametric investigation of a trapezoidal cavity receiver in a linear Fresnel solar concentrator, highlighting the influence of receiver geometry on heat absorption efficiency. Mozafarifard et al. [10] extended this research by introducing a time-fractional single-phase-lag model for anomalous heat conduction in solar collector absorber plates, demonstrating the importance of time-dependent heat diffusion mechanisms. Additionally, Shi et al. [11] examined the impact of pitch angle, wind velocity, and two-axis tracking systems on the thermal performance of parabolic trough collectors, emphasizing the role of dynamic environmental conditions.
Akbar et al. investigated heat transfer enhancement using ternary hybrid nanofluids in a cross-viscosity model. This study incorporated the Levenberg–Marquardt neural network approach to assess entropy generation, revealing the efficacy of intelligent computing in optimizing thermal performance [12]. Similarly, another study by Akbar et al. explored the simulation of hybrid boiling nanofluid flow through a porous stretching sheet, employing artificial neural networks to analyze convective boundary conditions. The findings demonstrated the potential of hybrid nanofluids in improving thermal energy management [13]. Extending this research, Alghamdi et al. examined the double-layered combined convective heated flow of Eyring-Powell fluid across an elevated stretched cylinder. Their work applied an intelligent computing approach, reinforcing the role of computational models in enhancing fluid behavior predictions [14]. Another notable contribution by Alghamdi et al. focused on neural intellectual computing systems to analyze thermally stratified mixed convective micropolar liquid in the presence of thermal diffusive nanofluids. This research highlighted the significant interplay between heat transfer, fluid mechanics, and computational intelligence [15].
Further exploration into artificial intelligence and thermal energy analysis was conducted by Shah et al., who utilized artificial neural networks and particle swarm optimization to study heat transfer in partially ionized hyperbolic tangent materials with ternary hybrid nanomaterials. Their results indicated that AI-driven optimization techniques are instrumental in improving energy efficiency in complex fluid systems [16].
Beyond conventional heat transfer, Akbar et al. investigated biological structural studies, particularly in blood Casson fluid flow within catheterized, diverging tapered stenosed arteries. Their study introduced emerging shaped nanoparticles for drug delivery applications, bridging thermal fluid dynamics with biomedical engineering [17]. Another study in microfluidics by Akbar et al. analyzed microbic flow in nanofluids with chemical reactions inside microchannels with flexural walls. Their findings contributed to a better understanding of thermophoretic diffusion and its implications in microfluidic systems [18].
Additionally, Akbar et al. examined the electro-osmotically interactive behavior of thermally stratified micropolar nanofluids containing Copper and Silver nanoparticles in microchannels. This research demonstrated the feasibility of manipulating thermal and electrokinetic effects for advanced nanofluid applications [19].
Reviewing previous studies reveals that the efficiency of air-heating solar collectors has rarely been investigated. Another innovation of this study is the use of a novel and efficient method to solve the problem's nonlinear equation. The accuracy of the applied solution method and the obtained results are assessed by comparing them with numerical solutions and findings from previous research. Additionally, the impact of key parameters on variations in collector efficiency is analyzed and examined.
2 Description of the Problem
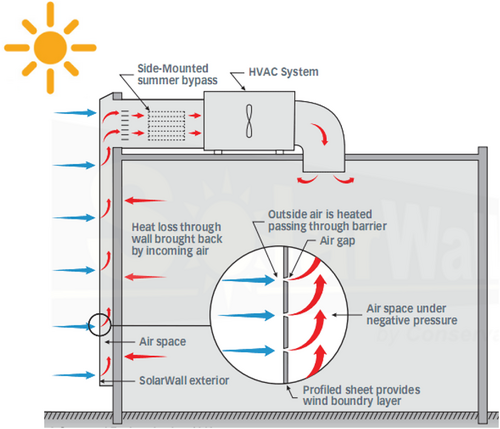
Figure 1 shows a schematic of the solar air heating collector system, including the absorber plate, transparent cover, and heat transfer mechanisms within the collector [20].
In addition, the control volume of the solar collector is illustrated in Figure 2 [21, 22].
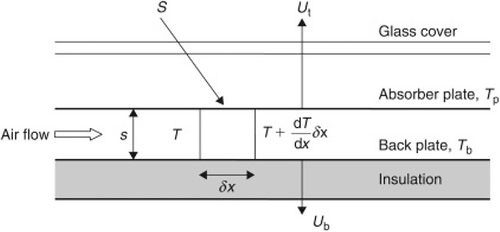
Also we have T = Ti at x = 0 as the initial condition.
3 Solution Methodology and Code Validation
To solve nonlinear problems, various numerical and analytical methods can be used, depending on the type of problem and the relevant boundary conditions [23-38]. To solve the governing equation and analyze the outcomes, the AGM scheme is utilized. The fundamentals of the applied technique were explained in references [39, 40].
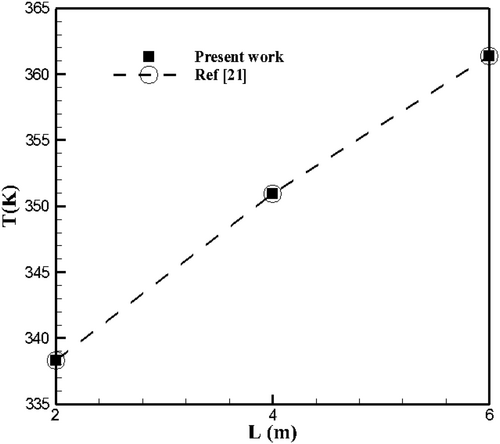
To validate the AGM solution, the temperature values were compared with those of reference [21] in Figure 3. This figure indicates a good agreement between the current results and the findings of reference [21].
4 Results and Discussion
In this section, to better evaluate the results, we first solve the problem using the AGM method with 4-term and 6-term approximations and analyze the error of the obtained solutions compared to the numerical method.
Now, for each of the three solution states obtained, error graphs are plotted relative to the numerical solution.
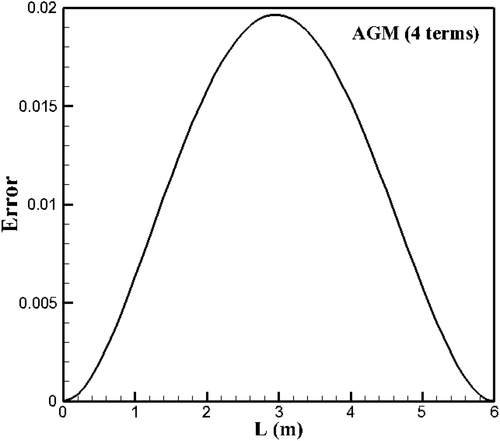
Figure 4 shows the error values of the temperature function obtained using the AGM method (with four terms) compared to the numerical solution for different values of the length. As seen in this figure, the error graph for the four-term case initially exhibits an upward trend and then decreases.
Also, the error variation for the temperature field is presented in Figure 5. By evaluating Figure 5, it can be observed that the temperature results obtained using the AGM method (with six terms) exhibit a significantly smaller error compared to those in Figure 4.
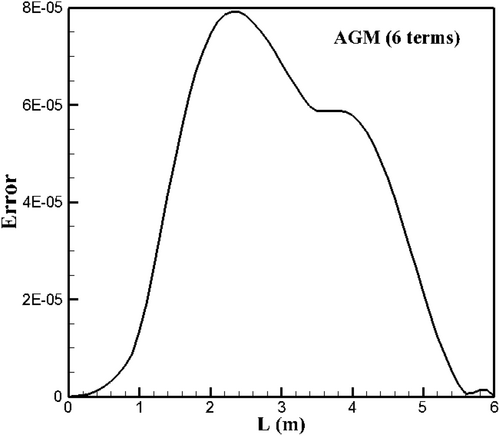
Additionally, Figure 5 shows that the trend of error variation with respect to length initially increases, then decreases, followed by another increase and a subsequent decrease.
Furthermore, Figure 6 shows the error values of the temperature function obtained using the AGM method (with eight terms) compared to the numerical solution results. As seen in this figure, the trend of the error graph with respect to length changes follows a pattern in which the error remains almost constant initially, then increases, decreases, and subsequently increases and decreases again.
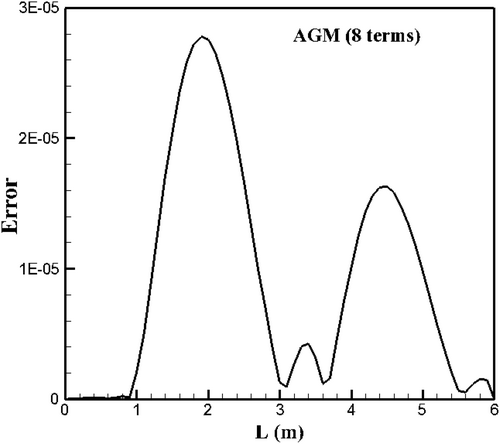
Finally, based on the explanations given for Figures 4-6, it can be concluded that the error values in the 8-term AGM solution are lower than those in the 4-term and 6-term solutions. Consequently, the solution obtained with eight terms is more accurate.
The effect of changes in the effectiveness coefficient on thermal efficiency along the length of the collector is shown in Figure 7. By examining this figure, it can be observed that thermal efficiency increases as the effectiveness coefficient increases. For example, when L = 2 m, increasing the effectiveness parameter from 0.8 to 0.9 increases the collector efficiency by about 17%.
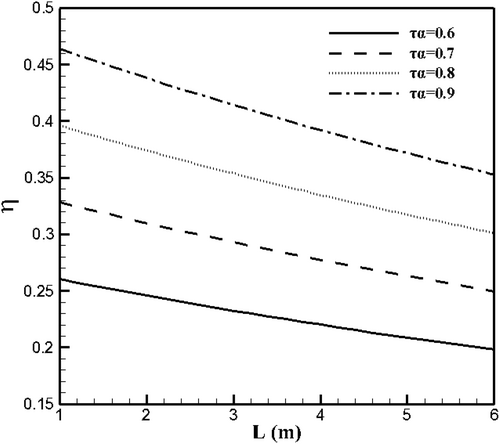
Additionally, Figure 7 shows that the thermal efficiency graph, as a function of collector length for different values of τα exhibits a decreasing trend.
In Figure 8, the thermal efficiency graph of the collector is plotted under the influence of different values of the heat loss coefficient. As seen in this figure, an increase in the heat loss coefficient leads to a decrease in thermal efficiency. In other words, the lower the heat loss, the higher the thermal efficiency. For example, when UL = 5.5, by increasing the L parameter from 1 to 6 m, a 24% reduction in thermal efficiency is observed.
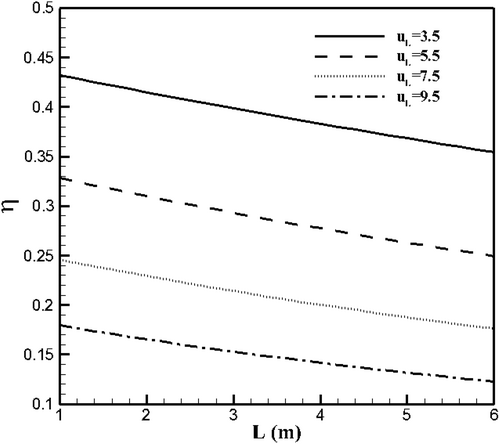
Another observation from this figure is that for each value of the heat loss coefficient, the thermal efficiency graph decreases along the length of the collector.
5 Conclusion
- The validity of the proposed method was confirmed by comparing the analytically derived temperature distribution function with a previous study's results.
- When the L parameter increases from 1 to 6 m, a 24% reduction in thermal efficiency is observed when UL = 5.5.
- The accuracy of the solution obtained using the AGM method with eight terms was higher than that of the four-term and six-term solutions.
- Increasing the effectiveness parameter from 0.8 to 0.9 increases the collector efficiency by about 17% (when L = 2 m).
Nomenclature
-
- Ac
-
- cross-sectional area of thechannel
-
- a,b
-
- constants in temperature variable cp
-
- cp
-
- specific heat at constant pressure
-
- Cn
-
- constants in applied methods
-
- D
-
- hydraulic diameter of the channel
-
- F′
-
- collector efficiency factor
-
- Gt
-
- total insolation
-
- AGM
-
- Akbari-Ganji method
-
- h
-
- convection heat transfer coefficient
-
- CFD
-
- computational fluid dynamics
-
- k
-
- thermal conductivity
-
- L
-
- length of collector plate
-
- m•
-
- air mass flow rate
-
- p
-
- a small parameter
-
- Qu
-
- useful collected heat
-
- PTC
-
- parabolic trough collector
-
- Rg
-
- gas constant
-
- Re
-
- Reynolds number
-
- s
-
- depth of air flow section
-
- S
-
- absorbed solar radiation per unit area
-
- T
-
- temperature
-
- UL
-
- heat loss coefficient
-
- V
-
- flow velocity
-
- W
-
- width of collector plate
Subscripts
-
- a
-
- air
-
- b
-
- back plate
-
- p
-
- absorber plate
-
- r
-
- radiation
-
- c
-
- convection
-
- i
-
- inlet condition
-
- o
-
- outlet condition
Greek Symbols
-
- δx
-
- an element in the x direction
-
- ρ
-
- density
-
- μ
-
- dynamic viscosity
-
- α
-
- absorptivity
-
- τ
-
- transmittance
-
- η
-
- collector efficiency
Author Contributions
S. E. Ghasemi: investigation, validation, writing – original draft. J. Vahidi: software, writing – review and editing, methodology.
Conflicts of Interest
The authors declare no conflicts of interest.
Open Research
Data Availability Statement
Data sharing not applicable to this article as no datasets were generated or analysed during the current study.


