Dynamic Performance Investigation of Solar-Driven Vapor Absorption Cooling System for Urban Areas
Funding: The work presented in this publication was made possible by grant QUPD-CENG-23/24-537 from the Qatar University.
ABSTRACT
Solar energy in urban areas due to excessive air conditioning usage in buildings may significantly reduce the consumption of fossil fuels. This study uses TRNSYS to undertake the thermal performance analysis of solar-driven vapor absorption cooling systems for several urban cities in Pakistan with varying climatic conditions. Two separate solar collectors—flat plate collector (FPC) and evacuated tube collector (ETC)—are used to simulate the cooling system. The system's performance is evaluated based on the solar fraction (SF) and primary energy savings. The results of simulation showed that ETC would be a better choice regarding the selection of solar collector as the system with ETC achieved a higher SF and primary energy saving (). The SF ranges from 13% to 78% and 13% to 64% for ETC and FPC, respectively. The primary energy saving ranges from 75% to 93% and 75% to 96% with flat plate and ETC, respectively. For both flat plate and ETCs, increasing the collector area increased the SF and primary energy savings while increasing the capacity of thermal storage decreased the SF and primary energy savings. For varying thermal storage volumes, the SF varies very little when using flat plate collector but significantly when using ETC. The best thermal performance was recorded in Peshawar based on the SFs and primary energy saving.
1 Introduction
Extensive electricity use in urban areas by the high demand for cooling during the summer increases the electrical load. The electrical dilemma that several nations are experiencing worsens in the summer, necessitating the search for alternate cooling methods because conventional vapor compression air-conditioning technologies are used to cool majority buildings [1]. These traditional technologies are notorious for consuming a lot of energy. They also employ chlorinated fluorocarbons, which erode the ozone layer and eventually trigger global warming [2]. In view of the fact that solar energy is accessible everywhere and generates both electrical and heat energy [3] and because of the favorable relationship involving the peak cooling load with solar radiation intensity, solar energy is constantly growing in importance for comfort chilling of buildings [4, 5]. Therefore, Photovoltaic (PV) and solar thermal (ST) based systems have emerged as effective solutions [6]. The market currently offers various solar cooling methods, the most advanced of which are the liquid/solid desiccant, absorption systems and, solid adsorption [7]. Furthermore, another solar-powered vapor absorption system that has been developed and tested is one which uses PV panels. However, regular cleaning of the panels is essential to maintain their efficiency due to the negative impact of dust accumulation on their performance [8]. Additionally, solar driven vapor absorption systems have also started being used for processes such as milk chilling, with an overall energy efficiency ratio of 4.55, which is better than conventional vapor compression systems [9]. Utilizing such technologies will reduce electricity usage, which will reduce fossil fuel consumption and emissions of greenhouse gases [10, 11]. Solar cooling systems are currently not very popular since they are more expensive than conventional ones. However, when their performance is improved, the dimension of the collector along with manufacturing costs will be decreased, which will naturally reduce the cost of the complete system [12]. Different alternative design options and control tactics are studied in order to enhance the system's performance. With the advent of simulation technologies based on equation solvers over a long period of time, performance prediction can be assessed for such systems. TRNSYS is an advanced simulation program that simulates and predicts the ephemeral implementation of various energy structures using known analytical and differential correlations. Over the years, several researchers have used TRNSYS to model and simulate the extended-period strategy and time step response of solar-driven cooling techniques. For example, Salameh et al. [13] used TRNSYS software to simulate and optimize a solar-powered absorption cooling system based on LiBr-H2O for a house in the United Arab Emirates. Khan et al. [14] implemented the simulation of a single-impact solar-equipped cooling scheme established on the results of a performance test for two configurations in TRNSYS. The stratified thermal storage tank in arrangement 1 receives the operating fluid return from the absorption chiller's generator. If the operational fluid temperature in the storage tank is not always as precise as the required temperature, configuration (C-2) permits it to be segregated from the collector storage tank loop and transported directly into the auxiliary boiler. In Configuration-1 (C-1), the working fluid from the absorption chiller consistently flows toward the common hot storage tank shared with the solar collector whereas in Configuration-2 (C-2), if the temperature of the fluid in the storage tank falls below the required 110°C, the working fluid from the absorption chiller can bypass the collector-storage tank loop and be directly supplied to the auxiliary boiler. The findings demonstrated that over the course of the entire summer, C-2 produced relatively larger savings than (C-1). Stanciu et al. [15] assessed the functioning of an ammonia-water solar vapor absorption refrigeration system. According to the author's findings, the parabolic dish collector space with a 16 m3 storage tank whose scope had been computed at 10°C of evaporator temperature was 10 m, 2.9 m for longest uninterrupted operation of NH3-H2O chilling machine (between 9 AM and 05:10 PM). Stanciu et al. [16] tested the effectiveness of a parabolic channel collector and thermal storage tank unit for one full working day to imitate single effect water-lithium bromide absorption chiller of a solar-aided cooling/refrigeration appliance. They mentioned two viable PTCs (parabolic trough collectors), for the installation of the solar panel. The best technique for the case under investigation, according to the findings, was to utilize industrial PTC 1800 creditors engaged in the recovery with an established storage tank with limits of 90 and 140 kg. The calculations showed that operation time is shorter on windy days (5 ms−1) from 09:00 to 17:40 due to vital strength shortfalls within PTC. Sokhansefat et al. [17] employed Transient system simulation software to conduct a parametric observation of a solar absorption of five tones in Tehran in order to determine the optimal configuration under transient conditions. He also looked at how several factors affected how well the solar absorption refrigeration cycle worked, and their optimum results are presented. According to the findings, the thermal system might increase performance by 28%. The ideal parameters are 55 m2 for the collector area, 1 m3 for the storage tank volume, 77°C for the auxiliary boiler's temperature, 1000 kgh for the mass flow rate via the solar collector, and a slope of 33° for the collector.
Anatonopoulos and Rogdakis [18] used ammonia—lithium nitrate and ammonia—sodium thiocynate to calculate the efficiency of absorption heat pumps. The findings disclosed that NH3-LiNO3 was more effective heating agent than NH3-NaSCN because it offers greater heat addition concern and more potential thermal power used to achieve better coefficient of performance. Ishak et al. [19] presented in-depth study of current jet impingement solar collectors in this article. The design and functionality of the jet impingement cooling techniques on PV, PV thermal, and solar air collector systems are also covered. The heat transfer characteristics of jet impingement are greatly subjective by the nozzle's stream wise and span wise pitch, target spacing to nozzle, nozzle diameter and shape, and Reynolds number. A two pass solar collector performs superior thermally than a single pass collector because of the absorber plate's greater rate of heat abstraction and the more considerable interface brought about by the doubled heat transfer surface. Luqman Azeez et al. [20] investigated experimental exergy and energy performance of innovative solar collector design. They included a dimpled and pelated array surface for absorber tube and use of SiC nanophase change and channeling SiC-based material and nanofluid. Increasing mass flow rates have a positive impact on output parameters while solar irradiance showed a positive trend till 1000 W/m2 and trend reversed after that. Maximum power output of 27.14 W was achieved with 0.6% SiC nanophase changing material. Agrouaz et al. [21] modeled solar based cooling system in numerous Moroccan cities, and unsurprisingly, Errachindia city achieved the finest yearly SF and coefficient of performance value of 0.33. In other places, COP values ranged from 0.13 to 0.31 over the course of the year.
The traditional working combinations in commercial absorption cooling systems are water—lithium bromide and ammonia—water because of their thermodynamic properties, including the better COP obtained by H2O-LiBr than NH3-H2O system, not with standing crystalline issues. The advantages of the ammonia—lithium nitrate and ammonia—sodium thiocynate systems over NH3-H2O include their capacity to function as both an air conditioner and a refrigerator [22]. Gorgio and Knower [23] conducted an energy and exergy assessment for cooling machines using water-lithium chloride and lithium bromide-water under identical working conditions. They discovered that the water-lithium chloride scheme had a higher COP than the lithium bromide-water system, even though LiCl and H2O crystallize differently depending on the temperature of the surroundings. This study's goal was to perform a thermodynamic investigation of an absorption refrigeration system using traditional refrigerant and absorbent mixture (water-lithium bromide, ammonia-water) and novel (ammonia—lithium nitrate, ammonia—sodium thiocynate and water—lithium chloride) blends, realistic varieties created on the coefficient of performance, and restrictions on the crystallization of the solution for transient situations. Singh et al. [24] the four-shape spreading cutting cone (FSCC) of smooth tube is proposed in this study, which has an important engineering prospect for enhancing heat transfer and energy efficiency of heat exchangers. Numerical simulations (4000 ≤ Re ≤ 32,000) investigate FSCC influences on Nusselt number, friction factor, and thermal performance (TPEC) across different perforations (N = 0, 2, 3) and pitch ratios (P/Din = 2.5–5.5). FSCC creates vortex flow and mixing for enhancing performance of the heat exchanger, presenting a maximum TPEC of 2.44 under Re = 4000 and P/Din = 3.5. Abed et al. [25, 26] carried out the modeling and experimental performance investigation of solar collector and geothermal assisted hybrid evaporative cooling and air-conditioning system and found that the passive cooling system is found to maintain room temperature between 2° and 6°C below the ambient. Singh et al. [27] in this study conducted numerical assessments of pedestrian wind comfort against high-risers' shapes through CFD models and the LES method. Constant channel widths and wind conditions were then analyzed for five building shapes (square, rectangular, circular, hexagonal, octagonal). Circular buildings had less wind separation and less wind channel space than square or rectangular-shaped buildings and therefore had better wind comfort for pedestrians. The main factors related to wind dynamics are their shape, the wind direction, turbulence and channel flow. Kadyan et al. [28] used HACABO and GARIC reasoning-based intelligent control method for an evacuated tube collector (ETC) that was linked with 5 kW solar vapor absorption cooling system. He calculated the ETC's performance using the GARIC technique using data on solar irradiation for Haryana, and then utilized the HACABO control approach to maximize its efficiency. He concluded that by using the HACABO method, COP of VARS could be improved by 0.82% as linked to further contemporary correlated model. Kaneesamkandi et al. [29] utilizing three distinct climate zones and a variety of cooling loads, single and double impact VARS were tested. Compound parabolic concentrators were the most effective and economical ST technology for running double effect vapor absorption systems, whereas flat plate collectors (FPC) were the best performer for single effect VAR systems.
Although a good number of simulation and experimental studies on the performance of solar absorption cooling systems using evacuated tubes and FPCs have been reported in literature but detailed workable simulation model for dynamic performance and comparative analysis for major cities of Pakistan in various climatic zones is not yet carried out. To model and simulate the Solar-Driven Vapor Absorption Cooling System (SVACS) in this work, TRNSYS software is employed. The TRNSYS model is simulated for Pakistan's major cities in order to evaluate the system performance in various climatic zones. Moreover, long-term performance and a parametric analysis of the key performance variables of the SVAC system is also offered in this paper extensively. In 2015, the United Nation established a set of 17 interlinked global goals known as sustainable development goals (SDGs) primarily aimed at addressing challenges for instance peace, climate change, inequality, environmental degradation, and poverty. The importance of these SDGs is to develop a universal framework to align the focus of countries on uniform policies and actions to eradicate the global challenges faced by the modern world. In addressing climate change the SDGs plays a pivotal role by directing concentration of countries on promoting sustainable practices [30]. This study also supports the transition to clean energy contributing to the United Nations' SDGs, particularly SDG 7 (Affordable and clean energy) and SDG 13 (Climate action).
2 System Description
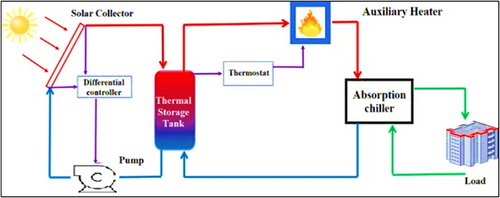
The invention of a sustainable refrigeration system especially solar vapor absorption systems have showed us the path toward to resolve problems like increasing energy demand and depletion of ozone layer and increasing global warming. This refrigeration system became very popular due to its higher efficiency and mostly for that it does not disturbs our natural environment. Solar-Driven Vapor Absorption Cooling System (SVACS) consists of the solar collector, absorber, pump, condenser, expansion valve, evaporator, and a heat enter to the generator via a heat exchanger are the primary components of the vapor absorption system. Heat energy from sunlight are collected in a solar collector tube which consists of a black painted copper tubes and glass housing which helps it to absorb the heat from the sunlight and transfer it to the solution of water and Lithium-Bromide flowing through it which heats the solution and enables it to generate water vapors, water vapors are then transferred to the condenser where the vapor is cooled by circulation running water. The water is then throttled in an expansion valve, and then is moved toward the evaporator at a low temperature and pressure where it gets evaporated. The water vapor is then moved to the absorber where it is absorbed in the concentrated solution of LiBr and heat is rejected to the cooling coils, and after that the water is pumped again to generator from where the whole cycle is repeated. Figure 1 displays a schematic diagram of the SVACS. In the current arrangement of absorption chillers, the absorption chiller gathers hot water from a thermal storage tank at a temperature of 109°C to vaporize the refrigerant in the generator as demonstrated in Figure 1. The system has a common thermal storage tank between the chiller loop and collector loop. This configuration is widely used in ST applications because of its simplicity and effectiveness. In the collector loop, there are three components: solar collector, pump, and differential controller while in chiller loop there are four components such as pump, auxiliary heater, thermostat, and absorption chiller. If the hot side temperature at the storage tank outlet is below the specified value that is needed in the generator, the purpose of auxiliary heaters is to provide the residual heat and raise the water temperature to a tolerable level. A thermostat is also employed in the chiller loop to regulate the auxiliary heater by keeping an eye on the temperature of the hot fluid leaving the chiller. A differential controller is utilized between the thermal storage tank and the solar collector to regulate fluid flow and switch on the pump when the collection's exit temperature is higher than its intake temperature [14].
3 System Modeling in TRNSYS
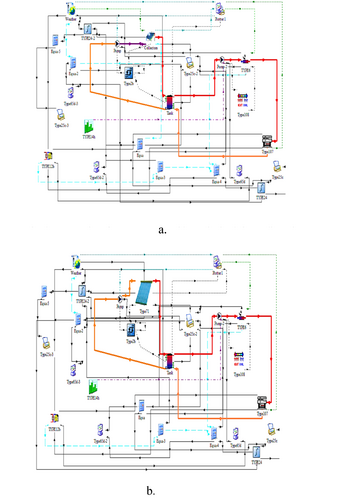
In order to support a maximum cooling load of 50 TR (176 kW), the solar-driven single effect absorption cooling system's specified design scheme was created in TRNSYS. The typical meteorological year (TMY) file with weather values for various places around Pakistan is utilized in the TRNSYS application to model and simulate the system. The TRNSYS modeling and simulation use the pertinent generalizing assumptions since the primary goals of this study are to dynamically model the system and investigate the effects of different system parameters on the performance of the system [31, 32]. In Figure 2a,b, respectively, the schematic view of the solar vapor absorption cooling system with FPC and ETC is displayed.
3.1 Solar Collector
| Parameter | Description | Unit | |
|---|---|---|---|
| Collector type | Flat plate | Evacuated tube | — |
| Number in series | 1 | 1 | — |
| Collector area | 5–30 | 5–30 | m2 |
| Collector slope | 30 | 0 | Degrees |
| Fluid specific heat | 4.190 | 4.190 | kJ/kg K |
| Efficiency mode | 1 | 1 | — |
| Intercept efficiency | 0.80 | 0.6 | — |
| Efficiency slope | 13 | 6 | kJ/h.m2 K |
| Efficiency curvature | 0.05 | 0 | kJ/h.m2 K2 |
| Parameter | Description | Unit |
|---|---|---|
| Absorption chiller (hot water fired) | ||
| Component type | Type 107 | — |
| Maximum cooling capacity (Qchilled) | 176 | kW |
| Set point temperature of chilled water (Tchw,set) | 6.11 | °C |
| Inlet temperature of the cooling water (Tcw,o) | 26.66 | °C |
| Driving temperature required in generator of the absorption chiller (Tg,i) | 108.86 | °C |
| Hot water flow rate in chiller loop () | 0.89 | kg s−1 |
| Chilled water flow rate () | 0.712 | kg s−1 |
| Cooling water flow rate in the condenser of the absorption chiller () | 1.45 | kg s−1 |
| Specific heat of the working fluid | 4.190 | kJ kg−1 K−1 |
| Stratified thermal storage tank | ||
| Component type | Type 4a | — |
| Type of tank | Stratified | — |
| Heat loss coefficient of tank | 0.83 | W m−2 K−1 |
| No. of nodules | 2 | — |
| Type of working fluid | Water | — |
| Density of the working fluid | 1000 | kg m−3 |
| Auxiliary heater | ||
| Component type | Type 6 | — |
| During operation, the heater's overall loss coefficient | 0.0 | kJ kg−1 K−1 |
| Efficiency (ηauxiliary) | 1.0 | — |
| Time step of simulation | 1 | Hr |
3.2 Thermal Storage Tank
The stratified thermal storage tank used in this model is Type 4a. This type of tank has uniform losses and employs a conglomerate-segment scheme in which the thermal storage split up into M nodes or portions as well as a function of time each segment is administered by the energy balance [35]. From the top node, the flow always leaves the generator of the VAC and from the bottom segment the return flow always leaves toward the solar collector. The tank is split into two sections for this project, and the entire simulations use the 0.83 W/(m2 K) coefficient of heat loss.
3.3 Auxiliary Heater
3.4 Absorption Chiller
3.5 Differential Controller
With hysteresis for temperature the differential controller employed in this model is Type 2b. This type of differential controller yields a control signal, which has state of either 1 (one) or 0 (zero), where 1 represents ON state and 0 represents OFF state. The value of the control signal is designated as a function of the variance between higher and lower temperatures TH and TL, compared with two dead band temperature differences (DTH) and (DTL).
For safety reasons, a high limit cut-out is contained within this controller. If the high-level threshold condition is breached, the control task will be reset to zero irrespective of the dead band conditions. Table 3 shows typical parameters of Differential controller.
| Parameter | Description |
|---|---|
| Number of oscillation | 5 |
| High limit cut-out | 102°C |
| Monitoring temperature | 100°C |
| Input control function | 0 |
| Upper input temperature Th | 100°C |
3.6 Weather Data
In standard TMY2 data structure, Type 109 reads weather files and national solar radiation data base (USA) utilizes this weather data but from many programs TMY2 type weather files can be engendered, for instance metronome. This element's primary function is to read meteorological data from weather file regularly, convert this data into necessary unit system, and analyze the solar radiation statistics to determine the angle of incidence and tilted surface radiation for a variety of surfaces.
3.7 Online Plotter, Printer, and Other Components
Type 25c and Type 65d are the online printer and plotter, respectively. While the simulation is running, to display the selected system variable Selected system variables are printed at predetermined intervals using the online plotter and the printer component, respectively. Both parts are commendable and widely used since they provide useful variable evidence and enable operators to instantaneously Identify whether the strategy is performing as expected. In a secondary plot area on the display or in the notepad file, the specified variables will be shown.
Type 3b, Type 14h, Type 24, and Type 108 are pump, forcing function, integrator, and thermostat, respectively. The thermostat regulates the action of the auxiliary heater conditional upon the control signal produced conferring to the set point temperature. By specifying the time step, forcing function switches the system operation during which the system operates (i.e., from 0800 to 1600 h). The typical characteristics of pump are shown in Table 4.
| Parameter | Description |
|---|---|
| Maximum power | 240 kJ/h |
| Maximum flow rate | 20,000 kJ/h |
| Fluid specific heat | 4.19 kJ/kg K |
| Power coefficient | 0.5 |
| Inlet mass flow rate | 20 kg/s |
| Control signal | 1 |
4 Determinants of System Performance
To evaluate the SVAC system's performance and contrasting it with FPC and ETC, the following performance criteria are evaluated:
4.1 Solar Fraction
4.2 Primary Energy Savings
In Equation (8), the parameters contained in square braces denotes the ratio of the total primary energy consumed by the standard or comparison vapor compression chiller to the total primary energy consumed by the ST system's auxiliary heater in order to supply the specified cooling load. The typical conversion factor value for and COP is assumed as 0.4 and 2.8, respectively.
5 Results and Discussion
This study conducted a simulation of the entire summer season from March to August to determine the SF and primary energy savings achievable with various collector areas and thermal storage volumes for flat plate and ETCs. To establish the validity of the model used in the study, a comparison was made between the generated results and patterns from previously published findings [11]. This was necessary because a direct confirmation of the model's findings was not possible. Figures 3a and 4b reveal the trends of the SF at various collector areas and thermal storage volume for flat plate and ETCs, while other system parameters are kept constant. Similarly, Figures 5a and 6b show the maximum primary energy saving that is achievable at various areas of collector and volume of thermal storage tank for FPC and ETC, while other system parameters are kept constant. Analogous trends of SF and primary energy storage were revealed by Ahmed et al. [14].
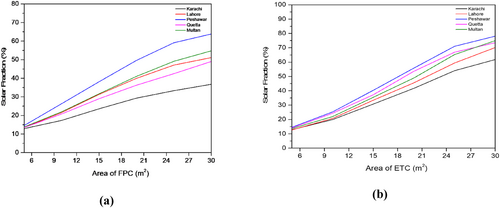
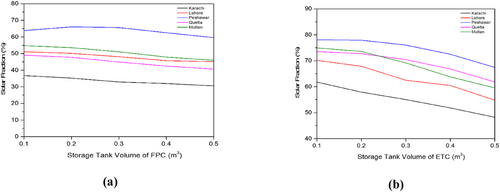
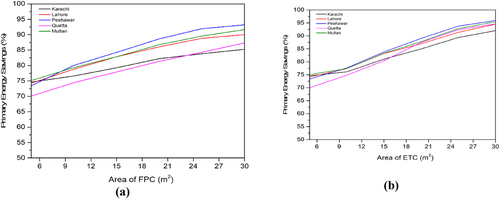
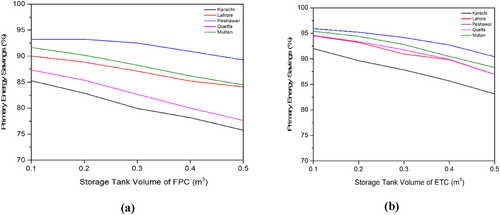
Figure 3a,b presents the SF variation at different collector areas for both FPCs and ETCs. As collector area increases, for both FPC and ETC solar fraction improves. For FPC and ETC, the SF ranges from 0.1–0.6 and 0.1–0.8, respectively. With the FPC highest SF of 0.64 is achieved by Peshawar at 30 m2 whereas the lowest SF with FPC is obtained by Karachi at 5 m2. With the ETC, similar trends were observed for the highest and lowest SFs. The SFs achieved by ETC are higher than the corresponding value for FPC with similar collector area. Peshawar recorded the highest SF of 0.78 with ETC at 30 m2 and the lowest SF of 0.12 was recorded for Lahore with ETC at 5 m2. Lahore recorded the highest percentage increase in SF with ETC and the lowest percentage increase was achieved by Karachi with FPC.
Figure 4a,b demonstrates the variation of SF at different thermal storage volume. For both FPC and ETC SF decreases as storage volume increases. With FPC, there is relatively little change in the SF, whereas there is a significant variation with ETC. Peshawar recorded the smallest reduction of about 6.6% and 13.6% in SF for FPC and ETC. Quetta displayed largest decrease in SF of about 17% with FPC while Karachi recorded the largest decrease of about 22% with ETC. Peshawar recorded highest SF of 0.638 and 0.781 at 0.1 m3 with FPC and ETC, respectively. Lowest SF is recorded by Karachi of about 0.31 and 0.48 at 0.5 m3 with FPC and ETC, respectively.
Figure 5a,b illustrates the variability in primary energy savings for various collector areas. The primary energy savings for ETCs and flat collectors continue to increase as the collector area does. The ranges from 75% to 93% and 75% to 96% with FPC and ETC, respectively. The highest primary energy saving of 85%, 90%, 93%, 87%, 92% are recorded for Karachi, Lahore, Peshawar, Quetta, and Multan, respectively, with FPC at 30 m2 collector area. Similarly, highest primary energy saving of 92%, 94%, 96%, 94%, 95% is recorded for Karachi, Lahore, Peshawar, Quetta, and Multan, respectively, with ETC at 30 m2 collector area. At 5 m2 collector area, Peshawar recorded the highest primary energy saving of 75.1%, while Quetta recorded the lowest primary energy saving of 70% for both FPC and ETC. At 5 m2 collector area, the primary energy saving is almost the same with FPC and ETC for all cities except Quetta, but as the collector area increases the difference between corresponding values of primary energy saving of the cities increases. The highest percentage increase in is recorded for Peshawar and Quetta of about 27 and 35% with FPC and ETC, respectively. Karachi recorded the lowest percentage increase in of about 14% and 23% with FPC and ETC, respectively.
Figure 6a,b displays the variation of primary energy saving for different thermal storage volume. For both FPC and ETC increasing the storage volume results in decrease in the primary energy saving. For Lahore there is negligible decrease in primary energy saving up to 0.25 m3 but increasing storage volume further the decrease in is significant with FPC. Peshawar recorded lowest percentage decrease in of about 4.2% and 5.7% for FPC and ETC, respectively. Highest percentage decrease in is recorded for Quetta and Karachi of about 11.2% and 9.7% with FPC and ETC, respectively. For Lahore percentage decrease in is about 6.6% with FPC and 8% with ETC. Highest is achieved in Peshawar of about 93% with FPC and 96% with ETC for storage volume of 0.1 m3. SF and primary energy saving for both collector for various areas are given in Tables 5 and 6, respectively.
| Flat plate collector | ||||||||||
|---|---|---|---|---|---|---|---|---|---|---|
| Karachi | Lahore | Peshawar | Quetta | Multan | Karachi | Lahore | Peshawar | Quetta | Multan | |
| Collector area (m2) | Solar fraction | Primary energy saving | ||||||||
| 5 | 0.13 | 0.13 | 0.15 | 0.13 | 0.14 | 0.75 | 0.74 | 0.73 | 0.70 | 0.75 |
| 10 | 0.17 | 0.22 | 0.26 | 0.21 | 0.22 | 0.77 | 0.79 | 0.80 | 0.74 | 0.79 |
| 15 | 0.24 | 0.31 | 0.38 | 0.29 | 0.32 | 0.79 | 0.83 | 0.84 | 0.78 | 0.83 |
| 20 | 0.29 | 0.40 | 0.50 | 0.36 | 0.41 | 0.82 | 0.86 | 0.89 | 0.81 | 0.87 |
| 25 | 0.33 | 0.47 | 0.59 | 0.42 | 0.49 | 0.84 | 0.89 | 0.92 | 0.84 | 0.90 |
| 30 | 0.37 | 0.51 | 0.64 | 0.49 | 0.55 | 0.85 | 0.90 | 0.93 | 0.87 | 0.92 |
| Evacuated tube collector | ||||||||||
|---|---|---|---|---|---|---|---|---|---|---|
| Karachi | Lahore | Peshawar | Quetta | Multan | Karachi | Lahore | Peshawar | Quetta | Multan | |
| Storage tank volume (m3) | Solar fraction | Primary energy saving | ||||||||
| 0.1 | 0.62 | 0.70 | 0.78 | 0.74 | 0.75 | 0.92 | 0.95 | 0.96 | 0.95 | 0.95 |
| 0.2 | 0.58 | 0.68 | 0.78 | 0.73 | 0.74 | 0.90 | 0.93 | 0.95 | 0.93 | 0.94 |
| 0.3 | 0.55 | 0.63 | 0.76 | 0.70 | 0.69 | 0.88 | 0.91 | 0.94 | 0.92 | 0.93 |
| 0.4 | 0.52 | 0.61 | 0.73 | 0.67 | 0.64 | 0.86 | 0.90 | 0.93 | 0.90 | 0.90 |
| 0.5 | 0.48 | 0.55 | 0.67 | 0.62 | 0.60 | 0.83 | 0.87 | 0.90 | 0.87 | 0.88 |
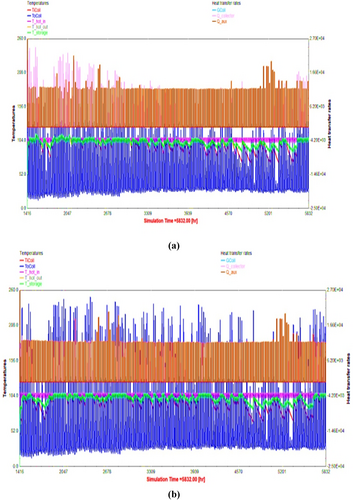
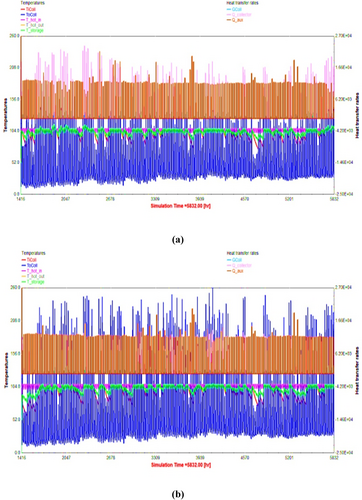
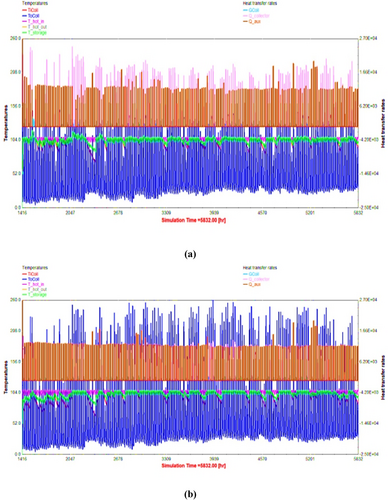
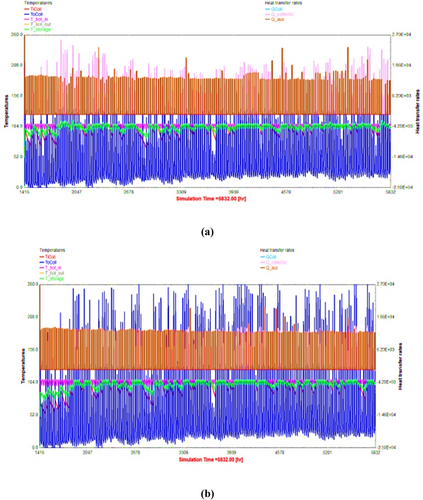
Figures 7a,b, 8a,b, 9a,b, and 10a,b show the variation of for Karachi, Lahore, Peshawar, and Quetta, respectively. The dynamic simulation is presented for the entire summer period on or after March to August at area of collector of 15 m2 and thermal storage volume of 0.25 m3 and constant mass flow rate in collector and absorption loop of the model for both collectors. The left vertical axis displays temperature in °C and right vertical displays heat transfer rates in kJ/h. Between flat plate and ETCs, the collector temperature (), useful energy gain () and is the key difference. At same collector area higher collector temperature is recorded by ETC as compared to FPC. For FPC, the peak collector temperature ranges from 130°C to 170°C while with ETC the peak collector temperature ranges from 140°C to 250°C that makes it suitable for high temperature applications. For Karachi, the peak collector temperature is highest in April and May. The useful energy gain (Qcollector) of FPC is higher than that of the ETC. The largest variation in collector temperature is recorded for Quetta. The trend of storage temperature is almost the same for all the cities while from Figure 9a, it can be noticed that the storage temperature is more stable for Peshawar with FPC as compared to other cities. Peshawar recorded the highest useful energy gain (Qcollector) with FPC. The temperature of hot water (Thot,in) entering generator of absorption chiller is constant at 109°C.
To represent a spectrum of climatic conditions the five urban cities investigated in this study are carefully selected. Based on the prevailing climatic conditions the selected cities can be divided into three different climatic regions: humid tropical (Peshawar, Islamabad), arid (Quetta, Karachi) and semi-arid (Multan, Lahore). These climatic conditions are found in many regions across the world, such as North Africa, South Asia and Middle East. The strategies and methodology adopted in this study provide a framework that can be extrapolated to the area with similar conditions. For instance, urban centers in arid regions with high solar irradiance can benefit from strategies demonstrated in Karachi and Quetta, while humid subtropical areas can draw parallels from Islamabad and Peshawar. Future studies could validate these findings in international contexts to enhance their global relevance.
6 Conclusions
In this work, a TRNSYS model with a maximal cooling rating of 176 kW has been developed to assess the thermal performance of a solar-driven vapor absorption cooling system for Pakistan's biggest metropolitan areas. The standard components included in the TRNSYS library are used, and they are coupled to FPC and ETC. To simulate a system model for the entire summer (i.e., from March to August), weather data files from several cities, including Lahore, Peshawar, Quetta, Karachi, and Multan, were used. The usage of solar-driven absorption cooling in these cities has proven to be quite promising due to the high solar potential and the fact that the system is operational all summer long. The last aspect is essential in terms of minimizing the project's payback period. Consideration to the significant energy savings that Pakistan's cosmopolitan zones may realize with well-designed solar energy systems. Additionally, by extrapolating these results to parts with analogous ecological features globally, the diverse climatic variables under study presents a foundation for stimulating energy competence on a larger scale. For evaluating the performance of solar-driven cooling systems collector temperature, useful energy gain by collector, SF and primary energy savings () are vital factors. SF and primary energy saving showed that ETC would be a better choice regarding the selection of solar collector as the system with ETC achieved higher SF and compared to a system with FPC and much higher temperatures are recorded with ETC for the cities compared with FPC, which makes suitable for the applications where high temperature is required. The peak collector temperature for FPC is between 130°C and 170°C and for ETC, it is between 140°C and 250°C. The FPC's net energy gain (Qcollector) is greater than the ETC. For practically all the cities, the storage temperature trend is the same. The SF ranges from 13% to 64% and 13% to 78% for FPC and ETC, respectively. The ranges from 75% to 93% and 75% to 96% with FPC and ETC, respectively. Increasing collector area resulted in improvement in the SF and whereas increasing the volume of thermal storage decreased SF and for both FPC and ETC. Lahore city recorded the highest percentage increase in the SF with ETC and the lowest percentage increase is achieved in Karachi with FPC. Of the five cities selected for this study, Peshawar recorded the best thermal performance based on SF and . The general findings of several simulation studies were found to be consistent with the data that had already been published [11]. Future research would greatly benefit from a validation of this model that contrasts its performance with a physical model. Additionally, the current study can be applied to various solar-driven cooling systems, such as desiccant and adsorption cooling systems.
Nomenclature
-
- a0
-
- optical loss efficiency
-
- Cpf
-
- working fluid specific heat rate
-
- Gcol
-
- total solar irradiance on collector surface
-
-
- mass flow rate of working fluid
-
- Tset
-
- set-point temperature
-
- Tchw,set
-
- set-point temperature of chilled water
-
- Tg,i
-
- driving temperature required in generator
-
- Tcw,i
-
- inlet temperature of cooling water
-
- Tstorage
-
- thermal storage tank temperature
-
- ΔT
-
- temperature difference of fluid at inlet of collector and atmospheric temperature
-
-
- required amount of energy of hot water by the generator of absorption chiller
-
-
- power expended by pumps and other components of chiller
-
-
- amount of solar thermal energy gain by solar collector
-
- SVACS
-
- solar vapor absorption cooling system
-
- COP
-
- coefficient of performance
-
- FPC
-
- flat plate collector
-
- ETC
-
- evacuated tube collector
-
- SF
-
- solar fraction
-
-
- primary energy saving for solar cooling/heating system
-
- VCRS
-
- vapor compression refrigeration system
-
- TRNSYS
-
- transient system simulation software
Author Contributions
Laveet Kumar: conceptualization, investigation, methodology, validation, visualization, software, formal analysis, writing – original draft, data curation, resources. Hamza Shaikh: investigation, writing – review and editing, visualization, software, data curation. Ahmad K. Sleiti: supervision, data curation, formal analysis, project administration, funding acquisition, writing – review and editing. Muhammad Amir Raza: investigation, writing – review and editing, formal analysis, data curation.
Acknowledgments
The work presented in this publication was made possible by grant QUPD-CENG-23/24-537 from the Qatar University. The findings herein reflect the work, and are solely the responsibility, of the authors.
Conflicts of Interest
The authors declare no conflicts of interest.
Open Research
Data Availability Statement
The data that support the findings of this study are available from the corresponding author upon reasonable request.


