Fractional Order PID Controller Based-Neural Network Algorithm for LFC in Multi-Area Power Systems
Funding: The authors received no specific funding for this work.
ABSTRACT
Modern power systems are increasingly challenged by frequency stability issues due to dynamic load variations and the growing complexity of interconnected networks. Traditional PID controllers, while widely utilized, struggle to address the rapid fluctuations and uncertainties inherent in contemporary multi-area interconnected power systems (MAIPS). This paper introduces an innovative approach to Load Frequency Control (LFC) using a Fractional-Order PID (FOPID) controller, optimized by a Neural Network Algorithm (NNA). The proposed NNA-FOPID framework leverages the biological principles of neural networks to dynamically tune controller parameters, significantly enhancing system performance. The solution is tested under various scenarios involving step load changes across multi-area systems. The proposed method demonstrates marked improvements over traditional PID controllers and advanced optimization techniques such as Differential Evolution (DE) and Artificial Rabbits Algorithm (ARA). The comparisons show that the FOPID controller's NNA-based design effectively and successfully handles LFC in MAIPSs for ITAE minimizations, and statistical evaluation supports its superiority.
Abbreviations
-
- ACE
-
- area control error
-
- AGC
-
- automatic generation control
-
- ANN
-
- artificial neural network
-
- ARA
-
- artificial rabbits algorithm
-
- BFA
-
- bacterial foraging algorithm
-
- BMO
-
- barnacle mating optimiser
-
- CFOID-FOPIDN
-
- cascaded fractional order integral derivative and proportional integral derivative with filter
-
- CFOFPID-IDD
-
- cascade fractional order fuzzy pid-integral double derivative
-
- DE
-
- differential evolution
-
- GA
-
- genetic algorithm
-
- GNA
-
- global neighborhood algorithm
-
- HHO
-
- horse herd optimization
-
- FOPID
-
- fractional-order PID
-
- FOPTID+1
-
- fractional-order proportional tilt integral derivative plus one
-
- ISE
-
- integral square error
-
- ITAE
-
- integral of time absolute error
-
- LFC
-
- load frequency control
-
- MAIPS
-
- multi-area interconnected power systems
-
- MO
-
- maximum overshoot
-
- MU
-
- maximum undershoot
-
- NNA
-
- neural network algorithm
-
- PSO
-
- particle swarm optimization
-
- SLC
-
- step load change
-
- ST
-
- settling time
-
- WCA
-
- water cycle algorithm
1 Introduction
Growing transmission network congestion brought on by the new energy market structure has made it more difficult to operate the power system and the market efficiently [1, 2]. Grid stability guarantees a steady and reliable supply of high-quality electricity. The stability of power systems depends on Load Frequency Control (LFC), which is necessary to maintain power balance between interconnected areas under various load circumstances [3]. LFC becomes more important as contemporary power networks get larger and more intricate [4]. The drawbacks of conventional units, including their high maintenance costs and environmental restrictions, only serve to increase the allure of LFC. Addressing LFC is currently essential for guaranteeing that customers receive dependable, high-quality power, particularly in situations where load demand varies greatly, system configurations alter, and power system unit sizes grow [5, 6]. Traditionally, PID controllers were employed extensively in this application. Nevertheless, the dynamic issues posed by contemporary power systems are becoming more difficult to handle with these conventional techniques [7].
1.1 Literature Survey
In real-world power systems, enhancing power system operation by enabling precise and reliable regulation of power flow across transmission lines, which contributes to improved stability, efficiency, and overall system performance [8-10]. The controller settings as originally intended may not work well in the presence of outside disruptions and parameter value uncertainty. Numerous population-based optimization strategies have been put out to improve the robustness and stability of systems [11]. The majority of these strategies are targeted, focusing on specific issues or performing well in certain situations. The existing optimization methods typically produce outstanding results in certain scenarios. The Quasi-oppositional backtrack searching optimizer were demonstrated to be a successful method for controlling the LFC [12] with minimizing the integral time-weighted absolute error. Mimicking the hunting mechanism of antlions, ant lion optimizer has been applied in [13] to tune the PID controller to enhance oscillation damping considering power system stabilizers. Also, this study has been extended to implement the electrical model on a dSPACE DS1104 hardware (NI SbRIO-9636 board) to ensure real-time applicability. In [14], an optimal design of a PID controller via SAMPE-JAYA algorithm to regulate the LFC in multi-area interconnected power systems (MAIPS) incorporating the nonlinear characteristics due to generation rate constraint.
Numerous control techniques have been put out in recent decades to successfully preserve the nominal values of system frequency and transferred power. Researchers investigated at the LFC of a MAIPS margined with a high-voltage direct current connection, a gate-controlled series capacitor, and distributed producing resources [15]. The researchers used the ant lion optimizer technique to optimize a Fractional-Order PID (FOPID) with supplementary controller in Reference [16]. The dynamic stability of the MAIPS was enhanced by the previously described strategies, but their application requires significant computer resources. Among other factors, the controller's high order, complexity, defuzzification processes, requirement for a sizable training data set, and inference methodology made it unsuitable for real-time deployment. A variety of methods were adopted for optimizing PI, PID, cascaded PDN-PI and FOPID settings, including constrained population external optimization [17], water cycle algorithm (WCA) [18], the educational competition optimizer [19], the genetic algorithm [20], and hybridized gravitational searching and particle swarm optimizer [21]. The artificial bee colony approach has been adopted in conjunction with the weighted sum method to decrease the settling time of the operating frequency and decrease the overshoot [22]. Also, a teaching-learning-based algorithm was performed to adjust the fuzzified PID controller's undershoot, overshoot, and settling time [23]. To manage the LFC in MAIPSs, cascaded PI–PI based on coyote optimization approach [24], cascaded PD-PI controller based on slime mold algorithm [25] and PI-one plus double derivative controller with Kepler optimization [26] have been implemented. Furthermore, the cuckoo search strategy has been employed to address the LFC in three area interconnected grids by optimum adjustment of the integral plus double derivative controller in [27], the PI controller in [28], the PID including several ITAE performance assessments in [29].
The study in [30] explored automatic generation control (AGC) within multi-source power systems, incorporating thermal, hydro, and gas power plants in each control area. A traditional PID controller was developed and optimized using various population-based algorithms. The research provided a comparative performance evaluation of Genetic algorithm (GAs), particle swarm optimization (PSO), and bacterial foraging algorithm (BFA) in tuning the PID controllers. The optimization process was guided by a cost function derived from the ISE performance index. However, small varying step load disturbances (+1% to +4%) in the respective control areas were applied in the control areas. Among the techniques compared, BFA-tuned AGC controllers exhibited superior dynamic response capabilities, outperforming GA and PSO in handling these disturbances.
A FOPTID+1 controller was used in [31] to address the AGC while taking into account one and two-area multi-source power systems that included gas, hydro, and thermal power plants. By combining both local and global search spaces—which are produced by a random selection process—to iteratively explore and improve solutions, with an emphasis on the neighborhood of previously found beneficial solutions, the FOPTID+1 parameters were optimized using the Global neighborhood algorithm (GNA). Capacitive energy storage units were also added to this study in order to preserve power system stability in a variety of scenarios. The LFC management issue for a stand-alone microgrid that integrates electric cars, heat pumps, freezers, diesel generators, and low inertia tidal turbines has been tackled in [32]. This study used the Jaya method to establish and tune a CFOFPID-IDD regulator under various load situations and physical restrictions, including generation rate limitations and time delay. This study examined tidal turbines operating in a de-loaded mode while continuously varying the pitch angle and rotor speed so as to preserve a spinning reserve for frequency management. In [33], a Sliding Mode Controller (SMC) in electrical power distribution systems was adjusted using the Arctic Puffin optimiser and contrasted with PI controllers. The main goal of this work is to mitigate the voltage dips caused by the operation of nonlinear converters by controlling a voltage restorer. In [34], the frequency and tie-line flow changes were managed and reduced for multi-microgrids because of the inconsistent availability of renewable resources and changing load requirements. AGC was intended to be enhanced by the CFOID-FOPIDN. The CFOID-FOPIDN regulator was fine-tuned using a Barnacle mating optimiser (BMO), which was motivated by barnacle reproduction, which uses allele frequencies to maintain genetic equilibrium. In BMA, sperm casting and direct mating were used for exploration and exploitation, while penis length was used to choose mating couples. The BMO-tuned CFOID-FOPIDN controller merges redox flow batteries and a distributed power flow and has been used for a variety of energy sources, including wind, fuel cells, electrical vehicles, photovoltaic, diesel, and battery storage. Its resilience was additionally confirmed across a range of operational conditions, such as shifting loads and changes in irradiance and wind speed. Also, PSO algorithms were successfully implemented for handling the LFC problem in single and multi-area power systems including multi-source generation plants as stated in [35-38]. Table 1 displays a review of some recently studied works from the state of the art.
| Reference | Year | Controller | Tuning algorithm | Description | Drawback |
|---|---|---|---|---|---|
| [35] | 2020 | PID | PSO | LFC with a single area grid | Only traditional PID controllers were compared, and more research is required to confirm robustness and wider applicability. |
| [39] | 2020 | PI/PID | GNA | LFC in a single-area thermal power station | The study was limited to a single-area network, making the findings less generalizable to larger or more complex systems. |
| [36] | 2022 | PID | PSO | LFC in a standalone single-area including gas, hydroelectricity, and thermal equipment | Performance was evaluated only in respect to PID controllers; there were no more thorough benchmarks that used contemporary strategies. |
| [37] | 2023 | PID | PSO | LFC with gas, hydropower and thermal equipment in a stand-alone single-area network | Performance was assessed solely in relation to PID controllers; more comprehensive benchmarks using modern tactics were absent. |
| [40] | 2024 | PID | HHO | Two-areas power network | The HHO algorithm's evaluation was conducted solely versus PSO; no assessments comparing it to proven outcomes or other cutting-edge methods were made. |
| [38] | 2024 | PID | GA and PSO | LFC in unregulated systems with several parties and suppliers | Only GA and PSO were compared; assessments against other contemporary metaheuristic techniques or thorough prior research were not included. |
1.2 Research Gap
Modern interconnected power systems are increasingly challenged by dynamic load variations and the complexities introduced by renewable energy integration. Despite the critical role of LFC in maintaining frequency stability and power balance, several challenges persist in current control methodologies. Traditional PID controllers, though widely used, exhibit limited adaptability when subjected to nonlinear behaviors, sudden load disturbances, and parameter uncertainties inherent in MAIPS. While advancements such as FOPID controllers have shown potential for enhanced accuracy and flexibility, their practical implementation has been hindered by the absence of effective optimization techniques for parameter tuning. Moreover, many state-of-the-art optimization strategies, including genetic algorithms, particle swarm optimization, and fuzzy logic-based controllers, achieve notable performance improvements but at the cost of increased computational complexity. This limitation makes these approaches unsuitable for real-time applications, particularly in large-scale and dynamically varying power systems. Furthermore, existing studies often focus on single-area systems or specific scenarios, leaving the robustness and scalability of control strategies in multi-area configurations insufficiently explored. The lack of a comprehensive solution capable of addressing these limitations underscores the need for an innovative and adaptable approach to LFC.
1.3 Neural Network Algorithm (NNA)
Recently, a novel metaheuristic NNA was proposed by Sadollah et al. [41] which inspired by biological nervous systems and ANNs. It leverages the structure of ANNs to solve complex optimization problems by generating candidate solutions and adjusting them iteratively to find optimal solutions [42]. Like ANNs, the NNA uses interconnected computing units (neurons), where the best solution in each iteration becomes a “target” and other solutions move closer to this target, minimizing the error between them. The NNA draws inspiration from how neural networks function: the algorithm's operators mimic neural processes like feedback and weight updates. In optimization, instead of fine-tuning neuron weights for prediction, NNA optimizes candidate solutions to minimize the difference between the current solution and the best found so far [43]. Biological nervous systems and metaheuristic population-based NNA optimization share several similarities [44, 45]. The biological nervous systems process information through networks of neurons that communicate with each other. Similarly, in NNA optimization, solutions are processed and updated within a population of candidate solutions, which interact to guide the search process. Nervous systems rely on feedback loops to adjust responses to stimuli. In NNA, feedback mechanisms from evaluating objective functions are used to iteratively refine candidate solutions based on performance. Neurons in biological systems dynamically adapt their connections and strengths (synaptic weights) to learn and improve. Similarly, NNA adjusts the positions and attributes of solutions (e.g., weights or candidate positions) in search of the global optimum.
1.4 Motivation of Study
To address these persistent challenges, this study proposes a novel FOPID controller optimized using the NNA. Inspired by the biological nervous system and artificial neural networks, NNA provides a metaheuristic optimization framework with strong global search capabilities and local exploitation features. These characteristics make it particularly suitable for handling the complex dynamics of MAIPS and fine-tuning the parameters of fractional-order controllers. The integration of FOPID controllers and NNA offers several advantages. Fractional-order controllers, with their non-integer dynamics, provide greater control flexibility and improved performance in systems with time delays or nonlinearities. By leveraging NNA, the proposed method overcomes the computational inefficiencies of traditional approaches while delivering robust and scalable solutions for multi-area systems. Furthermore, the method's ability to minimize frequency deviations, reduce overshoot and undershoot, and achieve faster settling times makes it a promising candidate for real-time LFC applications.
This research is motivated by the growing demand for reliable, efficient, and scalable control solutions in modern power systems. By combining the adaptability of NNA with the advanced capabilities of FOPID controllers, the study aims to establish a framework that not only addresses current limitations but also sets the foundation for future advancements in grid stability, particularly in scenarios involving renewable energy integration and dynamic load variations.
1.5 Paper's Contributions
- The study develops the metaheuristic NNA for tuning FOPID controllers effectively.
- It is implemented to efficiently reduce frequency fluctuations and disturbances in multi-area interconnected power systems, leveraging its fractional-order flexibility.
- The NNA-tuned FOPID controller demonstrates superior performance metrics by lower ITAE values compared to conventional PID controllers and other optimization methods like DE, PSO, JAYA, and ARA.
- The study shows the scalability of the NNA in minimizing frequency deviations in scenarios with different load changes with reduced settling time, minimized overshoot and undershoot.
- Statistical and simulation-based analyses validate the superiority of the proposed controller over traditional and advanced control techniques, establishing its efficacy for real-time load frequency control in complex power systems.
2 Problem Formulation
2.1 MAIPS Model
Two non-reheat thermal power plants are included to the power system model in the present research. The main components are the generator, turbine, and speed-governing device for each region, which have three inputs and two outputs, as illustrated in Figure 1. In this case, the reheat thermal unit/turbine in question is considered as an entire unit along with several other reheat thermal units as illustrated in Reference [47].
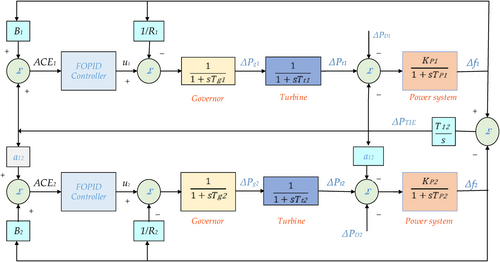
As illustrated in Figure 1, ∆PD1 and ∆PD2, ∆PTIE and (u1 and u2) illustrate the inputs of the system. Furthermore, (∆f1 and ∆f2) and (ACE1 and ACE2) clarify the frequency deviations in each area and the control errors, respectively, and demonstrate the outputs [29].
2.2 FOPID Controller
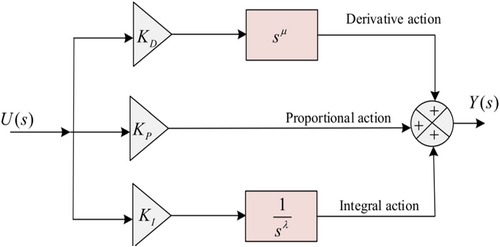
3 Proposed NNA for Tunning FOPID Controller
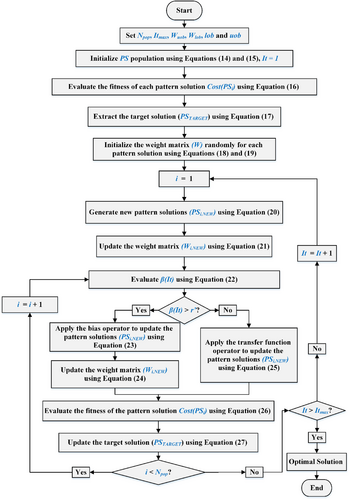
The NNA takes inspiration from the biological nervous system and ANNs to solve optimization problems. Below are the detailed steps of the NNA, along with the corresponding equations for each step:
3.1 Initialization
Therefore, the corresponding weight for the target solution is denoted as WTARGET.
3.2 Generating New Pattern Solutions
3.3 Bias and Transfer Function Operators
Bias is applied to a percentage of solutions early in the optimization, with a gradual reduction over time to balance exploration and exploitation.
The bias operator in the NNA is a crucial mechanism designed to introduce randomness or noise into the optimization process. Its primary purpose is to prevent premature convergence by adding perturbations to certain pattern solutions, ensuring that the algorithm explores new areas of the search space. This operator works similarly to a mutation operator in genetic algorithms, and it plays an important role, especially in the early iterations of the algorithm, to promote exploration. As the algorithm progresses, the impact of the bias operator is gradually reduced, promoting exploitation in later stages.
This equation moves the current solution PSj,NEW toward the target solution PSTARGET(It) by a random factor, ensuring that solutions improve over iterations.
3.4 Check Stopping Criterion
The algorithm checks whether the stopping condition (such as a maximum number of iterations or a convergence threshold) has been met. If the condition is satisfied, the algorithm terminates. Otherwise, it returns to generate new pattern solutions as previously mentioned in Sub-section 3.2.
Based on the above, Figure 3 displays the main steps of the NNA optimization.
4 Simulation Results and Discussions
- Scenario 1: SLC in area 1.
- Scenario 2: SLC in area 2.
- Scenario 3: SLC in both area 1 and area 2.
4.1 Simulation of Scenario 1
First, the suggested NNA-based FOPID controller's performance analysis is evaluated in MAIPS while considering the indices ITAE and ST. A SLC of 0.1 pu is applied in area 1 at t = 0 s for the duration of the simulation. In this scenario, Table 2 displays the controller variables of Kp, Ki, Kd, , and jointly with the corresponding performance indices in each area. Findings of ITAE from recently published control approaches, including ARA, DE, JAYA, PSO, SAMPE-JAYA, are also shown in this table for a clear comparative analysis with values of 0.075401, 0.0781, 0.077, 0.0769, and 0.0769, respectively. A minimum value of 0.0590 is obtained using the proposed NNA. Furthermore, when compared to PSO, DE, JAYA, ARA, and SAMPE-JAYA, the proposed NNA can achieve substantial improvements in the ITAE value of 27.662%, 32.231%, 30.369%, 30.199%, and 30.199%, respectively.
| Algorithm | ARA | DE | JAYA | PSO | SAMPE-JAYA | Proposed NNA | |
|---|---|---|---|---|---|---|---|
| Controller parameters | KP1 | 1.875133 | 1.7101 | 1.8394 | 1.9602 | 1.8066 | 2.864494 |
| Ki1 | 2.997462 | 3 | 3 | 3 | 2.9895 | 3.999996 | |
| Kd1 | 0.578319 | 0.5284 | 0.5806 | 0.6083 | 0.5654 | 0.839761 | |
| n1 | 115.132 | 372.86 | 72.985 | 385.58 | 88.111 | — | |
| — | — | — | — | — | 0.999999 | ||
| — | — | — | — | — | 0.999933 | ||
| KP2 | 2.979045 | 2.8899 | 1.4843 | 2.9756 | 2.1364 | 0.046009 | |
| Ki2 | 0.729651 | 1.0332 | 0.4306 | 1.5561 | 0.4187 | 0.000801 | |
| Kd2 | 1.050161 | 1.9478 | 1.0095 | 2.6638 | 1.7534 | 0.149124 | |
| n2 | 15.40281 | 332.02 | 425.37 | 497.92 | 146.04 | — | |
| — | — | — | — | — | 0.010384 | ||
| — | — | — | — | — | 0.999999 | ||
| ITAE value | 0.075401 | 0.0781 | 0.077 | 0.0769 | 0.0769 | 0.059063 | |
| ITAE improvement % | 27.662 | 32.231 | 30.369 | 30.199 | 30.199 | — | |
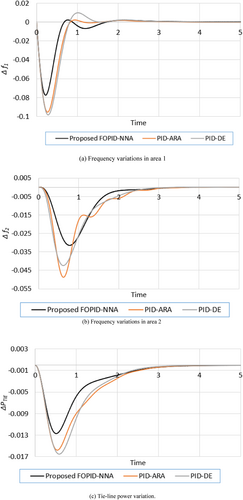
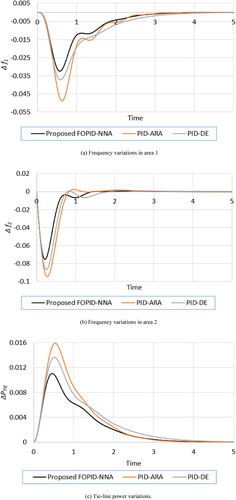
For more specific comparisons, the stability responses are depicted in regarding to the proposed FOPID-NNA, the PID-ARA and PID-DE controllers [53]. The related frequency and tie-line power responses in each area 1 are contrasted in Figure 4. As can be observed, responses for the NNA-based FOPID controller illustrate some undershoots at first, but they quickly return to the zero steady-state level without undesired oscillations after an SLC of 0.1 pu. Table 3 tabulates the outcomes of the MO, MU and ST of the FOPID-NNA, PID-ARA and PID-DE. As shown, the proposed FOPID-NNA finds the smallest MO values of 0.0021, 6.32E-06 and 6.47E-07 Hz for the frequencies and power transfer responses compared to the PID-ARA and PID-DE. Similarly, in regarding the MU indicator for the frequencies and power transfer responses, the proposed FOPID-NNA finds the smallest values of 0.0775, 0.0314 and 0.0127 Hz compared to the PID-ARA and PID-DE.
| ∆f1 | ∆f2 | ∆PTIE | |||||||
|---|---|---|---|---|---|---|---|---|---|
| MO | MU | ST | MO | MU | ST | MO | MU | ST | |
| Proposed FOPID-NNA | 0.0021 | −0.0775 | 2.4628 | 6.32E-06 | −0.0314 | 3.0024 | 6.47E-07 | −0.0127 | 3.2203 |
| PID-ARA | 0.0025 | −0.0953 | 2.1957 | 5.7E-05 | −0.0487 | 2.9014 | 1.08E-05 | −0.0158 | 3.0594 |
| PID-DE | 0.0098 | −0.0985 | 2.3829 | 8.08E-05 | −0.0425 | 2.6593 | 9.06E-06 | −0.0166 | 2.8398 |
In order to show the effectiveness of the proposed FOPID-NNA controller against other reported controllers, the outcomes of proposed FOPID-NNA controller are contrasted with previous research, including the PID-based-FA, PI-based-GA, conventional PI, PI-based-DE, PI-based-BFOA, PI-based-BFOA-PSO, PI-based-PSO, and PI-based-FA as displayed in Table 4. The results presented in Table 4 effectively highlight the superior performance of the proposed FOPID-NNA controller compared to other optimization-based controllers, emphasizing its robustness and efficiency in load frequency control applications. The FOPID-based NNA controller achieves the lowest ITAE (0.05903) and significantly shorter settling times for frequency deviations (Δf1 = 2.4628 s, Δf2 = 3.0024 sΔf1 = 2.4628 s, Δf2 = 3.0024 s) and tie-line power (ΔP tie = 3.2203 s), outperforming conventional PI, PID, and various optimization approaches. The proposed controller achieves an ITAE of 0.05903, marking a 87.47% improvement over the next best PID-FA controller (0.4714) and 93.78% better than the conventional PI controller (3.5795). Regarding settling times, for Δf1, the FOPID-NNA reduces settling time by 42.1% compared to PID-FA and 55.38% relative to PI-FA. For Δf2, it achieves a 45.33% reduction over PID-FA and 58.43% over PI-FA, while for ΔP tie, the reductions are 32.63% and 42.68%, respectively. These improvements demonstrate the robustness and efficiency of the NNA-based optimization, significantly outperforming methods like BFOA, DE, PSO, FA, and hybrid approaches in dynamic response and error minimization.
| Optimization approach (controller) | Reference | Settling times (s) | Objective value | ||
|---|---|---|---|---|---|
| ∆PTIE | ∆f2 | ∆f1 | ITAE | ||
| BFOA (PI) | [55] | 6.35 | 7.09 | 5.52 | 1.8379 |
| BFOA-PSO (PI) | [56] | 5.73 | 7.65 | 7.39 | 1.1865 |
| DE (PI) | [54] | 5.75 | 8.16 | 8.96 | 0.9911 |
| PSO (PI) | [56] | 5.0 | 7.82 | 7.37 | 1.2142 |
| GA (PI) | [55] | 9.37 | 11.39 | 10.59 | 2.7475 |
| FA (PID) | [55] | 4.78 | 5.49 | 4.25 | 0.4714 |
| FA (PI) | [55] | 5.62 | 7.22 | 7.11 | 0.8695 |
| Conventional (PI) | [55] | 28.27 | 45.01 | 45 | 3.5795 |
| NNA (FOPID) | Proposed | 3.2203 | 3.0024 | 2.4628 | 0.05903 |
4.2 Simulation of Scenario 2
In this scenario, the NNA-based FOPID controller's performance analysis is evaluated in MAIPS where a SLC of 0.1 pu is applied in area 2 at t = 0 s. Table 5 displays the controller variables of Kp, Ki, Kd, and jointly with the corresponding performance indices in each area. The ITAE value from recently published control approaches, including ARA, DE, JAYA, PSO, SAMPE-JAYA, are also shown in this table for a clear comparative analysis with values of 0.0816, 0.082, 0.078, 0.077 and 0.0816, respectively. A minimum value of 0.0567 is obtained using the proposed NNA. Furthermore, when compared to ARA, DE, JAYA, PSO, SAMPE-JAYA, the proposed NNA can achieve substantial improvements in the ITAE value of 32.914%, 44.531%, 37.481%, 43.826%, and 35.718%, respectively.
| Algorithm | ARA | DE | JAYA | PSO | SAMPE-JAYA | Proposed NNA | |
|---|---|---|---|---|---|---|---|
| Controller parameters | KP1 | 2.794512 | 2.5822 | 2.017 | 2.2948 | 2.7421 | 3.1637 |
| Ki1 | 0.509808 | 0.4092 | 1.9978 | 1.1983 | 0.3762 | 0.1092 | |
| Kd1 | 0.995084 | 1.2792 | 2.403 | 1.0794 | 3 | 0.9775 | |
| n1 | 15.03582 | 409.97 | 57.928 | 500 | 307.57 | — | |
| — | — | — | — | — | 1.2028 | ||
| — | — | — | — | — | 0.9403 | ||
| KP2 | 1.865161 | 2.4546 | 1.9102 | 2.2328 | 1.9881 | 3.0919 | |
| Ki2 | 2.997782 | 3 | 3 | 2.9705 | 2.9963 | 4 | |
| Kd2 | 0.576527 | 0.6618 | 0.6106 | 0.6757 | 0.5997 | 0.8851 | |
| n2 | 166.8088 | 410.78 | 372.48 | 136.77 | 500 | — | |
| — | — | — | — | — | 1 | ||
| — | — | — | — | — | 1 | ||
| ITAE value | 0.075409 | 0.082 | 0.078 | 0.0816 | 0.077 | 0.056735 | |
| ITAE improvement % | 32.914 | 44.531 | 37.481 | 43.826 | 35.718 | — | |
As can be observed in Figure 5, the responses for the NNA-based FOPID controller illustrate some undershoots at first, but they quickly return to the zero steady-state level without undesired oscillations after an SLC of 0.1 pu. As shown, the proposed FOPID-NNA finds very small MO values of 3.36E-06, 7.7E-04 and 0.011 Hz for the frequencies and power transfer responses. Similarly, in regarding the MU indicator for the frequency responses in both areas, the proposed FOPID-NNA finds the smallest values of 0.0325 and 0.0752 Hz compared to the PID-ARA and PID-DE. Figure 5 demonstrates that NNA performs better than any of the other approaches examined while taking into account the error rate ITAE (0.0775) and STs (3.1893 s for Δf1, 1.2984 s for Δf2, and 3.3678 s for ΔPtie). This figure indicates the variation in minimal ITAE value, frequency settling time, and tie-line power variations between the proposed NNA-based PID controller and various previously published optimization approaches.
4.3 Simulation of Case Study 3
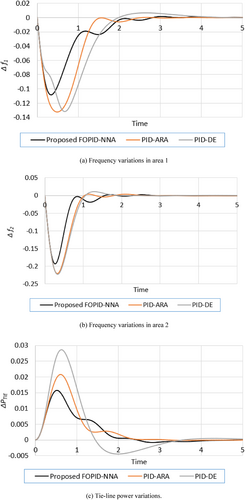
In this scenario, an SLC of 0.1 pu is applied in both areas. The suggested NNA-based FOPID controller's performance analysis is evaluated in MAIPS. Table 6 displays the controller variables of Kp, Ki, Kd, and jointly with the corresponding performance indices in each area. The analysis in Table 6 highlights the exceptional performance of the proposed NNA-based FOPID controller, particularly in terms of achieving the lowest ITAE value (0.1291) compared to other optimization algorithms like SAMPE-JAYA, PSO, JAYA, DE, and ARA. The NNA demonstrates significant percentage improvements in ITAE, with 13.25% over ARA, 33.60% over SAMPE-JAYA, 56.43% over DE, 75.86% over JAYA, and an impressive 82.21% improvement over PSO. These results affirm the NNA's superior ability to minimize control errors. This makes the NNA-based FOPID controller an advanced and reliable choice for load frequency control under varying conditions.
| Algorithm | ARA | DE | JAYA | PSO | SAMPE-JAYA | NNA | |
|---|---|---|---|---|---|---|---|
| Controller parameters | KP1 | 1.820495 | 1.5717 | 2.1068 | 1.7764 | 1.8022 | 3.501814 |
| Ki1 | 2.994891 | 2.7589 | 2.9333 | 3 | 2.6685 | 3.879404 | |
| Kd1 | 0.577278 | 0.3809 | 1.4944 | 0.9385 | 0.6436 | 0.587896 | |
| n1 | 67.01898 | 147.82 | 85.067 | 392.86 | 138.3 | — | |
| — | — | — | — | — | 1.021741 | ||
| — | — | — | — | — | 0.981918 | ||
| KP2 | 1.565437 | 2.3342 | 1.1472 | 1.562 | 1.7795 | 2.008655 | |
| Ki2 | 2.989529 | 2.9998 | 2.9487 | 2.5835 | 2.859 | 4 | |
| Kd2 | 0.462035 | 0.9962 | 0.4789 | 0.6575 | 0.4627 | 0.863688 | |
| n2 | 448.9027 | 332.55 | 489.58 | 500 | 340.75 | — | |
| — | — | — | — | — | 0.992725 | ||
| — | — | — | — | — | 0.829761 | ||
| ITAE value | 0.146308 | 0.2021 | 0.2272 | 0.2354 | 0.1726 | 0.129195 | |
| ITAE improvement % | 13.245 | 56.430 | 75.858 | 82.205 | 33.596 | — | |
The frequency and tie-line power responses in each area are contrasted in Figure 6. As shown, the proposed FOPID-NNA finds the smallest MO values of 0.003 and 0.0157 Hz for the frequency change in Area 1 and power transfer responses compared to the PID-ARA and PID-DE. Similarly, in regarding the MU indicator for the frequency responses in both areas, the proposed FOPID-NNA finds the smallest values of 0.1086 and 0.1927 Hz compared to the PID-ARA and PID-DE.
5 Conclusions
This study presented a novel approach to LFC in MAIPS comprising two area non-reheat thermal systems. The presented controller integrates a FOPID controller with the NNA. The proposed FOPID-NNA framework effectively addresses frequency fluctuations and power imbalances caused by dynamic load variations. Through comprehensive simulations across three scenarios, the simulation results demonstrated that the suggested FOPID approach is effective and dominant in reducing grid frequency oscillations caused by variations in load demand. The proposed method demonstrates marked improvements over traditional PID controllers and advanced optimization techniques such as DE and ARA. The NNA-FOPID controller achieves a 27.66%–93.78% reduction in the ITAE and minimizes frequency deviations by 42.1%–58.43%. Additionally, the system's overshoot and undershoot values are minimized to 0.0021 Hz and 0.0775 Hz, respectively, in two-area systems, with significantly faster settling times. This research establishes the NNA-FOPID controller as a robust and scalable solution for modern grid stability, paving the way for its application in real-time LFC scenarios and future advancements in renewable energy integration. Future work may focus on incorporating renewable energy sources into the system model to address challenges such as variability, intermittency, and low inertia. Moreover, applicability of NNA can be validated for other optimization engineering problems [57-59]. Additionally, the study can be extended to include key nonlinearities like generation rate constraints, governor dead bands, and system delays, enabling a more realistic evaluation of the controller's robustness under complex operating conditions.
Nomenclature
-
- ∆PD1 and ∆PD2
-
- Change in the power demands
-
- ∆PTIE
-
- Change in the tie-line power transfer
-
- u1 and u2
-
- Governor controller signals, respectively
-
- ∆f1 and ∆f2
-
- Frequency deviations in each area, respectively
-
- ACE1 and ACE2
-
- Control errors in each area, respectively
-
- Tt1 and Tt2
-
- Time constants of the turbine in each area, respectively
-
- Tg1 and Tg2
-
- Time constants of the governor in each area, respectively
-
- TP1 and TP2
-
- Time constants of the power system in each area, respectively
-
- KP1 and KP2
-
- Power system gains in each area, respectively
-
- R1 and R2
-
- Governor speed regulation constants in each area, respectively
-
- Gc(s)
-
- Controller gain transfer function
-
- Y(s)
-
- Controller's input (error)
-
- Kp, Ki and Kd
-
- Proportional, integral and derivative gains
-
- λ and μ
-
- Fractional parts of the integral and derivative controllers, respectively
-
- U(s)
-
- Error between the intended and actual values
-
- ACE1 and ACE2
-
- Area control errors in each area, respectively
-
- a and t
-
- Low and high bounds of fractional order, respectively
-
- e(t)
-
- Error among the system input
-
- ΔP12
-
- Tie-line power fluctuation between areas 1 and 2
-
- Npop
-
- Size of the population
-
- DD
-
- Problem's dimensionality
-
- PSi
-
- The ith pattern solution in the population
-
- lob and uob
-
- Lower and upper bounds, respectively
-
- f
-
- Objective function in terms of the ITAE
-
- Ci
-
- Cost of the i-th pattern solution
-
- WTARGET
-
- Weight for the target solution is denoted as
-
- PSTARGET
-
- Best target solution
-
- PSi,NEW
-
- New updated pattern solution
-
- rand
-
- A random number between 0 and 1.
-
- β(It)
-
- Bias operator randomly of the pattern solutions
-
- r'
-
- Another random number between 0 and 1
-
- Wuob and Wlob
-
- Upper and lower bounds for the weight matrix
Author Contributions
Ali M. El-Rifaie: conceptualization, investigation, writing – review and editing. Slim Abid: visualization, formal analysis, investigation. Ahmed R. Ginidi: writing – original draft, conceptualization, methodology, data curation. Abdullah M. Shaheen: writing – review and editing, software, methodology, validation, supervision.
Conflicts of Interest
The authors declare no conflicts of interest.
Appendix A
The system under investigation's nominal characteristics are:
PL = 1000 MW (nominal loading); PR = 2000 MW (rating), R1 = R2 = 2.4 Hz/pu; B1 = B2 = 0.425 pu MW/Hz; f = 60 Hz; Tt1 = Tt2 = 0.3 s; Tg1 = Tg2 = 0.08 s; KP1 = KP2 = 120 Hz/pu MW; T12 = 0.545 pu; TP1 = TP2 = 20s; a12 = −1.
Open Research
Data Availability Statement
Data sharing is not applicable to this article as no new data were created or analyzed in this study.


