Optimization and Enhancement of Tensile Strength and Elongation at Failure in Basalt/Glass Fiber Polymer Composites With MWCNTs + SiO2 Hybrid Nanofillers Using Response Surface Methodology
Funding: The authors received no specific funding for this work.
ABSTRACT
This study focuses on optimizing the tensile performance of basalt/glass fiber-reinforced polymer composites enhanced with hybrid nanofillers, comprising equal proportions of multi-walled carbon nanotubes (MWCNTs) and silicon dioxide (SiO2). The nanofiller content is evaluated at weight percentages of 0%, 1%, and 2%. Using response surface methodology (RSM), the research investigates the interactive effects of three key parameters: filler weight (0%–2%), molding pressure (5–15 MPa), and sonication time (10–30 min) on the mechanical performance of the composites. A Box–Benkhen design was adopted to develop predictive models and establish optimal processing conditions for maximizing the mechanical properties. The tensile test (as per ASTM D 638 standard) and scanning electron microscopy (SEM) were performed. It was found that filler weight plays a dominating role in the tensile performance of hybrid nanocomposites, followed by molding pressure and sonication time. A predictive mathematical model was developed for each response. The maximum tensile strength of 267 MPa and an elongation at failure of 2.25% were achieved at a filler weight of 1%, molding pressure of 15 MPa, and sonication time of 30 min, corresponding to run order 16. The hybrid nanofillers synergistically enhance the load transfer efficiency and interfacial bonding, as observed through microstructural analysis using SEM. Statistical analysis validated the accuracy and reliability of the developed models, demonstrating robust correlation coefficients between actual and predicted values. The results highlight the potential of RSM as a strong tool for optimizing hybrid nanocomposite properties, paving the way for advanced material design in structural applications.
1 Introduction
The requirement for strong and lightweight materials has increased dramatically in sectors such as civil engineering, automotive, marine, and aerospace. Despite their durability, traditional materials frequently fall short of the high-performance requirements of these domains, mostly because of their weight and restricted mechanical properties. Fiber-reinforced polymer composites are gaining widespread popularity for their outstanding mechanical strength, corrosion resistance, and design flexibility. Notably, glass fiber-reinforced polymers and basalt fiber-reinforced polymers stand out as highly promising options due to their superior mechanical performance, cost-efficiency, and excellent heat resistance. Incorporating nanofillers such as SiO2 and MWCNTs into these composites has been shown to be a highly effective method for substantially improving their tensile performance [1]. Glass and basalt fibers have a number of advantages, but their tensile strength and modulus restrictions may prevent them from being used in very demanding structural applications. Glass fibers are widely used because of their great strength, affordability, and accessibility, whereas basalt fibers offer good chemical resistance, high thermal stability, and environmental sustainability [2].
These fibers may be blended to create a hybrid composite, which has a well-balanced combination of qualities that are superior to those of each fiber alone. However, issues like fiber-matrix bonding and stress transfer efficiency make it difficult to maximize tensile performance, which is crucial for load-bearing applications. Recent research has included nanofillers such as SiO2 nanoparticles and MWCNTs in an effort to overcome these constraints [3]. Among the strongest nanomaterials, MWCNTs are renowned for their exceptional electrical conductivity, high modulus, and remarkable tensile strength [4]. Despite these advantages, it is still difficult to ensure compatibility with other fillers and achieve uniform dispersion inside the matrix. Conversely, SiO2, with its large surface area, provides advantages such as improved load transfer, chemical inertness, and thermal stability within the composite structure [5]. When combined as hybrid nanofillers, MWCNTs and SiO2 complement each other, significantly enhancing the mechanical performance of fiber-based composites, particularly under tensile stress. Leveraging the unique benefits of each nanomaterial, this hybrid approach can significantly improve energy dissipation, stiffness, and load transfer efficiency [6].
Rostamiyan et al. [7] investigated the influence of fiber orientation, nanosilica, and nano-clay weight percentages, and epoxy content on the Izod impact strength and tensile strength of a hybrid laminate composite composed of glass fiber, epoxy, SiO2, and clay. Optimization results revealed significant improvements, with tensile and impact strengths increasing by 6.4% and 203.5%, respectively, compared to Levels 1 and 14, and by 6.02% and 303.6%, respectively, compared to Levels 13 and 14. Ghasemi et al. [8] used response surface approach to examine the tensile characteristics of nanocomposites based on polypropylene (PP). The study looked at the impacts of three different amounts of glass fiber, EPDM, and graphene. It was discovered that a few key criteria significantly affect the tensile characteristics of nanocomposites. For every response, a model was displayed. Additionally, the best regions for tensile characteristics were identified. Niyaraki et al. [9] used statistical tools to enhance the mechanical characteristics, such as impact strength and elastic modulus, of hybrid nanocomposites that consist of glass fiber, graphene nanosheets, PP, and ethylene propylene diene monomer. A composition that enhances both impact strength and elastic modulus was found through optimization.
Hiremath et al. [10] investigated the effects of nanoclay, epoxy, and glass fiber on the tensile and wear properties of a ternary nanocomposite were investigated. Three types of composites were fabricated using compression molding and the hand lay-up process. The optimal performance was achieved with a combination of 4 wt% nanoclay, a 1 kg load, and a sliding distance of 300 rpm. Saberian et al. [11] employed an optimization tool to analyze the mechanical and morphological properties of glass fiber/epoxy composites. The study utilized the Box–Behnken Design to evaluate the effects of three factors: glass fiber length, glass fiber concentration, and silica nanoparticle content, each at three distinct levels. However, tensile strength improved by 13% when the glass fiber length was extended from 6 mm to 9 mm, even though elongation at break rose by 7%. A moderate addition of SiO2 decreased elongation while increasing tensile strength by 10%. Yaghoobi and Fereidoon [12] utilized, Design-Expert Software, the ideal tensile strength and modulus were predicted to be 32.7 and 2182.33 MPa, respectively. These optimal values were achieved with 28.95 wt% kenaf fiber, a fiber length of 6.22 mm, and 5 wt% PP-g-MA content. Fiber load and compatibilizer content had a major influence on the biocomposites' tensile characteristics and shape, according to scanning electron microscopy (SEM) examination and contact angle measurements.
Kunnan Singh et al. [13] examined the study and explored the relationship between two variables PTFE concentration and PTFE etch time and the mechanical properties of composites. The mechanical characteristics of POM/GF/PTFE composites, including strength, stiffness, toughness, and hardness, were evaluated in relation to these variables. To examine the impact of PTFE etching conditions on these properties, analysis of variance (ANOVA) was employed. Rostamiyan et al. [14] investigated the effects of fiber orientation and the weight percentages of nanosilica and nanoclay on the flexural strength of epoxy/glass fiber/nano SiO2/nanoclay hybrid laminate composites. Five samples were fabricated and tested, yielding an average flexural strength of 17.2 MPa. Optimization results indicated that a maximum flexural strength of 17.77 MPa could be achieved with a fiber orientation of 0°, 3.5 wt% nanosilica, and 4 wt% nanoclay. Nor et al. [15] modeled four independent factors that were optimized in kenaf/multi-walled carbon nanotube (MWCNT) hybrid composites using a three-level Box–Behnken response surface methodology (RSM). The study also revealed that the tensile properties were primarily influenced by the kenaf fiber loading among the four components.
Chieng et al. [16] investigated the tensile performance of polylactic acid/graphene-based nanocomposites. The statistical analysis of the data indicated that both temperature and graphene loading significantly influenced the tensile strength. Experimental results confirmed the optimal combination predicted by RSM, with high consistency between the observed and expected values. The model accurately predicted the tensile strength response, with an error rate of less than 2%. Mirzaei et al. [17] investigated the flexural strength and elastic modulus of PP-based nanocomposites reinforced with graphene nanosheets, basalt, and kenaf fibers. According to the findings, flexural strength increased by 12% when 0.75 wt% graphene nanosheets were added, but flexural strength decreased by 6% when 1.5 wt% graphene was added. Likewise, using up to 15 wt% kenaf fiber increased the flexural performances significantly. Shanti Kiran et al. [18] investigated the study examined the influence of various factors on the tensile and flexural properties of epoxy-glass-clay nanocomposites. The variables considered included the volume percentage of glass fiber, the weight percentage of nanoclay, and the fiber orientation angle. The optimized structure demonstrated gains of up to 30.8% in ultimate tensile strength and 36.3% in flexural strength when compared to the composite, which included 0% nanoclay (by weight), 31.5% glass fiber (by volume), and 0°/90° fiber orientation.
Rahman et al. [19] evaluated the Young's modulus and tensile strength of CNT–CF/epoxy composites by modifying the electrophoretic deposition process's parameters. RSM was employed to optimize three key parameters—volume ratio (using water as the base), deposition voltage, and deposition duration—to improve the tensile properties of the composites. Kumar et al. [20] focused on natural fiber reinforced with nanosilica in an epoxy resin matrix that was used to create the polymer composites. Bamboo fibers were combined with an appropriate amount of nano SiO2 to fabricate the composites. A quadratic mathematical model with an excess coefficient was identified as the best fit, resulting in an R2 value for the composite.
Although previous studies have not explored the optimization of tensile performances in basalt/glass fiber-strengthened polymers filled with hybrid nanofillers, this research addresses that gap. Polymer composite laminates were fabricated by reinforcing basalt/glass fibers and incorporating MWCNTs + SiO2 hybrid nanofillers to improve tensile performance. The main goal of this research is to create a regression model using the design of experiment. The model focuses on enhancing tensile strength and elongation at failure by considering key parameters such as filler weight, molding pressure, and sonication time, with filler contents of 0%, 1%, and 2%.
2 Experimental Studies
2.1 Selection of Materials
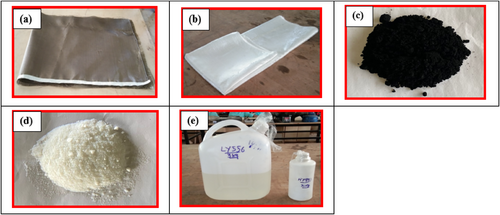
In this work, the following materials were provided by Hayael Aerospace Solutions, Chennai, India. Araldite LY556 epoxy matrix was used as a primary bonding material in composite laminate manufacturing. The average viscosity and density of epoxy matrix at 25°C was 1.7 g/cc, 10,500 mPa·s and the flash point temperature was greater than 200°C. The hardener HY951 was used as a curing material in the composite system, with a viscosity and density of 15 mPa·s and 0.98 g/cc at 25°C, and the flash point temperature was > 180°C. The primary reinforcements were selected as bidirectional woven basalt fiber 200GSM and glass fiber 200GSM. The secondary reinforcements were purchased from AD Nanotech, Bangalore, India PVT. Ltd., which includes MWCNTs nanofiller with an average inner and outer diameter of 10 and 30 nm and also the silicon dioxide (SiO2) nanofiller with an average spherical diameter of 50 nm. Figure 1 displays the materials used in the fabrication of composite laminates.
2.2 Manufacturing of Nanocomposites
The hybrid nanocomposite laminates were produced through a hand lay-up process, followed by compression technique. The production process of the composites required a step-by-step procedure. First, the release agent wax is applied over the fabrication surface area to avoid the sticking of epoxy. A thin mica sheet was placed on the top and bottom areas of the mold plate to achieve a smooth and polished finish for the laminates. The composite structure consisted of 12 fiber layers, including six basalt and six glass layers. Each woven fiber layer was precisely cut to dimensions of 30 × 30 cm2 and arranged over the mold plate. The designated amount of epoxy matrix and MWCNTs-SiO2 nanofillers were thoroughly blended using an ultrasonicator for 20 min. After completing ultrasonication process, the modified epoxy matrix was then mixed with hardener in a 10:1 ratio (10 times epoxy: 1-time hardener) through the magnetic stirrer for 10 min. The material composition used in the fabrication of nanocomposites is detailed in Table 1. A consistent method was employed for the production of each composite laminate, forming the matrix system with a 10:1 ratio.
| Sample code | Fiber stacking order | Fiber (wt%) | MWCNTs + SiO2 fillers (wt%) | Matrix (wt%) |
|---|---|---|---|---|
| BG1 | 01B/02G/02B/02G/02B/02G/01B | 60 | 0 | 40 |
| BG2 | 01B/02G/02B/02G/02B/02G/01B | 60 | 1 | 39 |
| BG3 | 01B/02G/02B/02G/02B/02G/01B | 60 | 2 | 38 |
The modified epoxy resin was applied to the fiber surface on the mold plate using a combination of pouring and brushing techniques. A hand roller was then used to compress each layer evenly, effectively removing excess resin and air bubbles. This process was repeated for all 12 layers, which were stacked in a layered configuration. Figure 1 shows three composite laminates, each with varying filler content, fabricated using the manual lay-up method. To ensure uniform compression, a thin plastic sheet was placed over the mold plate before applying concentrated dead weights. The mold was then kept under pressure for 24 h at room temperature, following the supplier's curing guidelines. After curing, the woven composite was carefully removed from the mold surface. An abrasive water jet machine was used to precisely cut the composite samples to meet ASTM standards. Figure 2 illustrates the fabricated composite laminates: (a) unfilled composite laminate, (b) composite laminate with 1% filler content, and (c) composite laminate with 2% filler content.

2.3 Experimental Work
2.3.1 RSM
The best input parameters, such as filler weight (A), molding pressure (B), and sonication duration (C), for tensile strength and elongation at failure responses may be predicted using the robust statistical mathematical modeling technique known as RSM. This study utilizes RSM to identify the optimal input parameter settings for enhancing tensile properties.
2.3.2 Design of Experiment
By taking into account the filler weight, molding pressure, and sonication duration as the input independent variables, the experiment design is a very successful method for improving tensile qualities. The lists of parameters and their levels employed in the experiment's design are shown in Table 2. The RSM is employed to analyze the tensile characteristics of the fabricated hybrid nanocomposites, utilizing a three-level design categorized as low, medium, and high. The current study uses the Box–Benkhn design technique. Table 3 shows the results of 17 experiments that were conducted using the Box–Benkhn design and included different degrees of independent variables. Each response model is analyzed using ANOVA with a 95% confidence level.
| Levels | |||||
|---|---|---|---|---|---|
| Parameters | Units | Code | Low | Medium | High |
| Filler weight | % | A | 0 | 1 | 2 |
| Molding pressure | MPa | B | 5 | 10 | 15 |
| Sonication time | Minutes | C | 10 | 20 | 30 |
| Input parameters | Responses 1 and 2 | |||||
|---|---|---|---|---|---|---|
| A: Filler weight | B: Molding pressure | C: Sonication Time | Tensile strength | Elongation at failure | ||
| Std order | Run order | % | MPa | Minutes | MPa | % |
| 11 | 1 | 1 | 5 | 30 | 260 | 2.23 |
| 2 | 2 | 2 | 5 | 20 | 255 | 2.19 |
| 14 | 3 | 1 | 10 | 20 | 262 | 2.24 |
| 5 | 4 | 0 | 10 | 10 | 248 | 1.94 |
| 4 | 5 | 2 | 15 | 20 | 258 | 2.22 |
| 3 | 6 | 0 | 15 | 20 | 254 | 1.98 |
| 6 | 7 | 2 | 10 | 10 | 256 | 2.2 |
| 13 | 8 | 1 | 10 | 20 | 262 | 2.24 |
| 16 | 9 | 1 | 10 | 20 | 262 | 2.24 |
| 10 | 10 | 1 | 15 | 10 | 264 | 2.26 |
| 9 | 11 | 1 | 5 | 10 | 261 | 2.23 |
| 8 | 12 | 2 | 10 | 30 | 257 | 2.21 |
| 15 | 13 | 1 | 10 | 20 | 262 | 2.24 |
| 7 | 14 | 0 | 10 | 30 | 250 | 1.96 |
| 17 | 15 | 1 | 10 | 20 | 262 | 2.24 |
| 12 | 16 | 1 | 15 | 30 | 267 | 2.25 |
| 1 | 17 | 0 | 5 | 20 | 244 | 1.87 |
In this case, y is the response, xi is the coded variables, α is the coefficients, αi is the coefficient for linear terms, αii is the quadratic terms, αij is the interaction terms, and ε is the random error term. To anticipate the mechanical characteristics of the manufactured composites, this study employed a mathematical model Equation (1) that examined the link between the input variables A (filler weight), B (molding pressure), and C (sonication time) and the response y. Following the tensile test, 17 responses were discovered for each parameter, with three repetitions. For each composite laminate, the Box–Benkhen design matrix was analyzed using the average of the three replicates.
2.3.3 Tensile Testing
The tensile tests were carried out by using the universal testing machine with a cross-head speed of 2 mm/min per specimen according to 17 experimental runs designed using the Box–Behnken design, which accounted for three parameter levels. An automated data acquisition system captured all measurements, including tensile strength and elongation at failure under tensile loading. For accuracy, each laminate was tested five times, and the average values of tensile strength and elongation at failure were recorded.
2.3.4 Scanning Electron Microscopic Test
The fractured specimens, after conducting the tensile test, can be analyzed through SEM images. The SEM images illustrate the interlayer connection among the matrix, fillers, and fibers, along with the dispersion of nanofillers within the polymer matrix. They also reveal the various failure modes of nanocomposites due to the applications of tensile loads. Before conducting the SEM test, all of the fractured specimens were gold-coated to improve the conductivity.
3 Results and Discussion
3.1 SEM Morphology
To qualitatively detect the interfacial bonding and load transmission efficiency between the polymer matrix, basalt/glass fibers, and hybrid nanofillers, the SEM study was performed. To provide a full understanding of the composite behavior, these findings were then connected with mechanical performance data, including tensile strength and elongation at failure. The presence of voids, fiber pull-out, nanofiller dispersion, and the kind of matrix-fiber and nanofiller-matrix adhesion were among the key qualitative characteristics found in SEM images that were connected to the mechanical performance. Higher tensile strength, for instance, was associated with robust interfacial bonding, as shown in SEM, which is shown by less fiber pull-out and excellent matrix adhesion to the fibers. On the other hand, areas with poor bonding or voids were linked to decreased elongation at failure and lower tensile strength. The mechanical test findings that showed enhanced tensile capabilities were supported by the uniform dispersion of nanofillers shown in the matrix, which helped to effectively transmit stress.
Morphological studies of the fracture surfaces were performed using SEM images, as presented in Figure 3a–c. Figure 3a shows that under tensile loading, the glass and basalt fibers tend to pull away from the matrix, highlighting weak contact between the fibers and the matrix. The reason for the absence of adherence is that the surfaces of the glass and basalt fibers do not react with the polymer matrix; Khalili et al. [21] have noted a similar finding.
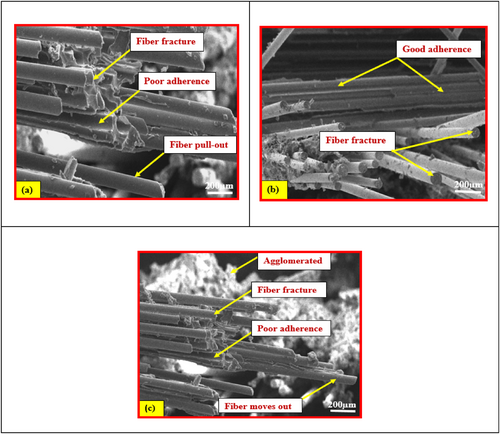
As illustrated in Figure 3b, the incorporation of 1 wt% MWCNTs + SiO2 into the nanocomposites resulted in the nanoparticles adhering to the glass and basalt fibers, enhancing the bond between the matrix and fibers as suggested by Li et al. [22]. This played a key role in filling the gaps between the fibers and matrix, thereby improving the mechanical performance of the nanocomposites. Similar findings were reported by Achaby et al. [23].
Figure 3c demonstrated that the poor dispersion of nanoparticles caused by adding 2 wt% of MWCNTs + SiO2 to the nanocomposites results in inadequate adhesion between the matrix and fiber. It is evident that nanofillers tend to agglomerate at a filler content of 2 wt%. The mechanical properties of these composites are lower than those of nanocomposites with smaller amounts of MWCNTs and SiO2, as the high surface energy of the particles leads to increased aggregation. Rahman et al. [24] reported a similar observation which shows a good agreement.
3.2 Effect of Filler Weight, Molding Pressure, and Sonication Time Parameters on Tensile Strength
In the ANOVA table, the F-value shows how the data varied from the mean. The mathematical model built is deemed statistically significant since the p value for each parameter is less than 0.05. The tensile strength ANOVA findings are shown in Table 4. The p values of the model terms A, B, C, AB, BC, A2, B, and C2 in the table demonstrate that they are statistically significant. The R2 value of 99.79%, being nearly 100%, indicates a highly valid model. Additionally, the high R2adj value of 99.52% and R2pred value of 96.67% confirm the model's exceptional predictive accuracy.
| Source | SS | df | MS | F value | p | Status |
|---|---|---|---|---|---|---|
| Model | 598.51 | 9 | 66.50 | 372.41 | < 0.0001 | Significant |
| A—Filler weight | 112.50 | 1 | 112.50 | 630.00 | < 0.0001 | |
| B—Molding pressure | 66.13 | 1 | 66.13 | 370.30 | < 0.0001 | |
| C—Sonication time | 3.13 | 1 | 3.13 | 17.50 | 0.0041 | |
| AB | 12.25 | 1 | 12.25 | 68.60 | < 0.0001 | |
| AC | 0.2500 | 1 | 0.2500 | 1.40 | 0.2753 | |
| BC | 4.00 | 1 | 4.00 | 22.40 | 0.0021 | |
| A2 | 400.26 | 1 | 400.26 | 2241.47 | < 0.0001 | |
| B2 | 1.05 | 1 | 1.05 | 5.89 | 0.0456 | |
| C2 | 1.05 | 1 | 1.05 | 5.89 | 0.0456 | |
| Residual | 1.25 | 7 | 0.1786 | |||
| Lack of fit | 1.25 | 3 | 0.4167 | |||
| Pure error | 0.0000 | 4 | 0.0000 | |||
| Cor total | 599.76 | 16 | ||||
| (R2 = 0.9979, R2adj = 0.9952, R2pred = 0.9667) | ||||||
The coefficients in Equation (2) indicate that filler weight has the greatest effect on tensile strength, with molding pressure and sonication duration having a lesser impact.
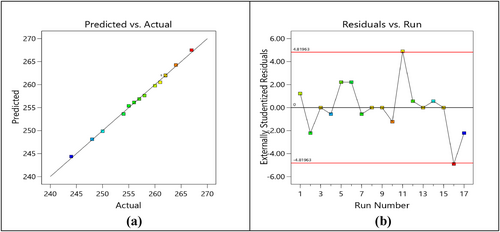
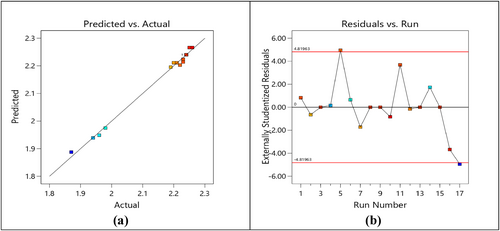
Figure 4a,b illustrates the comparison between predicted and actual tensile strength values, and the distribution of residuals relative to the run number. According to Figure 4a, the experimental and predicted tensile strength values align closely with the straight line, confirming the validity and statistical significance of the developed mathematical model. Figure 4b illustrates that the residual variations, both above and below the straight line, remain within the limits defined by the red line. This indicates that the developed model is significant.
To display the outcomes of the polynomial mathematical model, surface plots and main effects were made. A perturbation graph was created to assess the reaction of the parameters under investigation at a specific location in the design space. Figure 5 presents the perturbation graph, highlighting the impact of filler weight, molding pressure, and sonication time on the tensile performance of the hybrid nanocomposites. The tensile characteristic of the nanocomposites was found to improve with increasing filler weight, molding pressure, and sonication duration. However, tensile strength decreases when filler content is above 2 wt%.
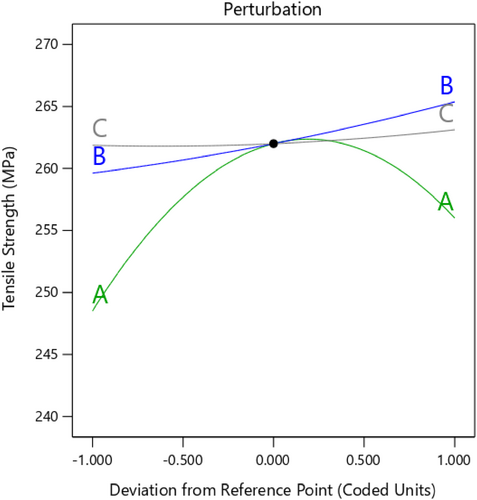
A similar study by Song et al. [25] reported a 70% enhancement in tensile performance due to the inclusion of nanoparticles. Ghasemi et al. [8] also noted that the adhesion of nanoparticles between the matrix and fiber can enhance the tensile strength. Nanoparticles, when present in low percentages and well-dispersed, act as effective adhesion agents. However, as the amount of nanoparticles increases and agglomeration occurs, their bonding role weakens, causing a reduction in properties. A similar observation was made by Milani et al. [26]. According to a thorough examination of the parameter coefficients in Equation (2), filler weight > molding pressure > sonication duration is the order of significance for each parameter's impact on the nanocomposites' tensile strength.
The three-dimensional (3D) plots for all interactions were further analyzed. Figure 6a–c displays the 3D surface plots of tensile strength as a function of (filler weight) × (molding pressure), (sonication time) × (filler weight), and (sonication time) × (molding pressure).
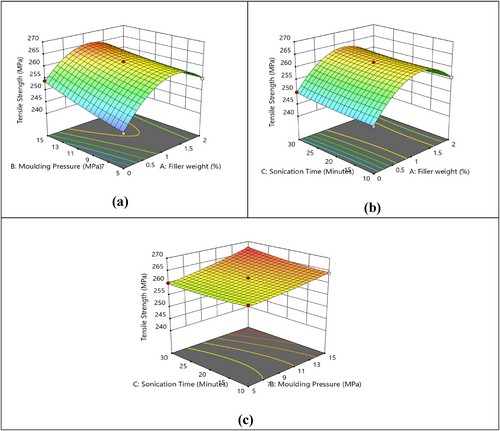
In Figure 6a, the 3D graphical response surface analysis shows that at very low filler weight, tensile strength is comparatively lower. As the filler weight increases up to approximately 1%, the tensile strength increases, reaching an optimal value. Beyond this, the tensile strength decreases, possibly due to agglomeration of fillers or poor dispersion Mirzaei et al. [27]. As the molding pressure increases, the tensile strength increases and peaks at a specific range. Beyond this, further increase in molding pressure does not significantly enhance the tensile strength, possibly due to excessive compaction that could damage the fiber or filler structure.
According to Figure 6b, it is observed that as the filler weight increases up to 1%, the tensile strength improves. This suggests that a moderate amount of filler enhances the mechanical interlocking and reinforcement within the polymer matrix [28]. As the filler weight continues to increase, the tensile strength begins to decrease, likely due to agglomeration, which can produce stress concentrations and weaken the material. Increasing the sonication time up to 20–25 min enhances the tensile strength, likely due to improved dispersion. At very long sonication times, tensile strength decreases, possibly due to over sonication, which can damage the fillers or polymer matrix.
In Figure 6c, it is noticed that when the sonication time increases, tensile performance improves significantly, indicating better dispersion of fillers. Further increases in sonication time may lead to slight degradation of tensile strength due to excessive energy causing damage to filler morphology or polymer chains. Tensile strength improves as the molding pressure increases up to 10–13 MPa. This indicates proper compaction and alignment of fibers and fillers at these pressures. Further increases in molding pressure do not significantly improve tensile strength and might even cause a slight decline due to over compaction effects.
3.3 Effect of Filler Weight, Molding Pressure, and Sonication Time Parameters on Elongation at Failure
From the ANOVA table, the p values for all parameters below 0.05, the developed model is considered statistically significant. Table 5 presents the ANOVA results for elongation at failure, indicating that the many model terms, including A, B, AB, and A2, are statistically significant according to their p values. The model's high R2 value of 99.44%, which is close to 100%, indicates strong validity. Additionally, the high adjusted R2 (98.72%) and predicted R2 (91.07%) values confirm the model's excellent predictive capability. The F value of filler weight parameter 656.91 is greater than the F value of molding pressure (20.71) and sonication time (0.2295) parameters. This indicates that the filler weight is a dominating parameter for enhancing elongation at failure and thus, the model is more valid.
| Source | Sum of square | df | Mean square | F value | p | Status |
|---|---|---|---|---|---|---|
| Model | 0.2719 | 9 | 0.0302 | 138.65 | < 0.0001 | Significant |
| A—Filler weight | 0.1431 | 1 | 0.1431 | 656.91 | < 0.0001 | |
| B—Molding pressure | 0.0045 | 1 | 0.0045 | 20.71 | 0.0026 | |
| C—Sonication time | 0.0000 | 1 | 0.0000 | 0.2295 | 0.6465 | |
| AB | 0.0016 | 1 | 0.0016 | 7.34 | 0.0302 | |
| AC | 0.0000 | 1 | 0.0000 | 0.1148 | 0.7447 | |
| BC | 0.0000 | 1 | 0.0000 | 0.1148 | 0.7447 | |
| A2 | 0.1217 | 1 | 0.1217 | 558.55 | < 0.0001 | |
| B2 | 0.0001 | 1 | 0.0001 | 0.4832 | 0.5094 | |
| C2 | 0.0002 | 1 | 0.0002 | 1.09 | 0.3318 | |
| Residual | 0.0015 | 7 | 0.0002 | |||
| Lack of fit | 0.0015 | 3 | 0.0005 | |||
| Pure error | 0.0000 | 4 | 0.0000 | |||
| Cor total | 0.2734 | 16 | ||||
| (R2 = 0.9944, R2Adj = 0.9872, R2Pred = 0.9107) | ||||||
The coefficients of the quadratic model equation were determined through multiple regression analysis, based on the ANOVA results. The resulting quadratic mathematical model, formulated using coded variables, is given in Equation (3) as follows:
The coefficients in Equation (3) indicate that filler weight has the most significant impact on the elongation at failure of the nanocomposites, followed by molding pressure and sonication time. This mathematical model (Equation 3) can be utilized to predict the input parameters influencing the elongation at failure response.
Figure 7a,b displays the comparison between predicted and experimental values of elongation at failure and the variations of residual values against run number. Figure 7a shows that all experimental (actual) and predicted values of elongation at failure closely align with the straight line. This indicates that the developed mathematical model is more valid and statistically significant. In Figure 7b, the variations of all residuals above and below the straight line against the run order are within the limit of red line. This suggests that the developed mathematical model is more robust.
Main effects and surface plots were created to visualize the outcomes of the polynomial mathematical model. Additionally, a perturbation graph was plotted to evaluate the response of the examined parameters at specific points within the design space. The perturbation graph showing the variations of filler weight, molding pressure, and sonication time on the percentage of elongation at failure of hybrid nanocomposites is illustrated in Figure 8. It was observed that an increase in filler weight, molding pressure, and sonication time led to a rise in the percentage of elongation at failure of the nanocomposites. However, at higher filler content (2 wt%), the elongation at failure decreased due to the stronger interconnection between the matrix and fibers.
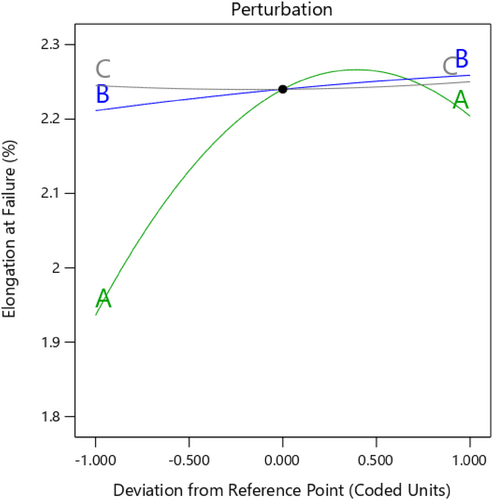
The results of Achaby et al. [22] displayed that the addition of nanoparticles greatly enhances the percentage of elongation at failure. This enhancement is attributed to the adhesion provided by nanoparticles between the matrix and fiber is consistent with findings reported by Shuai et al. [29]. When present in low concentrations with good dispersion, nanoparticles effectively act as adhesion agents. However, as the nanoparticle content increases and agglomeration occurs, the adhesion effect diminishes, weakening their contribution to elongation at failure.
Therefore, the percentage of elongation at failure is reduced. A similar study is reported by Milani et al. [8]. Upon closer examination of the coefficient parameters in Equation (3), it was observed that the factors influencing the percentage of elongation at failure in nanocomposites are ranked in the following order of significance: Filler weight, molding pressure, and sonication time.
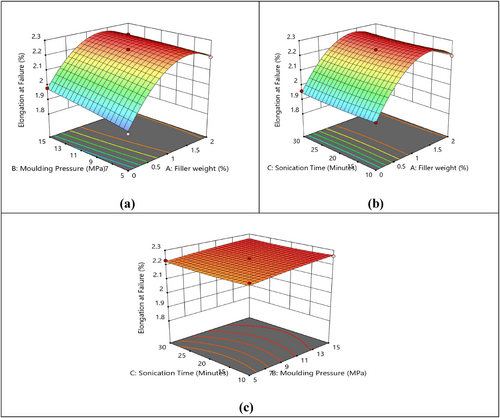
The 3D surface plots for elongation at failure of nanocomposite have been displayed in Figure 9a–c. Based on Figure 9a, as the filler weight and molding pressure increase, the percentage elongation at break enhances up to certain limit due to the proper distribution of nanofillers in polymer matrix [30]. In contrast, raising the nanofiller content to 2 wt% results in a decrease in the elongation at failure percentage, which can be ascribed to insufficient interfacial bonding between the matrix and the fibers [31-33]. In Figure 9b, it is observed that when the filler weight and sonication time increase, the percentage of elongation at break increases. However, reducing the elongation at failure due to more addition of nanofillers (2 wt%). According to Figure 9c, it is noticed that the sonication time and molding pressure increase, the elongation at break is slightly increased due to the compactions and sonication time causes damage to fiber and filler structure [34].
4 Conclusions
- The ANOVA results show that the mechanical performance of nanocomposites is mainly influenced by the filler weight (MWCNTs + SiO2), with molding pressure and sonication time having secondary effects.
- Several terms in the ANOVA table for the mechanical performance of the hybrid nanocomposites have p values< 0.05, suggesting that the developed mathematical model is valid and statistically significant.
- The highest tensile strength and elongation at failure of the hybrid nanocomposite were recorded as 267 MPa and 2.25%, respectively. These values were attained with the following input parameters: 1% filler weight (MWCNTs + SiO2), 15 MPa molding pressure, and a sonication time of 30 min for run order 16.
- The results show that the optimal conditions for tensile strength and elongation at failure of the hybrid nanocomposites were 262 MPa and 2.24%, respectively. These values were achieved with the following input parameters: Filler weight (MWCNTs + SiO2) at 1%, molding pressure at 10 MPa, and sonication time of 20 min.
- The 3D surface plots revealed the optimal regions for both tensile strength and elongation at failure percentage of the hybrid nanocomposites.
Finally, the developed hybrid nanocomposites are proposed for various lightweight structural applications such as aircraft, automobile, marine, and building constructions. This hybrid nanocomposite is best suited for severe acid and corrosion environments.
Author Contributions
T. Sathish: conceptualization, investigation, funding acquisition, writing – original draft, writing – review and editing, visualization, validation, methodology, software, project administration, formal analysis, data curation, supervision, resources. V. Boobalan: conceptualization, investigation, funding acquisition, writing – original draft, writing – review and editing, visualization, validation, methodology, software, formal analysis, project administration, data curation, supervision, resources. Jayant Giri: conceptualization, investigation, visualization, methodology, software, resources, writing – review and editing. Ahmad O. Hourani: conceptualization, investigation, visualization, methodology, validation, software, project administration, supervision, data curation, writing – review and editing. A. Johnson Santhosh: conceptualization, methodology, formal analysis, software, project administration, writing – review and editing. Faouzi Nasri: writing – review and editing, visualization, funding acquisition, investigation, methodology, formal analysis, supervision.
Acknowledgments
The authors are thankful to the Deanship of Graduate Studies and Scientific Research at the University of Bisha for supporting this work through the Fast-Track Research Support Program. The author highly acknowledges the testing facility provided by the Department of Mechanical Engineering, Saveetha School of Engineering, Saveetha Institute of Medical and Technical Sciences, Saveetha University, Chennai, India.
Conflicts of Interest
The authors declare no conflicts of interest.
Open Research
Data Availability Statement
The data that support the findings of this study are available on request from the corresponding author. The data are not publicly available due to privacy or ethical restrictions.


