Optimal Scheduling Model of Load Aggregator on Demand Side Under Demand Response
ABSTRACT
The reaction capacity of the demand side would influence the price volatility in the electricity supply and demand scenario in the spot market because of the differences in user involvement in the market. To enhance the power market's stability and dependability, a demand-side resource aggregation response optimization model is designed considering the load adjustment ability of users. First of all, a demand-side response architecture covering various forms of user participation is established, and the demand response mechanism of users in different forms of participation under this architecture is analyzed. To guarantee the sustainability of the demand response mechanism in this architecture, the market clearing model taking into account the active response of indirect consumers is created, and the appropriate settlement method is suggested. Then, the revenue problem of demand-side resource aggregators in the power market is mapped to the bidding decision problem, and the bidding optimization model of demand response under two contract modes of load reduction and load transfer is proposed. The findings indicate that demand response can improve the reliability of the distribution network and user benefit under the selected index and verify the rationality and effectiveness of the proposed method.
1 Introduction
The spot electricity market has steadily replaced the annual and monthly transactions-based electricity market as the market has grown [1, 2]. In China's electricity spot market, power grid companies dispatch the majority of small users to engage in the market, and their inherent electricity consumption behavior will lead to frequent extreme prices in the spot market and lower the market's operational effectiveness [3, 4]. As power grids become more sophisticated, demand-side resources will become more crucial to preserving system balance. Demand response refers to the market interaction behavior of users in the electricity market to adjust consumption patterns according to market prices or incentives [5]. There are two types of demand response, incentive type and electricity price type, based on the various user-side demand response forms.
More extensive domestic and international studies have been conducted on price-based demand reference [6, 7]. In developed countries, due to the early start of their electricity market, incentive demand response has been applied to the electricity market system. The domestic research on incentive demand response is lagging behind, and the related research progress is still in trial operation [8-10]. In Reference [11], a method is developed to apply and compare various demand-response mechanisms and analyze how they differ from no-demand response scenarios, emphasizing economics, environmental protection, demand curves, and other factors. By enabling residential users of smart microgrids to participate more actively, these demand response approaches help reduce fluctuations in demand and support the goals set by the electricity market model. In Reference [12], a DC energy dissipation device and control method for offshore wind power generation systems are designed, which effectively solves the problem of energy imbalance caused by AC voltage drop at the receiving end. This is of great significance for the study of new energy consumption and power system stability. In Reference [13], in order to improve the efficiency of demand response, the fixed use-time price is transformed into a dynamic response price. Comprehensive consumption satisfaction is quantified from two perspectives of comfort and economy, which can improve the profit of virtual power plants and ensure the satisfaction of consumers. At present, there are two directions in the research of incentive demand response. One is to maximize decision-making with the intention of placing a bid. The other is to maximize the approach for controlling the behavior of electricity usage [14-16]. Reference [17] carried out related research based on the demand response of electricity price type and expounded that the demand response in the electricity market will have an indirect impact on the distribution network. Aiming at the incentive demand response, the Reference [18] examined a two-layer iterative optimization method proposed to develop customized pricing-based energy storage demand response in the case of PV uncertainty. Let the virtual power plant, according to the different characteristics of the power supply side user side, formulate two parts of the electricity price, combined with the power grid price and service price to form the final price for the uncertain photovoltaic output conditions, encourage users to configure energy storage. Test results show that the rational utilization of surface energy storage can improve photovoltaic output and economic benefits. Reference [19] studied the implementation process of direct load control projects, analyzed the factors leading to users' withdrawal from direct load control, and proposed a supply–demand collaborative optimization scheduling model based on the demand-side long control scheme. Reference [20], by summarizing and analyzing the types of power consumption of different users, considering the load fluctuation and the different demands of different users for power consumption, the NSGA-II algorithm is adopted to solve the model, and the game coordinates the benefit of power supply company and user satisfaction. Reference [21] studies the changing trend of distribution network operation in view of incentive demand response but does not give a specific demand response scheduling strategy. Through the analysis of the above literature, the existing relevant studies have ignored the differences in the way users participate in the market and the response behavior, as well as the impact of demand response on the reliability of the distribution network.
This paper considers the differences in market participation methods and response behaviors of different users, designs a demand response mechanism suitable for aggregator aggregation scenarios, and gives corresponding settlement methods to improve the sustainable operation ability of the optimization mechanism. The reliability assessment of the distribution network under a demand response environment is achieved, and a bidding decision optimization model for load aggregators based on two demand response contracts of load reduction and load transfer is presented.
2 Demand Response Model Considering User Type
2.1 Framework Design of Demand Response Model
In the electricity market, users who directly participate in the market are called first-class users, and users who indirectly participate in the market are called second-class users. The second-class users use fixed electricity price settlement, which has the characteristics of a large base, strong dispersion, and no demand-side elasticity. The research object in this work is the demand response of second-class users, and the demand response mechanism architecture based on a load aggregator is designed. Through the demand response load aggregator, the second type of users are aggregated as entities providing demand response.
2.2 The Mechanism of User-Side Indirect Participation in Demand Response
From the standpoint of the power system's overall functionality, the management of load aggregation Aggregators can reduce the cost of power generation on the source side and the investment on the distribution side, increase the efficiency of the power market's operation, and better handle the challenges brought about by the growth of load for the operation of the power system and the power market. From the perspective of the load side, as a demand response mechanism based on the source measurement and the load side, the aggregator provides an opportunity for the majority of second-class users and many small and medium-sized loads to reduce electricity costs and participate in market regulation. It can fully develop the response potential of various types of loads through professional technical means, fully mobilize all kinds of potential flexible resources on the load side to respond to price fluctuations in the market, and achieve the overall improvement of terminal load power efficiency.
When the electrical market was only getting started, full power bidding and marginal price clearing are implemented. Aggregators can sign bilateral contracts for direct and indirect participants in the market to form an agent bidding decision-making mode. Aggregators can be based on the requirements of both parties to the contract and the signal stimulation of the real-time market. In the day-ahead market pre-clearing mode, the user will determine the final electricity load on the real-time market based on the new price expectation. If there is a deviation between the user's expectation of real-time electricity price and its expectation of daily electricity price, the user has room to change the load demand to improve its utility. Based on the user classification in the first section, this paper will mainly propose a demand response strategy for demand response aggregators to act as second-class users in the day-ahead market.
The market clearing price is low when the second kind of user's estimated demand is expected to be small, and the transaction power of the first type of user is high. With the gradual increase of the predicted value of the demand of the second type of users, the market clearing price increases, and the transaction power of the first type of users gradually decreases. In extreme cases, the transaction power of the first-class users even drops to a very low level. Therefore, the demand for power from second-class customers will drive up the market's clearing price and have an impact on how well the market functions.
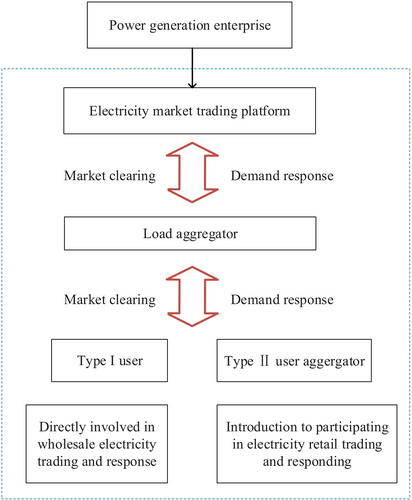
In this paper, a demand response mechanism considering demand response load aggregator is proposed. The demand response is triggered by a certain price threshold, so that the second-class users can actively participate in the demand response, adjust the day-ahead power consumption mode, and ensure the stable income of all parties involved in the response. Demand response mechanism framework as Figure 1.
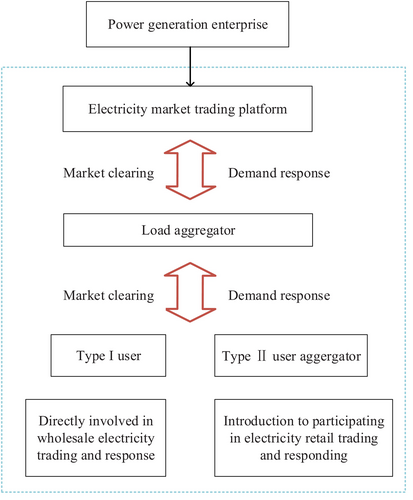
In the early stage of the electricity market, full electricity bidding and marginal price clearing were implemented, and the aggregators could sign bilateral contracts for direct and indirect participants in the market to form a proxy bidding decision-making model. According to the requirements of both sides of the contract and the stimulation of real-time market signals, the aggregator will propose a demand response strategy for the pre-day market based on user classification, mainly for the second type of agent users, as shown in Figure 2.

2.3 Model for Clearing Demand Response Based on Load Aggregator
2.4 Benefit Allocation Method of Demand Response
The expected price declared by the load aggregator is generally equal to or higher than the cost of guiding the second-class users to implement demand response. Simultaneously, to prevent the load aggregator's demand response revenue from being excessively large and preventing a certain class of customers from receiving income at a regular level, the results need to be verified after the clearing of the demand response market, that is, the income shared by a class of users must be a non-negative number, which is a necessary condition to ensure that the demand response mechanism is truly effective in the t-period. Otherwise, the initial clearing result of the original electricity market in the t-period must be retained.
3 Demand Response Bidding Decision Under Aggregator Operation Mode
3.1 Electricity Market Operation Mode
Load aggregators can aggregate small and medium-sized loads, such as residents and businesses, and act as representative entities for these load scenarios to participate in market bidding. Such users can adjust their electricity consumption behavior within the period specified in the contract and obtain corresponding profit compensation. In the day-ahead market, two bidding strategies, load reduction and load transfer, are developed to maximize the benefits of short-term load aggregators, which are predicted using methods to ascertain the market conditions in the next time beforehand. The aggregator modifies the user load in the real-time market in accordance with the time and capacity flexibility indicated in the contract.
3.2 Demand Response Bidding Decision
The price demand-side response mainly depends on the subjective judgment of the user and belongs to the category of indirect scheduling. In this mode, the dispatching center cannot force the user directly, and the user does not need to participate in the wholesale market bidding. In contrast, incentivized demand-side response projects use a direct scheduling approach. Participants are subject to scheduling, and external market conditions do not affect their response behavior. This model is characterized by rapid response, accuracy and reliability. It can quickly adapt to changes in electricity prices in the wholesale market and changes in system emergencies. Therefore, this model is more suitable for large industrial and commercial users who need to respond quickly to system signals.
In the load transfer constraint, three additional parameters are added: Transfer period transferred period of time and load transfer rate . In the process of load transfer. The load of is transferred to in proportion to .
3.3 Reliability Evaluation
is the index of system power supply shortage, that is, the reliability evaluation index selected again in this paper; is the load condition of the node; is the number of nodes in the evaluated system reliability evaluation process as Figure 3.
4 Example Analysis
4.1 Demand Response Mechanism Checking
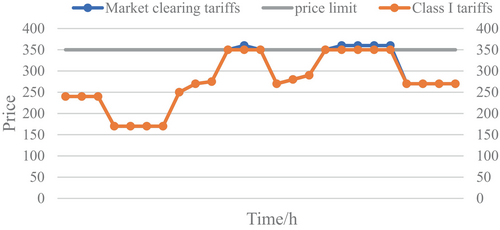
An example study is conducted in this work using the IEEE 30-bus system. Six load aggregators for class I users and 24 load aggregators for class II users are configured in the example. The demand response market is open to 10 load aggregators. The demand response mechanism's trigger condition is met when the market clearing price of the day-ahead market is above the upper limit, which is fixed at 350 yuan/MW. The demand response while taking type II users' demand response into account. Figure 4 displays the market clearing price curve of demand response taking type II users' demand response into consideration. The market clearing price and the price of type I users are brought down to below the price ceiling by means of load aggregator bidding and type II user regulation to execute demand response.
The proportion of flexible load in class II users represented by load aggregators is increased from 4% to 14% with a 2% step value. The benefits of class I users and load aggregators from demand response are shown in Table 1.
| Proportion/% | Gross income/$ | Load aggregator revenue/$ | Type I users net/$ | Type I user electricity price change/($ MW−1) |
|---|---|---|---|---|
| 4 | 11190.77 | 780 | 441.772 | −7.52 |
| 6 | 1258.99 | 1010 | 2275.99 | −4.68 |
| 8 | 1381.69 | 1320 | 61.69 | −1.01 |
| 10 | 1409.27 | 1620 | −210.73 | 0 |
| 12 | 3023.18 | 1950 | 11073.18 | −16.48 |
| 14 | 3218.77 | 2220 | 9998.77 | −14.50 |
The electricity price approved by the demand response market is much lower than the original electricity price in the day-ahead market when the proportion of flexible load is larger than 10%, and the price ceiling for type I users' electricity is only around 4% lower. It has been demonstrated that the mechanism described in this study can guarantee that type I users' power prices can be successfully decreased by the demand response during the peak demand period.
4.2 Demand Response Bidding Decision Checking
The capacity values in the example are shown in Tables 2 and 3.
| Contract | Capacity/MW | Price/($/()) | Trigger price/$ | /h | /h |
|---|---|---|---|---|---|
| 1 | 150 | 42 | 100 | 3 | 6 |
| 2 | 150 | 48 | 100 | 3 | 6 |
| 3 | 150 | 52 | 100 | 3 | 6 |
| Contract | /% | ||
|---|---|---|---|
| 1 | 10 ˜ 16 | 4 ˜ 10 | 100 |
| 2 | 14 ˜ 20 | 8 ˜ 14 | 100 |
| 3 | 16 ˜ 22 | 10 ˜ 16 | 100 |
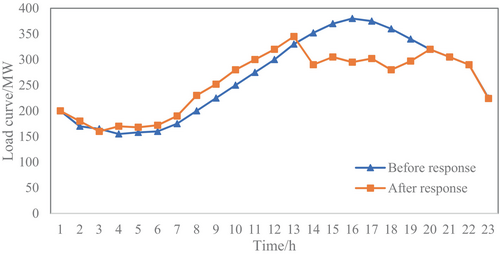
Figure 5 displays the load curve under the two contracts. The load had a peak-valley difference of 218.5 MW prior to the reaction, and a peak-valley difference of 167.3 MW following the response. It demonstrates how peak suppression and valley filling can be accomplished by integrating the two contract approaches suggested in this research to lessen the peak-valley disparity.
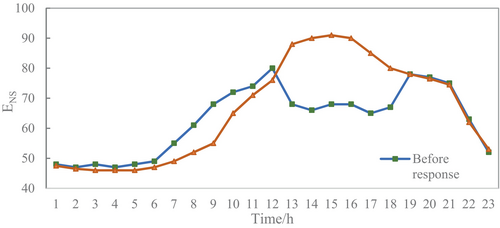
The chosen ENS index, whose changes are displayed in Figure 6, is used to assess the distribution network's dependability under the incentive demand. It is evident that the demand response's ability to successfully lessen the peak-valley disparity, the reliability of the distribution network has been significantly improved, and the average ENS index has been reduced by 2.6 MWh/year before and after the response.
5 Conclusion
Demand response is to guide users to adjust their electricity consumption behavior through electricity price signals or incentive measures, so that they become an important participant in the electricity market. In the context of achieving the dual carbon goal, the quality of the demand response strategy is directly related to the stable and safe operation of the power market. With the continuous improvement of the standardization of China's electricity market and the introduction of new environment and technology, demand side response has ushered in a broad development opportunity.
With the goal of maximizing the demand response mechanism and solving the demand response bidding decision-making challenge in the process of building China's power spot market, this paper studies the response behavior of users with different participation forms and formulates the corresponding demand response mechanism architecture. A bidding decision-making model of aggregators combining load reduction and load transfer is proposed, and the triggering conditions and response mechanism of the demand response mechanism are analyzed. Based on the proposed mechanism, a market clearing model considering the indirect participation of users under demand response is constructed. Taking their own profits as the objective function in order to accomplish peak suppression and valley filling, the behavior of aggregated commercial power is altered, and the distribution network's dependability is assessed. This method not only optimizes the power consumption behavior of users, but also has less influence on the stability of distribution network. At present, this paper only considers the optimization model of load reduction and transfer for the high electricity price of the load in the peak period, which lacks the consideration of the user's power comfort and the full mobilization and utilization of flexible resources. In the future, the above deficiencies will be studied.
Author Contributions
Ming Yu: conceptualization, methodology, project administration, software, supervision, writing – original draft. Wenyao Sun: conceptualization, project administration, software, methodology, supervision, writing – review and editing. Yi Zhao: investigation, methodology, resources, validation, writing – original draft. Xinmei Wang: investigation, methodology, software, validation, writing – original draft. Jiyu Du: investigation, methodology, resources, validation, writing – original draft. Xiaoyi Qian: investigation, methodology, software, validation, writing – original draft. Jiaxuan Sun: investigation, validation, writing – original draft, resources.
Conflicts of Interest
The authors declare no conflicts of interest.
Open Research
Data Availability Statement
The data that support the findings of this study are available from the corresponding author upon reasonable request.


