Mitigation of Volatile Chemicals' Effect on Adjacent Microtiter Plate Wells
Funding: This work was funded by a grant from the National Institute of Health/National Institute of Environmental Health Sciences (NIEHS; grant no. R44 ES033138).
ABSTRACT
In vitro new approach methodologies used to assess chemicals for biological effects are typically designed to limit the amount of test article required and to promote efficiencies such as compatibility with liquid handlers, and so forth. This is certainly true in the case of genetic toxicology, where many methods have been and continue to be developed with 96- or 384-well plate processing in mind. However, one recognized concern with microwell plates is that the volatility of test substances and/or their metabolites and/or their degradation products may affect adjacent wells. Here, we describe an approach that combines breathable membranes as well as activated carbon filters to mitigate volatility issues in 96 well plates. These experiments were performed with cyclophosphamide- and trimethylhydroquinone-exposed TK6 cells and utilized the biomarkers micronuclei, p53, γH2AX, phospho-histone H3, and nuclei to counting bead ratios to both demonstrate volatility impact and to assess the effectiveness of the solution described herein.
1 Introduction
In vitro new approach methodologies (NAMs) are often designed around the use of microtiter plates, for instance, 96- or 384-well plates, in order to limit the amount of test article required and to promote various efficiencies, for instance, the use of liquid handling devices and/or automated scoring instruments. In the area of genetic toxicology testing, the in vitro BlueScreen, MicroFlow, MultiFlow, ToxTracker, TGx-DDI, iScreen, and MEGA systems come to mind (Etter et al. 2015; Avlasevich et al. 2011; Bryce et al. 2018; Hendriks et al. 2016; Jackson et al. 2017; Wilson et al. 2021; Sun et al. 2022). One recognized concern with the use of microtiter well plates for chemical toxicity assays is the potential of chemicals to diffuse through the headspace and thereby contaminate adjacent wells (Blein et al. 1991). The volatility of a test substance and its main physicochemical driver—vapor pressure—can be complex to predict a priori. In part, this is because the volatility may stem from the parent compound itself and/or metabolite(s) and/or oxidation product(s) and/or degradation product(s) (Tolosa et al. 2021). Microtiter plated-based genetic toxicology assays are not immune to these concerns.
Here, we describe an approach that combines both breathable membranes and activated carbon filters to mitigate test substance volatility issues in 96-well plates. These experiments were performed with cyclophosphamide-exposed TK6 cells. Note that while cyclophosphamide is not highly volatile, certain metabolite(s), for instance acrolein, are (Daubert and Danner 1989). Other results, provided in Supporting Information, considered TK6 cells exposed to the highly volatile chemical trimethylhydroquinone (TMHQ) (Tolosa et al. 2021). We measured multiple biomarkers that included micronuclei, p53, γH2AX, phospho-histone H3 (p-H3), and nuclei to counting bead ratios in order to both demonstrate volatility issues and assess the effectiveness of the solution described herein.
2 Materials and Methods
2.1 Chemicals, Cells, Culture Conditions
Cyclophosphamide monohydrate (CP; CAS No. 6055-19-2) was purchased from Sigma Aldrich, St. Louis, MI. All experiments were performed with TK6 cells from ATCC (cat. no. CRL-8015). Details about growth medium and culture conditions can be found in a number of publications, including Bryce et al. (2016, 2017, 2018); Dertinger et al. (2019); and Avlasevich et al. (2021).
2.2 Cell Treatments
Details about exposure of TK6 cells to test chemicals can be found in the original reports (Bryce et al. 2016, 2017, 2018; Dertinger et al. 2019; Avlasevich et al. 2021). Briefly, treatments occurred in round-bottom 96-well plates, using DMSO as the solvent, delivered from 100× stock solutions. CP exposure occurred in two plates at each of two concentrations: 0 or 200 μM for 24 h in the presence of 0.25% rat liver S9 (phenobarbital/5,6-benzoflavone-induced, from Moltox, Boone, NC; detailed information about the S9 preparation has been described in Tian et al. 2020). One plate was covered with the manufacturer's lid, according to standard practices. The second plate was covered with VWR Rayon Films for Biological Cultures (VWR, Cat. No. 60941-084) with a piece of activated carbon filter cut to size (Honeywell, product ID Breathe Naturally HPA300 Replacement Carbon Filters) placed on top of that. These pieces were topped with the plate manufacturer's standard lid, see Figure 1. Plates were incubated at 37°C for 24 h.
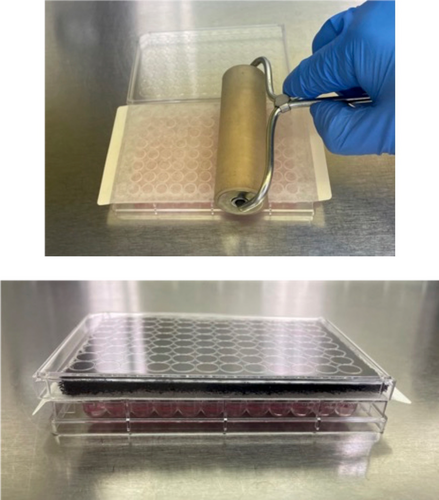
Figure 2 shows a plate map, and explains our nomenclature that describes how many rows away from the test article each row of DMSO-treated TK6 cells were, for instance “Top, 3 rows away,” “Bottom, 1 row away,” and so forth.

2.3 MultiFlow DNA Damage Assay: Cell Processing and Flow Cytometric Analysis
Details about executing the MultiFlow assay can be found in the original reports (Bryce et al. 2016, 2017, 2018; Dertinger et al. 2019; Avlasevich et al. 2021). Briefly, cells were prepared for analysis using reagents and instructions included in the MultiFlow DNA Damage Kit—p53, γH2AX, p-H3 (Litron Laboratories, Rochester, NY). Following 24 h of exposure, cells were combined with MultiFlow Complete Labeling Solution in wells of round-bottom 96-well plates. Flow cytometric analysis was carried out using a FACSymphony A1 flow cytometer equipped with a BD High Throughput Sampler.
2.4 MicroFlow Assay
Details about performing the MicroFlow assay can be found in Bryce et al. (2013). Briefly, cells were prepared for analysis using reagents and instructions included in the In Vitro MicroFlow Kit (Litron Laboratories, Rochester, NY). After 24 h of exposure, cells were stained with ethidium monoazide, then in succession combined with Complete Lysis Solution 1 and Complete Lysis Solution 2 in wells of round-bottom 96-well plates. Flow cytometric analysis was carried out with a FACSCanto II flow cytometer equipped with a BD High Throughput Sampler.
2.5 Data Analysis
Micronucleus and p-H3 values are expressed as frequency percent; γH2AX- and p53-associated fluorescence are provided as median fluorescence channel, and cytotoxicity is expressed as nuclei to counting bead ratio. Data for individual wells were graphed in JMP Pro, v18.1.1 (JMP Statistical Discovery LLC, Cary, NC) using the Variability/Attribute Gauge Chart platform. This platform also provided variance components analyses, which were used to estimate the amount of variation associated with plate location (row ID) as compared to well-to-well variation. For the variance components analyses, CP-treated wells were excluded, and only DMSO-treated wells were evaluated—this allowed us to focus the evaluation on the volatility issue.
3 Results
The MultiFlow and MicroFlow assays provided us with an opportunity to survey a number of genotoxicity- and cytotoxicity-centric biomarkers simultaneously. First, it should be noted that the breathable mat and activated carbon intervention did not significantly alter cell health and growth characteristics according to the comprehensive suite of biomarkers measured in the MultiFlow or MicroFlow assays, at least for the 96-well plate format (we have not studied 384 well plates extensively). Thus, the work presented here focuses on 96-well plates, both with and without the breathable mat and activated carbon intervention. The results are provided in the form of a series of gauge charts (Figures 3-6).
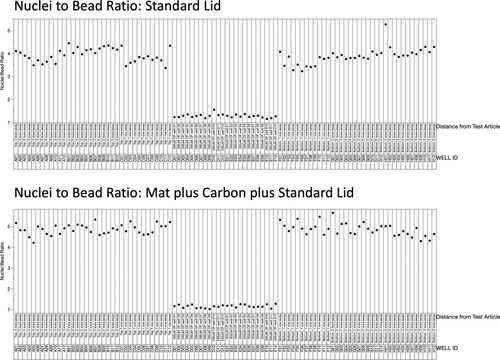
Nuclei to bead ratios are graphed in Figure 3. Twenty-four data points located in the middle of the X-axis correspond to the CP-treated cells, where a drastic reduction in the nuclei to bead ratio is evident. When one considers the plate with the standard lid (top panel), DMSO-treated cells one row above or one row below the block of CP-treated wells are observed to be somewhat reduced relative to the wells that were two or three rows away. This cross-contamination effect was eliminated when we used the breathable mat and carbon (lower panel).
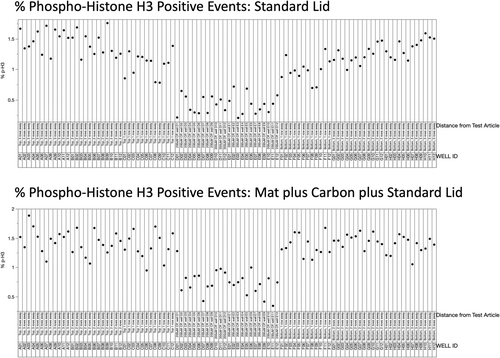
The percentage of p-H3 positive events is graphed in Figure 4. Again, the 24 data points located in the middle of the X-axis correspond to the CP-treated cells, and a consistently large reduction was observed. When one considers the plate with the standard lid (top panel), DMSO-treated cells that were one or two rows away from this block of CP-treated wells were found to be modestly reduced relative to the wells that were three rows away. As shown by Figure 4's lower panel, this neighboring well effect was mitigated when we used the breathable mat and carbon.
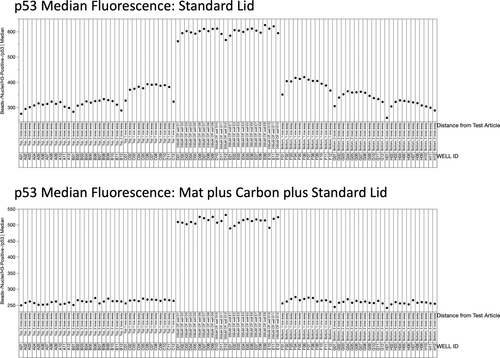
Median fluorescence associated with anti-p53 labeling is shown in Figure 5. In this case, the 24 data points located in the middle of the X-axis corresponding to CP-treated cells show elevated values, a consequence of p53 translocation to these nuclei. For the standard lid plate (top panel), DMSO-treated cells showed elevated values the closer they were to the CP-treated wells. On the other hand, the lower panel in Figure 5 shows no consequential row effect when the breathable mat and carbon were used.
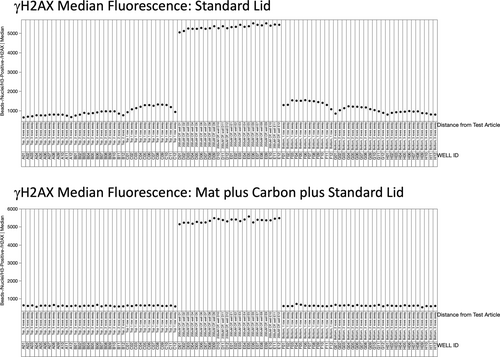
Median fluorescence associated with γH2AX induction is shown in Figure 6. As with p53, γH2AX-associated fluorescence was greatly elevated for all CP-treated wells. Furthermore, when a standard lid was used to cover the plate (top panel), DMSO-treated cells showed elevated values the closer they were to the CP-treated wells. Conversely, the plate covered with a breathable mat and carbon (lower panel) showed no appreciable cross-contamination effects.
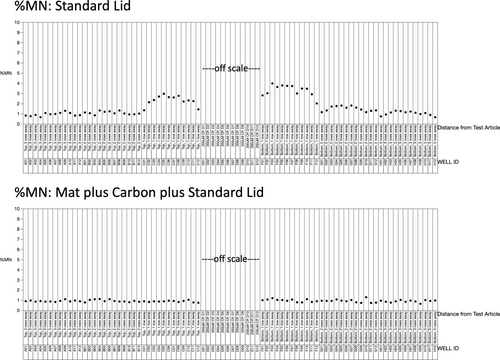
%MN results are presented in a similar fashion, see Figure 7. Note that in this case, only 12 of 24 CP-treated wells were analyzed, and the 12 values that were recorded are not shown (49% to 59%; they are off the Y-axis scale, and in any case, they are associated with an overly-cytotoxic CP concentration that was useful for stress-testing the mat/carbon intervention). In much the same way as the γH2AX and p53 biomarkers behaved, when the standard lid was used (top panel), DMSO-treated cells showed elevated %MN values the closer they were to the CP-treated wells. On the other hand, the lower panel shows that no appreciable row effect was evident for the plate with a breathable mat and carbon.
In addition to the data visualizations described above, variance components analysis of DMSO-treated wells was also performed. This allowed us to estimate the contribution that plate position had on the variability observed for each biomarker. These results are presented in Table 1, where it will be apparent that for all but one biomarker measured with a standard lid, plate position was the predominant explanatory factor. On the other hand, when a breathable mat and carbon were used, plate position was greatly reduced, and the desired source of variability—well-to-well variation—became the dominant factor.
| Plate lid, source of variation, and % of total variation | ||||
|---|---|---|---|---|
| Standard lid | Mat + carbon + standard lid | |||
| Biomarker | Well-to-well | Plate position | Well-to-well | Plate position |
| NBR | 57 | 43 | 85.2 | 14.8 |
| p-H3 | 46.3 | 53.7 | 97.5 | 2.5 |
| p53 | 20.1 | 79.9 | 59.5 | 40.5 |
| γH2AX | 16.9 | 83.1 | 99 | 1 |
| MN | 12.2 | 87.8 | 99.6 | 0.4 |
- Abbreviations: MN = micronuclei; NBR = nuclei to bead ratio; p-H3 = phospho-histone H3.
4 Discussion
Each of the several biomarkers evaluated in this experiment provided evidence that when treatment/incubation was performed using the manufacturer's standard 96-well plate lid, adjacent wells were contaminated by CP or its metabolites and/or degradation products. This was effectively mitigated by the use of a breathable mat and carbon filter. Granted, the concentration of CP (200 μM) was purposefully high for this experiment—this was done to severely challenge the mat and carbon solution. However, it should be noted that we have observed cross-well contamination effects for CP, methyl methanesulfonate, and TMHQ at concentrations that are relevant for in vitro micronucleus and MultiFlow assays. It is also worth noting that in the context of this brief communication, we have not shown results for using a breathable mat only, without the activated carbon. In short, this was effective, but not as effective as the mat and carbon combination (see results for TMHQ, provided in the Supporting Information).
It may surprise some readers to learn that CP can have such an air-diffusible contaminating effect, since it is generally regarded as having a low vapor pressure. However, in the presence of liver enzyme metabolism, CP undergoes activation to 4-hydroxycyclophosphamide, aldophosphamide, phosphoramide mustard, and acrolein (Marubello et al. 1984). Among these, acrolein is notable for its relatively high volatility (274 mmHg at 25°C; Daubert and Danner 1989). While we did not perform analyses that would formally prove this was the air-diffusible compound that was predominantly responsible for the effects we observed, it is a strong possibility.
This drives home a key implication for the work presented herein. Often, when testing uncharacterized chemicals, little information will be available about the compounds' vapor pressure. Furthermore, even when some information is available about the parent test chemical's physicochemical properties, this may be non-existent in the case of metabolite(s) and/or oxidation product(s) and/or degradation product(s). In these circumstances, it may be wise to mitigate air diffusion-based effects with breathable mats and carbon filters, so long as they do not have deleterious effects on cell health and growth properties. Finally, interested readers may wish to consider the excellent report by Tolosa et al. (2021), who studied several phenolic compounds in depth, while also providing a good overview of volatility issues in general.
Author Contributions
All authors contributed to the outlining of the manuscript. Benchtop work associated with the optimization and testing of the mats and activated carbon, as well as the experiment described herein, was performed by S.L.A., E.B., K.T., and S.M.B., S.D.D. provided an initial draft, and all authors contributed to the final editing of the manuscript.
Acknowledgments
This work was funded by a grant from the National Institute of Health/National Institute of Environmental Health Sciences (NIEHS; grant no. R44 ES033138). The contents are solely the responsibility of the authors and do not necessarily represent the official views of the NIEHS. The authors would also like to thank Dr. David Lovell; our conversations have helped us better appreciate the impact of experimental design asymmetries and sources of systemic bias.
Conflicts of Interest
The authors are employed by Litron Laboratories. Litron holds patents for flow cytometry-based analyses described herein and sells reagents and services related to the MultiFlow DNA Damage Kit—p53, γH2AX, phospho-histone H3 and the In Vitro MicroFlow Kit, both of which were used to generate the data described herein.
Open Research
Data Availability Statement
Data available on request from the authors.


