Geriatric Nutritional Risk Index predicts bleeding event in patients with heart failure
Abstract
Aims
We aimed to elucidate the association between malnutrition and the occurrence of bleeding events in patients with heart failure.
Methods and results
We evaluated the nutritional status of patients with heart failure [n = 2044, median (inter-quartile range) age 69.0 (59.0–78.0) years, 1209 (59.1%) males] using the Geriatric Nutritional Risk Index (GNRI). The primary endpoint was a composite of bleeding events such as haemorrhagic stroke or gastrointestinal bleeding. According to the survival classification and regression tree analysis, the accurate cut-off point of GNRI for predicting the primary endpoint was 106.2. We divided the patients into two groups based on GNRI levels: high GNRI group (GNRI ≥ 106.2, n = 606, 29.6%) and low GNRI group (GNRI < 106.2, n = 1438, 70.4%). We compared the patients' characteristics and prognosis between the two groups. The low GNRI group was older [72.0 (63.0–79.0) vs. 63.0 (53.0–73.0) years, P < 0.001] and had a lower prevalence of male sex (56.9% vs. 64.5%, P = 0.001). There were no differences in the use of antiplatelet agents and anticoagulants between the two groups. Levels of B-type natriuretic peptide were higher [321.1 (123.3–667.4) vs. 111.6 (42.6–235.4) pg/mL, P < 0.001] and levels of haemoglobin were lower [12.4 (10.8–13.7) vs. 14.2 (12.9–15.4) g/dL, P < 0.001] in the low GNRI group. The Kaplan–Meier analysis demonstrated that bleeding event rates were higher in the low GNRI group (log-rank P < 0.001). The multivariable Cox proportional hazard analysis revealed that low GNRI (hazard ratio 1.952, 95% confidence interval 1.002–3.805, P = 0.049) was associated with bleeding events.
Conclusions
Heart failure patients with poor nutritional status, determined by GNRI under 106.2, experienced high bleeding event rates. Comprehensive management is required to avoid bleeding event in those populations.
Introduction
Heart failure (HF) affects nutritional status, and up to half of the patients with HF are reported to be malnourished by broader definitions.1 Among many assessment tools of nutritional status, the Geriatric Nutritional Risk Index (GNRI) effectively stratifies patients with HF and predicts mortality.2, 3 The clinical impact of GNRI has been evaluated in patients with multiple diseases, and patients with low GNRI are considered to be at risk of malnutrition, more inflammation, and worse outcomes.4-8 Chronic inflammation plays a key role in atherosclerosis9 and leads to bleeding events.10, 11 However, the association between GNRI and bleeding events in patients with HF has been unclear. It is crucial to elucidate this issue, because cardiac event rate and all-cause mortality increase after bleeding events in patients with HF.12 In the present study, we evaluated patients with HF using GNRI and compared bleeding event rates between those with high GNRI and those with low GNRI.
Methods
Study population
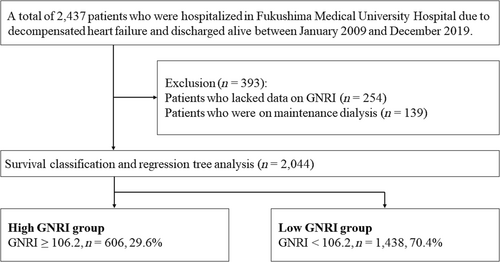
This was an observational study. Patient flowchart is shown in Figure 1. We recruited data on a total of 2437 patients who were hospitalized for decompensated HF at Fukushima Medical University Hospital and discharged between January 2009 and December 2019. Nutritional status was evaluated using GNRI. GNRI was calculated in a stable condition within 1 week prior to discharge using the following formula reported by Bouillanne et al.: GNRI = [14.89 × albumin (g/dL)] + [41.7 × (body weight / ideal body weight by Lorentz equation)].2 Patients who lacked data on GNRI (n = 254) and those who were on maintenance dialysis (n = 139) were excluded. Finally, a total of 2044 remaining patients (median age 69.0 years, 59.1% males) were analysed. Laboratory and echocardiographic data obtained within 1 week prior to discharge were used for analyses. Data on medication were based on prescriptions at discharge. Regarding antiplatelet agents, we also specified whether they were used as single or dual antiplatelet therapy. It was also compared whether oral anticoagulants were used alone or in combination with antiplatelet agents. Considering the protocols of previous major clinical trials,13, 14 we set the primary endpoint of this study as bleeding events defined as haemorrhagic stroke and/or gastrointestinal bleeding. The definitions of haemorrhagic stroke and gastrointestinal bleeding were in accordance with those in our previous study.15 Because this was the first to evaluate the impact of nutritional status as a bleeding risk in patients with HF, we sought the appropriate cut-off point of GNRI in predicting the primary endpoint using the survival classification and regression tree analysis, an implementation of conditional inference trees that embed tree-structured regression models into a well-defined theory of conditional inference procedures,16 and divided patients into two groups based on the cut-off point.

The investigation conforms to the principles outlined in the Declaration of Helsinki.17 The study protocol was approved by the ethical committee of Fukushima Medical University. All patients gave written informed consent to participate in this study.
Statistical analysis
All continuous variables analysed in this study were non-normally distributed according to the Shapiro–Wilk test and presented as median (inter-quartile range). Categorical variables were presented as numbers (%). We compared continuous and categorical variables using the Mann–Whitney U test and χ2 test, respectively. The accumulated incidence of the bleeding events was compared using the Kaplan–Meier analysis with log-rank test between the two groups. We assessed the association of GNRI and the primary endpoint using the Cox proportional hazard analysis. A hazard ratio was adjusted for two models: Model 1 (adjusted for age and sex) and Model 2 (adjusted for Model 1 and variables with P values of <0.1 in the univariable analysis). If one patient experienced two or more primary endpoints, the first event was entered into the analyses. P values of <0.05 were considered statistically significant in all analyses. The survival classification and regression tree analysis was conducted using EZR Version 1.40 (Saitama Medical Center, Jichi Medical University, Saitama, Japan), which is a graphical user interface for R (The R Foundation for Statistical Computing, Vienna, Austria).18 All other analyses were performed using IBM SPSS Statistics Version 28.0.1.0 (IBM, Armonk, NY, USA).
Results
According to the survival classification and regression tree analysis (Figure 1), the accurate cut-off point in predicting the primary endpoint was 106.2, according to which the patients were divided into the high GNRI group (patients with GNRI ≥ 106.2, n = 606, 29.6%) and low GNRI group (those with GNRI < 106.2, n = 1438, 70.4%).
The comparisons of patient characteristics are summarized in Table 1. The low GNRI group was older (72.0 vs. 63.0 years, P < 0.001) and had a lower prevalence of male sex (56.9% vs. 64.5%, P = 0.001). In terms of bleeding risks, the low GNRI group had lower systolic blood pressure (121.0 vs. 123.0 mmHg, P = 0.035) and higher prevalence of atrial fibrillation (42.1% vs. 34.3%, P < 0.001). However, the use of antiplatelet agents and anticoagulants was comparable between the two groups. The use of proton pump inhibitor was more prevalent in the low GNRI group (65.2% vs. 60.4%, P = 0.038). In the laboratory data, the low GNRI group had higher levels of B-type natriuretic peptide (321.1 vs. 111.6 pg/mL, P < 0.001) and lower levels of haemoglobin (12.4 vs. 14.2 g/dL, P < 0.001) and estimated glomerular filtration rate (56.2 vs. 61.7 mL/min/1.73 m2). In the echocardiographic data, left ventricular ejection fraction was comparable between the two groups.
| Total (n = 2044) | High GNRI group (n = 606) | Low GNRI group (n = 1438) | P value | |
|---|---|---|---|---|
| GNRI | 99.8 (91.5–108.2) | 112.8 (109.2–117.2) | 95.3 (88.3–100.5) | <0.001 |
| Albumin (g/dL) | 3.8 (3.4–4.2) | 4.3 (4.1–4.5) | 3.7 (3.2–4.0) | <0.001 |
| Body weight (kg) | 57.5 (49.3–66.9) | 68.1 (59.6–78.5) | 53.7 (46.6–61.4) | <0.001 |
| Age (years) | 69.0 (59.0–78.0) | 63.0 (53.0–73.0) | 72.0 (63.0–79.0) | <0.001 |
| Male sex, n (%) | 1209 (59.1) | 391 (64.5) | 818 (56.9) | 0.001 |
| Systolic BP (mmHg) | 122.0 (108.0–139.0) | 124.0 (110.0–138.0) | 121.0 (106.0–139.0) | 0.035 |
| Hypertension, n (%) | 1360 (66.5) | 419 (69.1) | 941 (65.4) | 0.105 |
| Diabetes mellitus, n (%) | 774 (37.9) | 230 (38.0) | 544 (37.8) | 0.958 |
| CAD, n (%) | 599 (29.3) | 172 (28.4) | 427 (29.7) | 0.552 |
| Atrial fibrillation, n (%) | 814 (39.8) | 208 (34.3) | 606 (42.1) | <0.001 |
| RASIs, n (%) | 1405 (68.7) | 441 (72.8) | 964 (67.0) | 0.011 |
| Beta-blockers, n (%) | 1463 (71.6) | 442 (72.9) | 1021 (71.0) | 0.376 |
| Loop diuretics, n (%) | 1393 (68.2) | 366 (60.4) | 1027 (71.4) | <0.001 |
| Antiplatelet agents, n (%) | 987 (48.3) | 286 (47.2) | 701 (48.7) | 0.521 |
| Status of antiplatelet agents, n (%) | 0.188 | |||
| None | 1057 (51.7) | 320 (52.8) | 737 (51.3) | |
| SAPT | 614 (30.0) | 166 (27.4) | 448 (31.2) | |
| DAPT | 373 (18.2) | 120 (19.8) | 253 (17.6) | |
| OACs, n (%) | 1190 (58.2) | 349 (57.6) | 841 (58.5) | 0.708 |
| Status of OACs, n (%) | 0.413 | |||
| None | 854 (41.8) | 257 (42.4) | 597 (41.5) | |
| Monotherapy | 617 (30.2) | 191 (31.5) | 426 (29.6) | |
| Combination | 573 (28.0) | 158 (26.1) | 415 (28.9) | |
| PPIs, n (%) | 1304 (63.8) | 366 (60.4) | 938 (65.2) | 0.038 |
| BNP (pg/mL) | 225.3 (81.1–549.9) | 111.6 (42.6–235.4) | 321.1 (123.3–667.4) | <0.001 |
| Haemoglobin (g/dL) | 12.9 (11.3–14.4) | 14.2 (12.9–15.4) | 12.4 (10.8–13.7) | <0.001 |
| eGFR (mL/min/1.73 m2) | 58.1 (44.3–71.7) | 61.7 (48.8–74.8) | 56.2 (41.8–70.5) | <0.001 |
| LVEF (%) | 54.6 (39.5–64.0) | 56.3 (41.8–65.0) | 54.0 (39.0–63.5) | 0.058 |
| Type of HF, n (%) | 0.145 | |||
| HFrEF | 390 (25.6) | 106 (23.0) | 284 (26.7) | |
| HFmrEF | 237 (15.6) | 66 (14.3) | 171 (16.1) | |
| HFpEF | 897 (58.9) | 288 (62.6) | 609 (57.2) |
- BNP, B-type natriuretic peptide; BP, blood pressure; CAD, coronary artery disease; DAPT, dual antiplatelet therapy; eGFR, estimated glomerular filtration rate; GNRI, Geriatric Nutritional Risk Index; HF, heart failure; HFmrEF, heart failure with mildly reduced ejection fraction; HFpEF, heart failure with preserved ejection fraction; HFrEF, heart failure with reduced ejection fraction; LVEF, left ventricular ejection fraction; OACs, oral anticoagulants; PPIs, proton pump inhibitors; RASIs, renin–angiotensin system inhibitors; SAPT, single antiplatelet therapy.
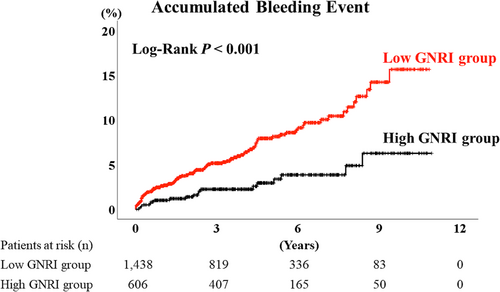
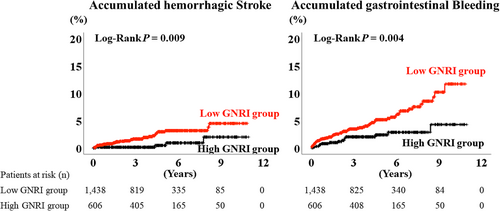
During the post-discharge follow-up period, median 1378 days, there were 115 bleeding events (34 cases of haemorrhagic stroke, 80 cases of gastrointestinal bleeding, and 1 case of both haemorrhagic stroke and gastrointestinal bleeding). The Kaplan–Meier analysis demonstrated that the accumulated bleeding event rate was higher in the low GNRI group (Figure 2, log-rank P < 0.001). Moreover, the accumulated each event rates of haemorrhagic stroke and gastrointestinal bleeding were also higher in the low GNRI group (Figure 3, log-rank P = 0.009 and 0.004, respectively). The multivariable Cox proportional hazard analysis revealed that low GNRI as a categorical variable (hazard ratio 1.952, 95% confidence interval 1.002–3.805, P = 0.049) was independently associated with bleeding events (Table 2, Model 2).


| Hazard ratio | 95% confidence interval | P value | |
|---|---|---|---|
| Low GNRI (vs. high GNRI) | 2.567 | 1.552–4.245 | <0.001 |
| Low GNRI (vs. high GNRI) Model 1 | 2.297 | 1.374–3.842 | 0.002 |
| Low GNRI (vs. high GNRI) Model 2 | 1.952 | 1.002–3.805 | 0.049 |
| GNRI (continuous variable) | 0.968 | 0.956–0.981 | <0.001 |
| GNRI (continuous variable) Model 1 | 0.970 | 0.957–0.983 | <0.001 |
| GNRI (continuous variable) Model 2 | 0.991 | 0.969–1.013 | 0.432 |
- GNRI, Geriatric Nutritional Risk Index.
- Model 1: adjusted for age and sex. Model 2: adjusted for age, sex, systolic blood pressure, atrial fibrillation, renin–angiotensin system inhibitors, loop diuretics, proton pump inhibitors, log-transformed B-type natriuretic peptide, haemoglobin, estimated glomerular filtration rate, and left ventricular ejection fraction.
Discussion
This present study revealed that ~70% of patients with HF were under the cut-off point of GNRI regarding bleeding event. Contrary to the lower blood pressure, similar use of antithrombotic agents, and higher use of proton pump inhibitors in the low GNRI group, low GNRI was independently associated with the composite endpoint of haemorrhagic stroke and/or gastrointestinal bleeding. These findings are important because they suggest that clinicians should provide advanced comprehensive care beyond blood pressure control and antithrombotic management to avoid bleeding events in malnourished patients with HF.
The association between malnutrition and inflammation has been observed in patients who are at high bleeding risk, such as those with end-stage renal disease and coronary artery disease.10, 19 In those populations, malnutrition and inflammation make a vicious cycle called malnutrition–inflammation–atherosclerosis syndrome, which results in low quality of life and high mortality.10, 20 In addition to this hypothesis, this study indicated other mechanisms between malnutrition and bleeding events. Considering the patients' characteristics, levels of B-type natriuretic peptide were higher in the low GNRI group, suggesting that congestion was more severe in that group.21, 22 Right heart congestion causes intestinal congestion and alters gastrointestinal function, which results in gastrointestinal bleeding.12, 23-25 In addition, hypoperfusion is another aspect of severe HF.26 Lower blood pressure in the low GNRI group indicated low cardiac output and advanced HF.27 Abdominal hypoperfusion also causes abdominal symptoms, intestinal dysfunction, and gastrointestinal bleeding.12, 25, 28, 29 In addition to abdominal congestion that causes early satiety and nausea, chronic inflammation and consequent metabolic disturbance induce malnutrition and cachexia, making a vicious cycle.30 Other characteristics of the low GNRI group that were associated with bleeding events included age,31-33 female sex,34, 35 lower levels of haemoglobin,32, 36 and lower levels of estimated glomerular filtration rate.32, 37
The cut-off value, GNRI of 106.2, for predicting bleeding events in patients with HF was close to the boundary between no and low nutritional risks.2 This result suggests that bleeding risk easily increases with a small deterioration of nutritional status in patients with HF. To assess the nutritional status, body mass index is one of the simplest assessment tools.38 However, body mass index is inappropriate to predict bleeding events because both low and high body mass indexes are associated with major bleeding.32 Some patients with high body mass index have sarcopenic obesity, which is associated with high mortality.39 The major conditions of malnutrition are traditionally classified as marasmus, kwashiorkor, or both.40 Marasmus is inadequate energy-calorie intake and presents with low body weight, whereas kwashiorkor is a protein deficiency resulting in hypoalbuminaemia.40 Thus, GNRI, which uses albumin and body weight comprehensively, is an appropriate tool for evaluating nutritional status.
The present study had some limitations. First, we did not collect data on highly sensitive C-reactive protein as a marker of inflammation. Second, doses of antiplatelet agents and anticoagulants were not analysed.
In conclusion, we evaluated nutritional status of patients with HF and found a threshold of GNRI for bleeding event. The threshold of GNRI was relatively low, and patients with low GNRI showed more severe HF status. Low GNRI was independently associated with bleeding events. Patients with poor nutritional status require comprehensive management including prevention of bleeding events.
Acknowledgements
The authors thank Ms Kumiko Watanabe, Ms Yumi Yoshihisa, and Ms Tomiko Miura for their technical assistance.
Conflict of interest
None declared.
Funding
This work was supported by Grants-in-Aid for Scientific Research (Grant Numbers 20K07828 and 22K15670) from the Japan Society for the Promotion of Science.


