Time course of red cell volume and plasma volume over six months in compensated chronic heart failure
Abstract
Background
In patients with chronic heart failure (CHF), volume overload is usually described as an expansion of plasma volume (PV). Additional red cell volume (RCV) expansion also occurs in a relevant fraction of compensated CHF patients. So far, little is known about the stability of these vascular volumes and possible volume excess in compensated CHF patients over time.
Methods and results
This study aims at quantification of blood volume and its components, RCV and PV (raw values and adjusted for sex and anthropometric characteristics, expressed as per cent of the expected normal value), using an abbreviated carbon monoxide (CO) rebreathing method (aCORM) in 14 patients (two women) with systolic CHF at baseline and at a follow-up visit after approximately 6 months. While a vast heterogeneity was observed concerning RCV (82% to 134% of normalized alues) and PV (72% to 131% of normalized values), the vascular volumes showed a mean change of 1.2% and −1.3% after a mean follow-up of 183 days.
Conclusions
The vascular volumes including individual volume excess appear to be stable in compensated CHF patients. The reason for this individual volume response concerning both RCV and PV in CHF remains unclear and deserves further clarification.
Background
Although blood volume (BV) distribution is heterogeneous in chronic heart failure (CHF), in many patients, volume overload is described as plasma volume (PV) expansion, especially in a decompensated state.1-3 Although it has been shown that recompensation may lead to significant reduction of PV,1 more recent data describe only slightly reduced intravascular volumes after diuretic therapy.4 Little is known about the stability of PV or red cell volume (RCV) in compensated CHF patients over time. This may be of interest as the increased RCV was hypothesized as a compensatory mechanism for a reduced ejection fraction (EF).5
Aims
The aim of this study is the quantification of BV (RCV and PV) using an abbreviated carbon monoxide (CO) rebreathing method (aCORM) in compensated patients with CHF and reduced EF at baseline and at a follow-up visit after approximately 6 months.
Methods
Study design and subjects
The study was designed in line with the latest revised form of the Declaration of Helsinki and approved by the local hospital's ethics committee (31/14). The study is registered in the German registry for clinical studies (DRKS-ID: DRKS00006078).
In a longitudinal design, haemoglobin mass (Hbmass), RCV, PV, and BV were determined in patients with known compensated systolic CHF with a left ventricular EF < 50%. We included 14 patients (two women) from either the outpatient heart failure unit or cardiology ward after providing signed informed consent.
Determination of haemoglobin mass and blood volumes
aCORM was applied in all subjects for determination of Hbmass and, subsequently, BVs.6 In brief, aCORM allows determination of the vascular volume by inhaling a defined CO volume using a closed-circuit spirometer (SpiCO, Blood Tec, Germany) and taking capillary blood samples to be analysed for their carboxyhaemoglobin concentration [COHb] at specific time points after the inhalation (indicator dilution principle). The capillary samples were analysed with a standard point-of-care blood gas analyser (Radiometer ABL 700series, Radiometer, Denmark). Hbmass was calculated from the change in [COHb] as described previously.6 Intravascular volumes (RCV, PV, and BV) can then be calculated (for formula, see Heinicke et al.7).
For both sexes, the normalized BVs were calculated as it was previously described by our group.5
Statistical analysis
Data for this study were managed using SAS JMP 9.0, and the conventional statistical analyses were performed using R.8 A two-tailed, matched-pairs t-test was used to test for an effect of time point. Explanatory factors [change in body weight, kidney function (serum creatinine), left ventricular end-diastolic diameter, and diastolic function (E/e' mean) for the change in normalized RCV and PV] were analysed using simple correlation analysis (Spearman rho). The alpha level was set at 0.05.
Results
The study group consisted of 14 patients (two women) with a mean age 56 ± 10 years, mean weight of 89.2 ± 21.5 kg, and body mass index of 28.6 ± 4.0 kg/m2. The mean EF was 30 ± 9% (modified Simpson's rule available in nine subjects). The aetiology of chronic systolic heart failure was dilatative cardiomyopathy in seven cases, ischaemic cardiomyopathy in four cases, previous myocarditis in two cases, and valvular heart disease in one case. New York Heart Association (NYHA) class distribution was three patients in NYHA I, four patients in NYHA II, and seven patients in NYHA III. One patient had a diabetes mellitus.
The mean follow-up period was 183 ± 96 days (median 174.5 days). During the study period, there were no unexpected events such as hospitalizations or clinical events based on the information provided by patients.
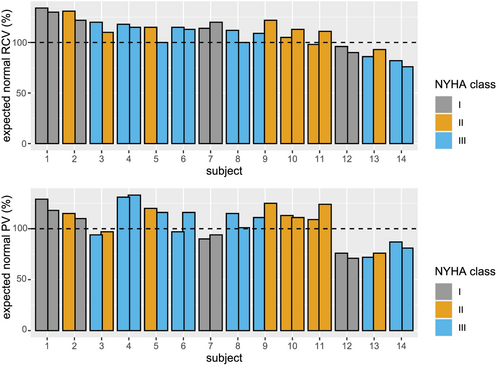
Vascular volumes, selected serum parameters, and possible explanatory parameters are displayed in Table 1 including information on diuretics used at the two time points. In one patient (subject #1 in Figure 1), the primary care physician discontinued the loop diuretic. In another subjects (#14), a thiazide diuretic was added. Individual measurements for the expected normal values for RCV and PV at each time point are depicted in Figure 1. The range of the actual RCV vs. the expected normal value is 82% to 134%. For PV, this range is 72% to 131%. The mean percentage difference between follow-up and baseline is 1.2% for RCV and −1.3% for PV.
| Parameter | Baseline | Follow-up | P |
|---|---|---|---|
| Hbmass (g) | 911 ± 259 | 914 ± 237 | 0.905 |
| BV (mL) | 6612 ± 1777 | 6632 ± 1756 | 0.887 |
| PV (mL) | 3983 ± 1073 | 4033 ± 1085 | 0.617 |
| PV (% of expected) | 104.2 ± 18.5 | 105.2 ± 19.2 | 0.707 |
| RCV (mL) | 2629 ± 762 | 2599 ± 729 | 0.626 |
| RCV (% of expected) | 109.6 ± 15.1 | 108.2 ± 14.7 | 0.573 |
| Hct (%) | 43.4 ± 4.4 | 42.9 ± 4.2 | 0.345 |
| Body weight (kg) | 89.3 ± 21.5 | 90.2 ± 21.4 | 0.361 |
| Serum creatinine (mg/dL) | 1.04 ± 0.2 | 1.08 ± 0.19 | 0.380 |
| Glomerular filtration rate (mL/min/1.73m2) | 80.0 ± 18.5 | 79.1 ± 16.9 | 0.239 |
| LVEDD (mm) | 65.7 ± 13.1 | 64.7 ± 10.1 | 0.095 |
| E/e' mean | 11.6 ± 5.1 | 12.1 ± 3.3 | 0.912 |
| NT-proBNP (pg/mL)a | 1455 ± 1132 | 1158 ± 866 | 0.329 |
| Diuretic therapy (N, any diuretic) | 8 | 7 | |
| Loop diuretic (N) | 8 | 7 | |
| Thiazide (N) | 1 | 2 | |
| Other (N) | 1 | 0 | |
| Eplerenone (N) | 11 | 11 |
- BV, blood volume; E/e' mean, surrogate marker for diastolic function; Hbmass, total haemoglobin mass; LVEDD, left ventricular end-diastolic diameter; PV , plasma volume; RCV, red cell volume.
- Data presented mean ± SD. N indicates the number of patients. P indicates the P value. Eplerenone was not included as diuretic therapy despite mild diuretic properties. Glomerular filtration rate as estimated by the CKD-EPI equation.
- a Six missing values.

Correlation analysis reveals that a change in serum creatinine is inversely associated with the change in the excess PV (rho = −0.70, P = 0.043), whereas the change in glomerular filtration rate (as estimated by the CKD-EPI formula) is positively associated with the change in excess PV (rho = 0.73, P = 0.02). A change in excess PV is associated with a change in excess RCV (rho = 0.67, P = 0.008). All other parameters (left ventricular end-diastolic diameter, E/e'mean, body weight, and NT-proBNP) did not show significant correlation with excess RCV or PV. The association between the change in excess PV and the change in NT-proBNP did not reach statistical significance (rho = 0.62, P = 0.086).
Discussion
The main finding of this study is that despite a vast heterogeneity in measured BVs at the beginning of the study, volumes show only small alterations over time. Because so far, data from follow-up measurements seem available only from a single study,9 we expand the knowledge of the longitudinal stability of BV. Albeit follow-up was shorter here, our results confirm the data of Miller et al. describing a persisting heterogeneity but stable volume profiles in the individual patients over a 1-year interval.9 Interestingly, similar data are obtained despite application of different techniques for BV assessment being radioactively labelled albumin9 and a CO rebreathing method supporting the validity of the data. As observed by our group in a larger cross-sectional study,5 there was no clear association between NYHA class and volume status in the tested patients.
As serum creatinine is inversely associated with the change in the excess PV in this set of compensated patients, it supports the concept that a certain degree of PV expansion may ensure kidney function and the compensated state.10 In this context, a change in PV excess above expected normal values was correlated with RCV excess, which was assumed to be another compensatory mechanism for decreased cardiac output5 and can be found in up to 66% of patients.3, 5, 11 From a clinician's standpoint, it is worth mentioning that the clinical course was stable despite individually increased or decreased BVs. The reason for the individual different regulation of BV in CHF deserves further clarification.
Three subjects (Figure 1, 12–14) show a lower than expected RCV. When analysing their haematocrit values, subjects 12 and 13 featured average haematocrit values of 52.5% and 48.5%, which would suggest polyglobulia rather than a low oxygen transport capacity. Subject 14 features a haematocrit of 39%. These three subjects in particular highlight the limitations of conventional, concentration-based indices of RCV in heart failure patients.
In summary, the persisting heterogeneity of BV supports the concept of individualization of BV management12 as an accurate clinical assessment of volume status remains challenging.
Acknowledgement
Open access funding enabled and organized by Projekt DEAL.
Conflict of interest
We state that all authors did not receive third party funding related to this project. All authors declare they have no conflict of interest.
Funding
This study was conducted based on funding by the investigator sites. No external funding was provided for conduction of this study. The publication fees will be covered by the local university as part of the DEAL agreement.
Author contributions
CA and TP contributed to conception and design, analysis and interpretation of data, drafting, and revising the manuscript. FS and PB contributed to acquisition, analysis, and interpretation of data and revising the manuscript. DS, SG, and CB contributed to conception and design and revising the manuscript critically for important intellectual content. All above authors have approved the final manuscript.


