Numerical Simulation Study on the Seismic Response of Shield Tunnels in Liquefiable Interlayer Site
ABSTRACT
Soil liquefaction under seismic loading poses a significant threat to the structural safety of shield tunnels, especially those located in liquefiable interlayered grounds, which are more prone to severe damage. This study employs the CycLiqCPSP model to develop a two-dimensional saturated soil-shield tunnel interaction framework, examining seismic responses of shield tunnels under five spatial configurations of liquefiable soil layers. Resonant column tests and triaxial tests were conducted to calibrate the constitutive model parameters for liquefiable soils in the Beijing area, and the accuracy of these parameters was validated through element test simulations. The results indicate that, compared with shield tunnels in homogeneous liquefiable soils, the spatial distribution of liquefiable interlayers has a significant impact on the seismic response of the soil-structure interaction system. This influence leads to increased deformation, internal forces, and significantly higher damage levels in the tunnel structure. When the tunnel's base crosses the liquefiable layer, lateral deformation is notably amplified, causing severe structural damage and representing the most adverse seismic design scenario. Additionally, during seismic events, drainage channels may form in the middle section of double-track tunnels, heightening the risk of liquefaction. The study also reveals that the internal forces and deformations at the tunnel's haunches and toes are significantly higher than at other locations, necessitating special attention to these areas for potential damage. These findings offer essential theoretical guidance and scientific insights for the seismic design of shield tunnels in liquefiable interlayered grounds under strong earthquakes.
1 Introduction
The scientific development of underground space is a crucial direction for future urban development, with subway systems, as key infrastructure, experiencing a construction boom. Shield tunneling has become the most widely used technique for subway tunnel construction due to its minimal environmental constraints, high safety, and fast construction speed [1]. Historical earthquake disasters have shown that underground structures in liquefiable soils often suffer from uplift, uneven settlement, shear misalignment, and joint leakage [2]. As long-linear underground structures, subway tunnels inevitably cross saturated soils with varying degrees of liquefaction risk [3, 4]. Investigating the seismic response behavior of tunnel segments in liquefiable soils represents a critical scientific challenge that requires immediate attention.
In numerical simulations, accurately describing the dynamic fluid-solid coupling behavior of saturated sandy soils is critical. To date, various constitutive models have been proposed to characterize seismic liquefaction, including generalized elastoplastic models [5], subloading surface models [6], multiple yield surface models [7-9], and bounding surface models [10-12]. These models effectively describe the cyclic loading-unloading behavior of sandy soils and the accumulation of shear strain near the liquefaction state. However, most are limited to small deformations before liquefaction and cannot reliably predict large deformations post-liquefaction [13]. Zhang Jianmin et al. [14, 15] proposed a large-deformation liquefaction model for sandy soils (CycLiqCPSP for short), which employs mathematical formulations of reversible and irreversible dilatancy. This model captures both pre-liquefaction stress responses and post-liquefaction shear strain accumulation. It has been validated through numerous tests and applied in platforms such as OpenSees and FLAC3D [16].
Tunnels often need to traverse liquefiable layers of saturated silty or sandy soils, posing risks of additional internal forces or excessive deformation due to soil liquefaction. Ling et al. [17] conducted centrifuge tests on the seismic response of tunnels in liquefiable ground and found that pore pressure near the tunnel-soil interface was lower than in the surrounding soil, attributed to soil flow around the structure. Azadi et al. [18] investigated the effects of loading frequency on pore pressure and stress changes under sinusoidal waves, revealing that lower frequencies increased pore pressure beneath tunnels. Zhu Tong et al. [19] using a large-deformation liquefaction model, developed a detailed assembled segment structure model and found that shield tunnels in liquefiable ground experience significantly higher horizontal compressive forces compared to non-liquefiable ground. Sudevan et al. [20] combining the Finn-Byrne pore pressure increment model and the Mohr-Coulomb model, analyzed tunnel uplift mechanisms, highlighting higher pore pressures at the tunnel base compared to the crown.
Layered liquefiable soils significantly alter the inertial force distribution within underground structures, amplifying internal forces and deformation responses. Chen et al. [21] employed the CycLiqCPSP model to study the dynamic response of tunnels partially crossing liquefiable layers, finding substantial increases in shear force and additional bending moments at layer interfaces. Lu et al. [22] evaluated the seismic behavior of circular tunnels at different depths and observed that overlying non-liquefied soils exacerbated tunnel uplift when tunnels were located within liquefied layers. Crossing liquefiable and non-liquefiable soils resulted in significant increases in internal forces and deformation. Zhao et al. [23] utilizing the Davidenkov model in FLAC3D, analyzed the seismic response of tunnels in liquefiable soils and identified notable changes in stress paths around the tunnels due to dynamic soil-structure interaction.
Previous studies on the seismic response of shield tunnels in liquefiable soils primarily focused on homogeneous soil conditions, with limited attention to the positional relationship between tunnels and liquefied layers [24]. Moreover, existing models are often constrained to small pre-liquefaction deformations and lack the capability to describe large post-liquefaction deformations accurately. They also inadequately address the dynamic behavior of soils before and after liquefaction. To address these gaps, this study examines five configurations of liquefied soil layers relative to shield tunnels. Based on a large-deformation liquefaction model for sandy soils, a two-dimensional saturated soil-tunnel interaction model is established to analyze seismic responses, including pore water pressure, structural uplift, deformation, and internal forces. The study also evaluates damage states under different configurations, providing theoretical insights and practical guidance for the seismic design of shield tunnels in liquefiable interlayered soils under strong seismic conditions.
2 Computational Model
2.1 Geometric Dimensions and Scenario Settings
In this study, a numerical model for soil-shield tunnel interaction was developed using FLAC3D software, as shown in Figure 1. The model dimensions are 160 m in width, 60 m in depth, and 1 m in longitudinal extension. The soil profile consists of non-liquefiable layers from 0 to 2 m and from 25 to 60 m below the ground surface, while a liquefiable sand layer is located between 2 and 25 m. The groundwater table is positioned 2 m below the surface, ensuring the saturation of the liquefied soil layer. The surface boundary is modeled as a drainage boundary, while the lateral boundaries adopt free-field boundary conditions.
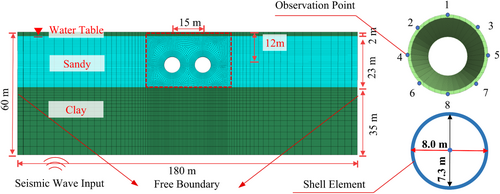
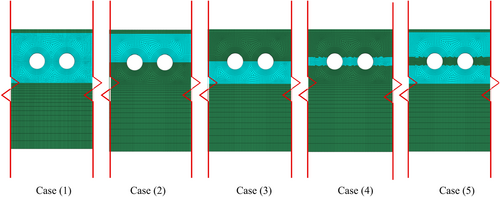
The shield tunnel is designed as a twin-tube parallel structure with a center-to-center spacing of 15 m and a burial depth of 12 m. Each tunnel has an inner diameter of 7.3 m, an outer diameter of 8.0 m, and a segment thickness of 0.35 m. The relationship between the liquefied soil layer and the tunnel structure includes five scenarios (Figure 2): (1) the tunnel is entirely within the liquefied layer; (2) the liquefied soil layer is located only above the tunnel, only in the middle section, or only below the tunnel; and (3) the liquefied soil layer is located both above and below the tunnel.
2.2 Material Parameters
In the computational model, the non-liquefied soil layer, composed of clay, is simulated using the modified Mohr-Coulomb constitutive model. The model parameters are based on the geological investigation report of subway lines in Beijing, as shown in Table 1. The liquefied soil layer consists of saturated sand and is modeled using the CycLiqCPSP large-deformation constitutive model for liquefiable sand. The model parameters are listed in Table 2, and the method for determining the relevant parameters is provided in Section 3. The tunnel structure is modeled as an isotropic elastic material made of C50 concrete, using shell elements for the simulation. A 0.05 m-thick soil-structure interface element is applied around the tunnel, modeled using the Clough-Duncan constitutive model.
| Material | E/MPa | ν | ϲ/kPa | φ/° | θT | m |
|---|---|---|---|---|---|---|
| Clay | 147 | 187 | 0.36 | 28 | 18 | 0.01 |
| Elastic modulus parameters | Plastic modulus parameters | State parameters | Reversible dilatancy parameters | Irreversible dilatancy parameters | Critical state parameters | ||||||||
|---|---|---|---|---|---|---|---|---|---|---|---|---|---|
| G0 | κ | h | np | nd | dir,1 | dir,2 | dir | α | γdr | M | λc | e0 | ξ |
| 200 | 0.006 | 1.8 | 1.0 | 7.1 | 0.6 | 30 | 1.2 | 20 | 0.05 | 1.40 | 0.019 | 0.936 | 0.7 |
2.3 Seismic Wave Input
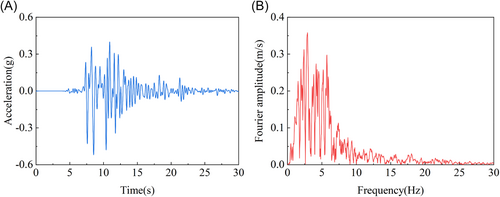
The Kobe wave from the 1995 Hanshin earthquake, characterized by a peak acceleration of 0.4 g, was chosen as a representative seismic input from the PEER ground motion database. Figure 3 illustrates the acceleration time-history and Fourier spectrum of the original seismic wave. High-frequency components exceeding 15 Hz were filtered out, and the adjusted horizontal peak acceleration was utilized as the input motion at the bedrock level, producing a surface peak acceleration of 0.4 g. The computational procedure mimicked the cut-and-cover tunnel construction process. Initially, a gravity step calculation was carried out to establish the initial stress field induced by self-weight. This was followed by the simulation of soil excavation and the installation of tunnel segments. A second gravity step was conducted to stabilize the system, and finally, uniform seismic loading was applied at the bedrock level.
3 CycLiqCPSP Description and Model Validation
3.1 Assumptions of CycLiqCPSP
In this study, the CycLiqCPSP model is employed to simulate the mechanical behavior of liquefiable soils. This model provides a unified description of the mechanical response of sand under both monotonic and cyclic loading, capturing the behavioral transitions before and after liquefaction. The large-deformation constitutive model for sand liquefaction is developed based on observations from cyclic torsional shear tests. It decomposes the volumetric strain (εv) into two components: the volumetric strain induced by changes in effective mean stress (εc) and the volumetric strain induced by shear stress (εd). This decomposition reveals the intrinsic relationship between shear strain and volumetric strain components under cyclic loading conditions.
Based on this framework, Zhang et al. [14, 15] proposed a sand dilatancy equation and introduced a critical state variable, leading to the development of a model that adheres to the stress mapping rules of bounding surfaces and dilatancy surfaces in three-dimensional stress space. Subsequently, Zou et al. [16] implemented a secondary development of this model within FLAC3D and verified its capability in describing the transition from small deformations before liquefaction to large deformations after liquefaction, as well as the effectiveness of the numerical program in handling three-dimensional computational problems.
3.2 Parameter Identification for CycLiqCPSP
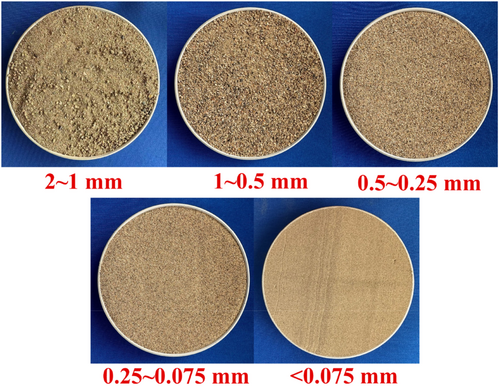
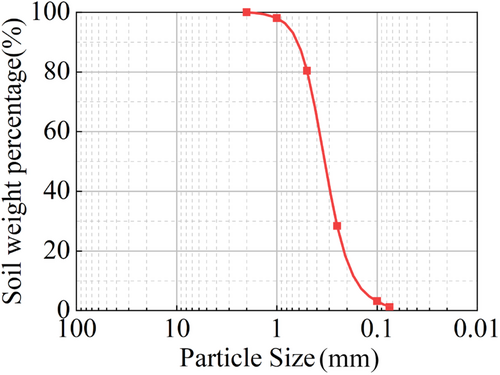
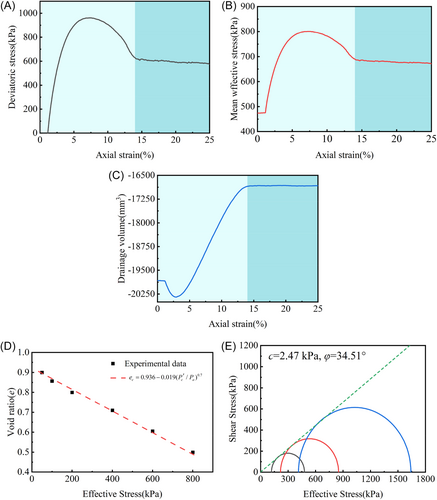
Among the 14 parameters of the CycLiqCPSP model, the elastic modulus parameters (G0 and κ), plastic modulus parameter (h), and critical state parameters (e0, λc and ξ) are widely used in elastoplastic modeling. These parameters can be calibrated using methods established by relevant studies [10, 11]. For instance, the critical state parameters can be determined through triaxial shear tests and hollow torsional shear tests. Before conducting formal experiments, pre-tests are necessary to evaluate the fundamental physical properties of the soil. The sand used in this study was sourced from a construction site in Beijing, and it was sieved and mixed to ensure representativeness and uniformity. The basic physical properties were measured as follows: d50 = 0.34 mm, Dr = 2.67, ρmax = 1.75 g/cm3, ρmin = 1.42 g/cm3. The particle size distribution and grading curves are shown in Figures 4 and 5.
Both the triaxial shear test and the hollow cylinder torsional shear test adopt the dry pluviation method for soil sample preparation. The required soil mass is weighed and evenly divided into five portions. These portions are then sequentially placed into a membrane-lined mold in layers and compacted to the corresponding thickness. To ensure uniformity, the surface of each layer is scarified before the next layer is added. After preparing the dry soil sample, CO₂ is introduced from the bottom of the specimen for 2 h to replace the air within the soil. Next, de-aired water is introduced from the bottom until no air bubbles are observed at the top outlet. Finally, back-pressure saturation is conducted. When the pore pressure coefficient (B-value) exceeds 0.96, the specimen is considered fully saturated.
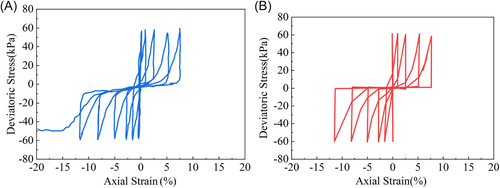
The reversible dilatancy parameter (dir,1) is determined through the relationship between dεvd/dγp in drained cyclic tests. For irreversible dilatancy parameters, the shear strain (γdr) is generally set to 0.05, while dir and α are calibrated using trial simulations of undrained cyclic torsional shear or triaxial tests under various confining pressures or loading amplitudes. Undrained cyclic triaxial tests with bidirectional, equal-amplitude loading were simulated using the model parameters presented in Table 2. A comparison between experimental and simulated results (Figure 7) demonstrates that the model effectively captures the evolution of the effective stress path both before and after initial liquefaction in undrained cyclic triaxial tests. Additionally, it accurately replicates the generation and accumulation of large shear strains under zero effective stress conditions as the number of cycles increases. This analysis confirms the high accuracy of the CycLiqCPSP parameters calibrated for Beijing sand, which can serve as a reliable foundation for further studies on the seismic performance and failure mechanisms of shield tunnels in liquefiable interlayered ground.
3.3 Validation of the Numerical Model
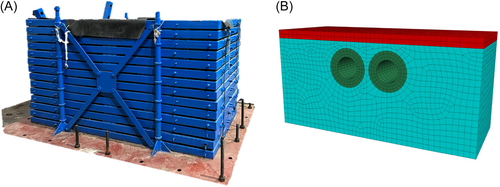
Based on the finite difference software FLAC3D, a numerical model of the same dimensions as the shaking table test was established. The model dimensions were 2.6 m in length, 1 m in width, and 1.1 m in height (Figure 8). Numerical simulations were conducted using vertically incident Kobe waves with peak ground accelerations of 0.1, 0.3, and 0.4 g as the base scenarios. The simulation results were compared with the experimental results to achieve mutual validation. This comparative study verified the feasibility of the experimental scheme and the reliability of the test results. Additionally, the experimental results were used to calibrate the relevant model parameters, thereby improving the rationality of the computational model.
Using the Kobe wave, which has a peak ground acceleration of 0.4 g, as a representative scenario, acceleration data collected from the top of the shaking table soil layer model was compared with numerical simulation results. Figure 9 presents their time-history curves, demonstrating that the numerical simulation aligns closely with the shaking table experiment in both amplitude and waveform. This alignment effectively reproduces the seismic wave's dynamic behavior, confirming the precision and reliability of the numerical model applied in this study. These findings establish a robust basis for future investigations into the seismic behavior and failure mechanisms of shield tunnels situated in liquefiable interlayered grounds.
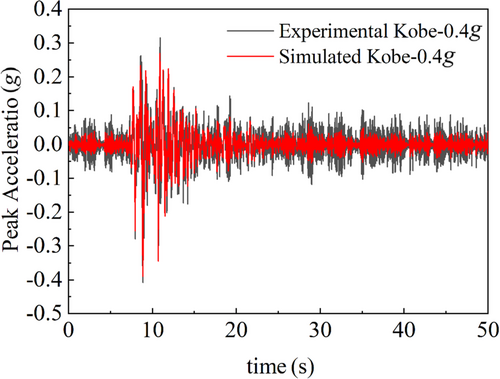
Overall, the shaking table test results were slightly higher than the numerical simulation results. This discrepancy may be attributed to differences in the nonlinear characteristics of the soil under large seismic conditions between the two experimental setups, resulting in variations in their filtering effects on seismic waves. Additionally, simplifications in material dynamic parameters and boundary conditions may have introduced some errors between the measured and simulated values.
4 Simulation Results and Analysis
4.1 Analysis of Soil Liquefaction Behavior
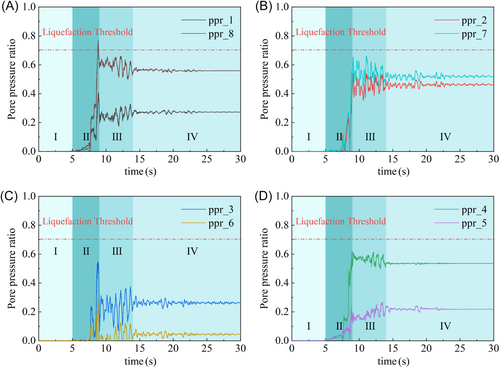
The development process of ru can be categorized into four distinct stages: Stage I: At low seismic intensity, the excess pore pressure ratio remains at zero, with the soil maintaining a linear elastic state and no signs of softening. Stage II: The ratio increases sharply from zero to its peak value within a short duration, accompanied by pronounced oscillations, indicative of significant dilative behavior in the soil surrounding the tunnel. Stage III: Following the peak, the excess pore pressure ratio decreases but remains elevated, while the soil's mechanical properties continue to indicate a failure state. Stage IV: After the seismic motion subsides, the soil surrounding the tunnel gradually regains its load-bearing capacity, stabilizing the excess pore pressure ratio.
To analyze the variations in pore water pressure around the tunnel, Case (1), where the tunnel is entirely located within the liquefied soil layer, is selected as an example. A contour plot of pore water pressure within a specific range around the tunnel is presented and analyzed (Figure 11). Combined with the time-history curves of excess pore pressure ratio for Cases (2) to (5) (Figure 12), the following conclusions can be made: When the base of the structure intersects the liquefied soil layer (Case 3) or when the tunnel simultaneously crosses liquefied soil layers at both its top and bottom (Case 5), pore water pressure accumulates beneath the structure and dissipates slowly. This accumulation leads to a significant reduction in effective stress in the soil below the structure. The excess pore pressure ratio approaches 0.9, indicating a high likelihood of severe liquefaction.
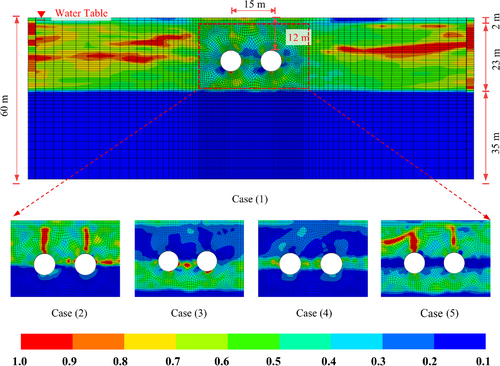
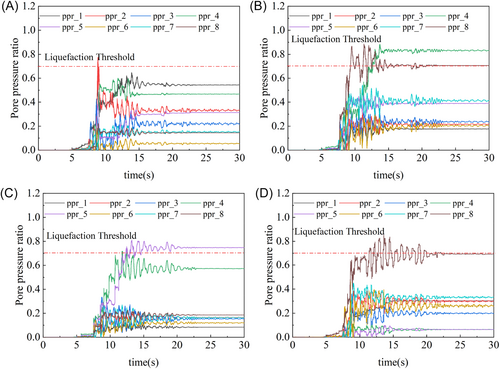
In Case (2), where the structure's top crosses the liquefied soil layer, partial liquefaction occurs in the soil above the structure. In Case (4), where the tunnel's middle crosses the liquefied soil layer, the limited cross-sectional area for drainage between the twin tunnels results in the accumulation of pore water pressure in this region, which dissipates slowly. This condition leads to reduced effective stress and near-liquefaction in the middle section. Based on the distribution of the excess pore pressure ratio in sandy soils, it can be concluded that the critical liquefaction-prone regions in twin tunnels are located beneath the structure, between the tunnels, and above the structure.
4.2 Analysis of Tunnel Structural Deformation
The seismic response of underground structures is predominantly influenced by soil deformation. Calculations reveal two types of coordinated horizontal deformation in the tunnel structure: (1) shear deformation, represented by the interlayer displacement difference between the top and bottom slabs; and (2) compressive deformation, characterized by the horizontal displacement difference between the tunnel haunches (commonly referred to as transverse convergence). By considering horizontal compressive deformation as positive, time-history curves of interlayer displacement differences and transverse convergence are plotted for various tunnel-to-soil layer scenarios (Figures 13 and 14).
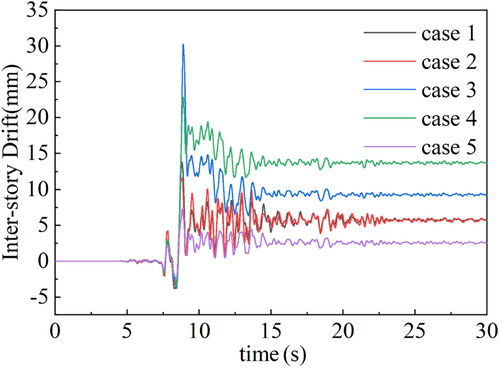
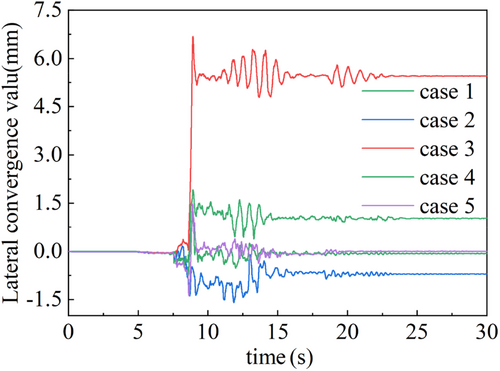
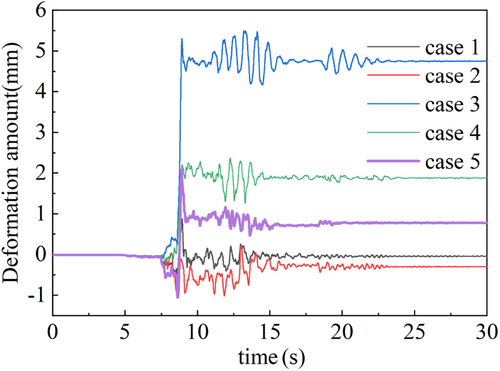
When the tunnel structure is situated within a liquefied soil layer, upward displacement caused by seismic liquefaction may result in significant shear forces along the vertical axis of the structure, potentially leading to severe damage. Taking upward displacement as positive, the time-history curve of vertical displacement differences between the tunnel crown and invert is presented (Figure 15). Peak displacement differences are used as benchmarks to summarize the horizontal and vertical deformation magnitudes of the tunnel structure (Table 3).
| Categories | Case 1/mm | Case 2/mm | Case 3/mm | Case 4/mm | Case 5/mm |
|---|---|---|---|---|---|
| Interlayer displacement difference | 13.8 | 11.5 | 30.3 | 22.9 | 7.3 |
| Horizontal convergence value | 1.2 | −1.6 | 6.7 | 1.9 | 1.5 |
| Vertical deformation magnitude | 0.9 | 1.1 | 5.5 | 2.4 | 2.1 |
Comparative analysis shows that the horizontal deformation of the tunnel generally exceeds its vertical deformation, indicating that shear strain and reduced lateral constraints caused by soil liquefaction make horizontal deformation more likely. Among the different cases, Case 3, where the liquefied soil layer is located beneath the tunnel, exhibits the largest interlayer displacement difference, transverse convergence, and vertical deformation, identifying it as the most unfavorable scenario for seismic resistance, followed by Case 4. Compared to the scenario where the tunnel is entirely embedded within a liquefied stratum (i.e., Case 1), Cases 2 and 5 show reduced inter-story displacement differences but increased lateral convergence and vertical deformation.
4.3 Analysis of Internal Forces
Under seismic excitation, the internal forces of the tunnel structure exhibit significant fluctuations. To investigate the impact of liquefiable interlayers on the internal forces of tunnel structures, four cases were analyzed: the tunnel top, middle, bottom, and both upper and lower sections crossing the liquefiable layers. The maximum absolute values of internal forces at various locations were summarized (Table 4).
| Categories | Crown | Left shoulder | Right shoulder | Left haunch | Right haunch | Left springline | Right springline | Invert | |
|---|---|---|---|---|---|---|---|---|---|
| Bending moment (kN·m) | Case 2 | −135.4 | 169.4 | −188.1 | 118.2 | 98.0 | −191.1 | 170.0 | 93.7 |
| Case 3 | 204.4 | 169.1 | −199.68 | −125.5 | 221.7 | −309.6 | 278.76 | 167.9 | |
| Case 4 | 113.1 | 203.1 | −202.3 | −90.6 | −137.4 | −218.7 | 154.0 | 106.0 | |
| Case 5 | 91.7 | 269.8 | −209.9 | −134.9 | −131.8 | −254.3 | 220.8 | 148.9 | |
| Shear force (kN) | Case 2 | −151.4 | −94.0 | −170.0 | 331.0 | −350.0 | 205.2 | 93.8 | 186.0 |
| Case 3 | 188.9 | 124.9 | −296.3 | 226.7 | −381.9 | 115.9 | −169.7 | 297.5 | |
| Case 4 | −206.5 | 138.6 | 234.4 | 468.7 | −422.5 | 328.0 | 143.7 | 417.3 | |
| Case 5 | −214.3 | 174.9 | 206.1 | 113.8 | 83.3 | −114.5 | −145.9 | 320.8 | |
| Axial force (kN) | Case 2 | −245.6 | −235.1 | −295.1 | −229.7 | −241.8 | −295.2 | −266.9 | −238.3 |
| Case 3 | −189.1 | −238.1 | −248.3 | −263.7 | −255.2 | −282.8 | −263.4 | −248.8 | |
| Case 4 | −207.1 | −241.7 | −272 | −251.4 | −246.4 | −288.1 | −281.4 | −225.9 | |
| Case 5 | −212.3 | −220.0 | −241.5 | −238.7 | −248.7 | −300.1 | −265.3 | −239.1 | |
Regarding bending moments, in Case 2, the maximum positive and negative bending moments occur at the shoulder and springline; in Case 3, both maximum positive and negative bending moments are observed at the springline; in Cases 4 and 5, the maximum bending moments are also concentrated at the shoulder and springline. These findings indicate that, in sites with liquefiable interlayers, the shoulder and springline of the tunnel structure are subjected to significant bending moments. Therefore, in practical engineering applications, special attention should be paid to the bending moments at the shoulder and springline when tunnels traverse liquefiable strata, and appropriate anti-liquefaction measures should be implemented.
Regarding shear forces, in Case 2, the maximum positive and negative shear forces occur at the left haunch and crown; in Case 3, they are observed at the invert and right haunch; in Case 4, both maximum shear forces appear at the left and right haunches; in Case 5, they are located at the invert and crown. Notably, when the tunnel passes through liquefiable soil layers at the midsection, the shear force at the haunch reaches 468.7 kN, highlighting the significant impact of the relative position of the liquefiable layer on the shear behavior of the tunnel structure. Hence, when tunnels intersect liquefiable strata at the midsection, particular attention should be given to the shear effects induced by the liquefiable layer, and targeted anti-liquefaction strategies should be adopted.
Regarding axial forces, under various cases, all sections of the tunnel structure experience compressive forces, with the maximum axial force consistently occurring at the left springline. The variation in axial forces across different locations of the tunnel structure is minimal, indicating that the relative position of the liquefiable layer has a negligible effect on the axial force distribution.
4.4 Tunnel Damage Assessment
The deformation parameters of underground circular structures are primarily defined by the diameter deformation rate and the tunnel inclination angle. Among these, the tunnel inclination angle is relatively simple to calculate, making it a practical metric for assessing seismic responses and evaluating tunnel seismic performance. Additionally, the inclination angle accounts for the impact of varying tunnel diameters on seismic behavior, thereby standardizing the evaluation process and facilitating comparative analyses across different tunnel structures. Consequently, this study employs the inclination angle as a quantitative indicator for evaluating tunnel seismic performance.
The inclination angle is defined as the ratio of the relative displacement between the tunnel crown and the invert to the tunnel diameter under seismic conditions. The method proposed by Shen Yiyao et al. [24] is adopted to quantify the seismic performance of shield tunnels based on this parameter. This approach establishes thresholds for inclination angles and their corresponding damage states (i.e., intact, minor damage, moderate damage, and severe damage), as detailed in Table 5. The time-history curves of inclination angles for various relative positions between the liquefied layer and the tunnel structure are shown in Figure 16.
| Seismic intensity | Damage state | Inclination angle range | Case |
|---|---|---|---|
| E1 | Nearly intact | φ ≤ 1/1400 | |
| Minor damage | 1/1400 < φ ≤ 1/600 | 2, 5 | |
| E2 | Moderate damage | 1/600 < φ ≤ 1/250 | 3, 4 |
| E3 | Severe damage | 1/250 < φ ≤ 1/150 |
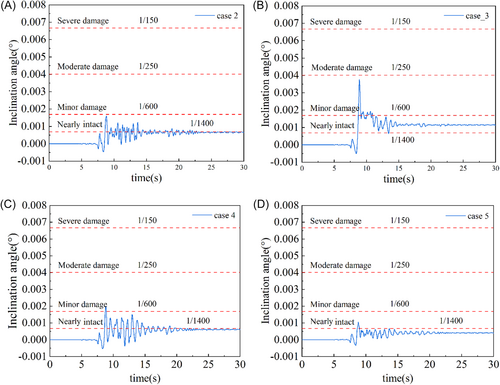
The analysis indicates that when the upper portion of the tunnel passes through the liquefied soil layer (Case 2) or when both the upper and lower sections traverse the liquefied soil layer (Case 5), the inclination angles remain comparable, reflecting a minor damage state. In such scenarios, localized cracking of the concrete may occur; however, the tunnel largely operates within an elastic state, experiencing minimal impact from horizontal seismic shear forces.
In contrast, when the tunnel's bottom section crosses the liquefied soil layer (Case 3) or the middle section passes through the liquefied soil layer (Case 4), the inclination angles become significantly larger, indicating a moderate damage state. This condition may lead to localized spalling of the concrete and partial yielding of reinforcement bars, placing the tunnel within an elastoplastic working state. Notably, Case 3 exhibits the highest inclination angle, making it the most critical case in terms of seismic performance. Furthermore, most cases demonstrate that tunnels retain a considerable residual inclination angle post-seismic loading. This phenomenon is primarily attributed to the accumulation of strong nonlinear soil responses and hysteretic deformations during seismic events, resulting in irreversible residual volumetric deformation of the surrounding soil.
For shield tunnels subjected to the most unfavorable seismic conditions, appropriate liquefaction mitigation measures must be implemented. Considering the construction characteristics of the shield tunneling method, a reasonable approach is to utilize simultaneous grouting reinforcement [22]. Additionally, in cases where the subway line does not pass beneath surface structures or where construction conditions are more favorable, such as in remote suburban areas, an alternative method involves deploying drainage piles along the tunnel alignment to form a composite foundation. This method is advantageous due to its simple equipment requirements and ease of operation. Furthermore, recent advances in liquefaction mitigation research have proposed a novel technique involving direct nitrogen gas injection to reduce saturation, which presents a promising new approach for liquefiable ground treatment.
5 Conclusions
- 1.
A series of triaxial shear and cyclic loading tests were conducted, along with element simulation tests, to calibrate the parameters of the CycLiqCPSP model. A comparison of experimental and simulation results demonstrated that the parameters effectively captured the cumulative shear strain behavior of sand under zero effective stress conditions during cyclic loading.
- 2.
The evolution of excess pore water pressure ratio under seismic loading can be divided into four stages. The central section of the twin tunnels is prone to forming drainage channels during seismic events, increasing liquefaction risks. The structure is subjected to compressive effects induced by excess pore pressure accumulation, resulting in significant variations in deformation and loading characteristics.
- 3.
Layered liquefiable soil significantly affects the seismic response of underground structures. Shield tunnels, fully or partially embedded in liquefiable layers, are more susceptible to uplift and shear effects during seismic events. This is primarily due to the large shear strain within the liquefied layers combined with substantial shear forces from the overlying and underlying non-liquefiable layers on the tunnel top and bottom. Compared to homogeneous soil conditions, traversing layered liquefiable strata poses a greater risk.
- 4.
The impact of liquefiable layer-tunnel spatial relationships on tunnel deformation and damage varies significantly. When the tunnel only crosses the upper liquefiable layer (Case 2) or both upper and lower layers (Case 5), deformation is minimal, and damage levels are low. In contrast, when the tunnel crosses only the lower liquefiable layer (Case 3) or the middle layer (Case 4), deformation and damage are pronounced, with Case 3 being the most adverse for tunnel seismic performance. Appropriate seismic mitigation measures are recommended for such scenarios.
Acknowledgments
This study was supported by the National Natural Science Foundation of China (Grant Nos. 42072308 and 42472340) and the Beijing Natural Science Foundation (Grant No. 8242005). The authors gratefully acknowledge this financial support.
Conflicts of Interest
The authors declare no conflicts of interest.


