Generation of Response Spectrum Compatible Records Satisfying a Minimum Power Spectral Density Function
ABSTRACT
Spectrally matched records are commonly evaluated based on the tightness of the match of the record response spectrum (PSA) with the target design spectrum and the preservation of the seed motions essential features. When used for seismic design and assessment of nuclear facilities, the US Nuclear Regulatory Commission (NRC) also requires verifying that the motions exhibit an adequate power distribution along the frequencies of interest. This requirement is typically validated by comparison of the motion power spectral density (PSD) with a target PSD function. This article proposes an extension of the continuous wavelet transform based spectral matching methodology to develop spectrum compatible records that comply with a minimum power distribution prescribed by a target PSD function. It is shown that the proposed algorithm is capable of generating records that comply with both, the PSA and PSD requirements, while preserving most of the seed records nonstationary features. The article also presents recommendations for the selection of seed motions that increase the likelihood of a successful match.
1 Introduction
Spectral matching is defined as the modification of an actual earthquake record such that its response spectrum (PSA) matches a target (design) response spectrum across a pre-established frequency range of interest. Spectrally matched records are allowed to be used in dynamic time history analyses of civil structures provided that they satisfy specific code requirements. ACE 7-22 for example, requires that the mean maximum-direction spectra for the suite of spectrally matched records equals or exceeds 110% of the design spectrum and prohibits their use for near-fault sites unless the pulse characteristics of the ground motions are retained after the matching process has been completed. In consequence, most of the previous research on spectral matching has focused on developing methodologies that generate records that tightly match the target spectrum while preserving the main characteristics of the seed records [1-4].
In the case of nuclear facilities, the United States Nuclear Regulatory Commission (US NRC) Standard Review Plan (SRP) Revision 4 section 3.7.1 [5] outlines acceptance criteria for seismic design time histories, including both spectrum match and minimum power spectral density (PSD) requirements. The latest are assessed by comparison of the spectrally matched record PSD (or the records suite mean PSD) with a target PSD function compatible with the target response spectrum. While research has focused on the development of the target PSD functions [6-11] less attention has been given to generating spectrally matched records that meet these PSD criteria. Previous studies suggest, for example, using seeds of shorter strong motion duration as these often show higher level of stationarity [10] and/or introducing sufficient additional power to the seed time histories based on the target PSD functions before performing the spectral matching [12]. However, a comprehensive methodology for creating records that satisfy both PSD and spectral match requirements is currently lacking.
While using a target PSD for verification might appear paradoxical, given the PSD's representation of an underlying statistical process rather than a unique signal, it is mandated by NRC SRP 3.7.1 to ensure a minimum PSD. This requirement addresses the concern that solely matching ground motion records to the design response spectrum does not guarantee a stable structural response, specifically the mean In-Structure Response Spectrum (ISRS), due to potential power deficits in certain frequency ranges [13, 14]. Importantly, unlike response spectrum checks, this PSD requirement focuses on meeting a minimum threshold, not achieving a precise match to the target PSD.
The multi-resolution nature of wavelet transforms makes them valuable tools in structural, geotechnical, and earthquake engineering for the analysis of highly nonlinear, nonstationary signals [15-18]. This article proposes an extension of the continuous wavelet transform (CWT) based spectral matching methodology to develop spectrum compatible records that comply with a minimum power distribution dictated by a target PSD function. Moreover, a comprehensive numerical study is performed to develop criteria for the selection of seed motions that would increase the likelihood of a successful match.
1.1 Estimation of PSD
Finally, SRP 3.7.1 minimum PSD checks are performed based on the averaged one-sided PSD, which is computed using a moving frequency window of variable width equal to ±20% the subject frequency (e.g., 4–6 Hz band width for a frequency of 5 Hz).
1.2 Target PSD Functions Compatible With a Design Response Spectrum
SRP 3.7.1 minimum PSD checks involve comparing the spectrally matched record PSD (or the suite mean PSD) with a target PSD function compatible with the target response spectrum. Appendix B of SRP 3.7.1 outlines an iterative procedure for developing target PSDs for any design spectrum, with further implementation details provided elsewhere [10]. This was the approach used to construct the target PSD functions tabulated in SPR 3.7.1 for different magnitude-distance scenarios. A limitation of this approach is that it does not explicitly account for the influence of strong motion duration on the relationship between PSD and the response spectrum.
In this study, an alternative method was employed to generate duration-dependent target PSDs. This method creates the target PSD by averaging the PSDs of hundreds of random signals, each spectrally matched to the target spectrum and generated with a strong motion duration matching the expected scenario. Consequently, the resulting target PSD is smooth, avoiding the zig-zag pattern typical of single realizations. Moreover, it has been shown that the target PSD functions developed using this type of approach are not sensitive to the damping ratio associated with the target response spectrum [10]. Further details on this duration-dependent PSD generation method can be found in [11], and a Python implementation is available in [21].
Figure 1 (right) shows the duration-dependent target PSD functions compatible with the NUREG/CR-6728 bin representative design response spectrum for a moment magnitude M = 7.5 and fault distance R = 75 km event in a rock site in the Western United States WUS (Figure 1 left, WUS Rock M7.5 R75). The expected median strong motion duration for this event, according with the empirical relation developed in NUREG/CR-6728, is 13 s with a bin range 8.7–19 s. The duration-dependent target PSDs were generated for strong motion durations of 5.5, 9, 12.5, 16, and 19 s. It is seen that the effect of duration on the amplitudes of the target PSDs is substantial, with the PSDs corresponding to the lowest durations requiring significantly more energy than the PSDs developed for larger durations. The target PSD function tabulated in SRP 3.7.1 for this design spectrum is also shown and found to be closer to the PSD developed for a strong motion duration of 9 s, which is in agreement with previous findings [11].
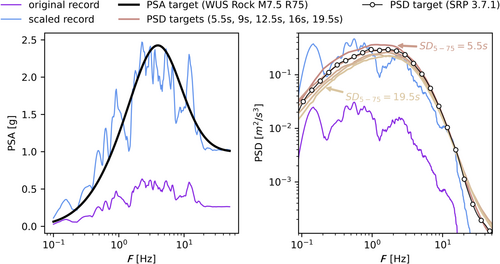
Along with the target PSDs, Figure 1 presents the original and scaled response spectra and PSDs for the north component of the 1999 M7.6 Chi-Chi Taiwan (China) earthquake recorded at TCU122, NGA-West database record sequence number RSN-1546 [22]. This component registered a significant strong motion duration SD5-75 = 15.3 s. The factor used to scale the record was calculated to minimize the mismatch with the design response spectrum. The PSDs were estimated following the SRP 3.7.1 guidelines previously reviewed, including the moving averaging. Note that scaling the record by a factor sf would scale the response spectrum by sf and the PSD by (sf)2.
1.3 CWT-Based Approach for Spectral Matching
The proposed methodology is a natural extension of the CWT-based spectral matching framework [23-26]. While the underlying CWT theory and spectral matching technique have been well-established, a concise overview is provided here to set a context for the proposed enhancements.
The spectral matching algorithm primarily relies on the manipulation of the detail functions (Equation 6) during signal reconstruction (Equation 5). Given that these functions exhibit a very dominant frequency, each detail function is adjusted based on the ratio of the target spectrum to the motion response spectrum at the corresponding frequency. Because the response spectrum at a given frequency is no related exclusively to the excitation amplitude at the same frequency but is rather influenced by a wide range of frequencies, the process must be iterative, continuing until an acceptable level of discrepancy between the motion response spectrum and the target spectrum is achieved. A comprehensive explanation of the algorithm and its computational implementation details are available in [27].
2 Proposed Algorithm
- 1.
Define the required inputs: Specify the target design spectrum, the target PSD function, the acceleration time-history that would be used as seed, and the frequency ranges for matching the design spectrum and for verifying the minimum PSD. These frequency ranges would vary depending on the specific structure and site characteristics. For optimal algorithm performance, the response spectrum range shall enfold the PSD range, which is typically the case.
The sample calculations presented here use a PSA matching frequency range of [0.2–50] Hz and a minimum PSD verification range of [0.3–30] Hz. As for any spectral matching procedure, less invasive modifications to the seed record are expected if the record is initially selected based on its response spectral shape resemblance with the design target spectrum. The record used to exemplify the calculation steps of the proposed algorithm is from the 1999 M7.6 Chi-Chi Taiwan (China) earthquake, the target PSA comes from SRP 3.7.1 for WUS Rock M7.5 R75km and the target PSD was obtained using the procedure described in [11] for a strong motion duration of 12.5 s. All three were described in the previous section and presented in Figure 1.
- 2.
Spectral match the seed record: The seed record is spectrally matched to the target pseudo-spectral acceleration (PSA) using the algorithm from [27]. This process entails: (1) initial scaling to minimize PSA mismatch; (2) wavelet coefficient calculation using Equation (4); (3) detail function construction via Equation (6); (4) frequency-specific scaling of detail functions based on the ratio of target PSA to record response spectrum (Equation 8); (5) signal reconstruction using Equation (5) with scaled detail functions; and (6) iterative refinement (steps 4–6) until satisfactory PSA matching is achieved. To accommodate the minimum PSD requirement in this application, 300 detail functions were employed, rather than the recommended 100. The central frequencies for these 300 functions were logarithmically distributed between the minimum of 0.1 Hz and 4 divided by the total record duration, and the record's Nyquist frequency.
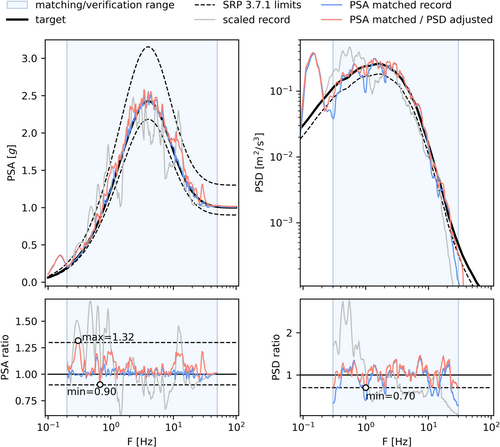
Figure 3 shows the response spectrum and PSD for the spectrally matched record (blue line). It is seen that the target PSA is tightly matched, with the response spectrum being within the [90%–130%] range of the target spectrum as required in SPR 3.7.1. Regarding the record minimum PSD, it is important to notice that this check is performed based on 70% the target PSD (Nie et al., 2015), which in this case in not satisfied as it falls below 70% the target at several frequencies within the verification frequency range.
- 3.
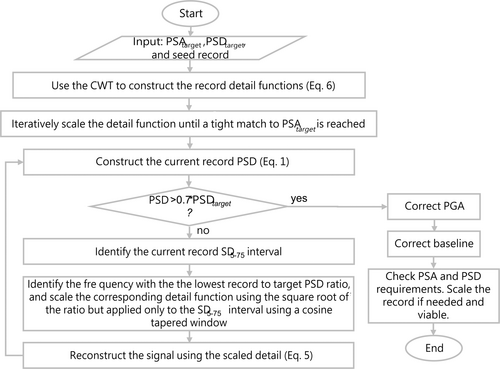
Perform further adjustments to satisfy minimum PSD requirement: In this step the detail functions used to construct the spectrally matched record are further modified to ensure compliance with the minimum PSD requirement. Notice that different to the PSA check, the PSD requirement is not based on a tight match of the target PSD function but rather on satisfying a minimum level of energy along the pre-established frequency range of interest. Therefore, not all the detail functions are modified but only the ones that correspond to a frequency where the record PSD falls below the minimum. To maintain the alterations to the spectrally matched record to a minimum, the detail functions are modified one at a time, starting with the one showing the lowest record to target PSD ratio. Recall that in SRP 3.7.1 the minimum energy level is set as 70% of the target PSD function, therefore the ratios are computed based on 70% the target PSD function. The square root of the ratio is used to scale the corresponding detail. Moreover, since only the portion of the record within the SD5-75 limits is used to compute the PSD, the scaling of the detail functions is limited to this time interval using a cosine-tapered window. The signal is then reconstructed (Equation 5), the PSD is recomputed, and a new critical detail function is identified and scaled. This iterative process continues until the minimum PSD is satisfied across the desired frequency range.
As shown in Figure 3, the PSD adjusted record (salmon lines) meets the minimum PSD requirements without significantly compromising the match with the target PSA or increasing PSD amplitudes at frequencies already in compliance. Figure 4 presents the time histories of acceleration, velocity, displacement, cumulative absolute velocity (CAV), and normalized AI. Comparing these with the amplitude-scaled version of the records reveals that both the spectrally matched and the spectrally matched with PSD adjustments records successfully preserve the general characteristics of the initial time series. Nevertheless, the modifications performed introduced some drift in the records displacements, necessitating baseline correction.
- 4.
Peak ground acceleration (PGA) correction: PGA, also termed zero-period acceleration (ZPA), is defined as the absolute maximum amplitude of the acceleration time history. In a typical pseudo-acceleration response spectrum, the GPA corresponds to the spectral amplitude at high frequencies once the spectrum levels off. To ensure consistency with the target design spectrum PGA, a correction is applied. The algorithm used is described in [29] and involves iteratively isolating the whole cycle of the peak responsible for the current PGA and scaling it with a bilinear function to match the target PGA. Reducing the extent of PGA correction can be achieved by incorporating an extra selection criterion, like the one suggested in Mukhopadhyay et al. [30], when selecting seed records.
- 5.
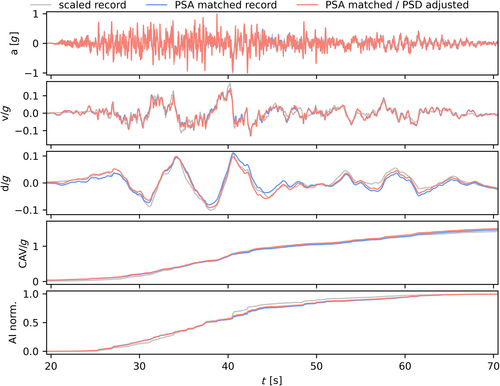
Baseline correction: Although spectrally matched records can exhibit displacement drift, PSD-adjusted records are particularly prone to this issue, as illustrated in Figure 4. This difference arises because spectrally matched records undergo uniform scaling of their component functions across the entire signal duration. In contrast, PSD adjustment involves nonuniform modifications to the detail functions, concentrated primarily within the strong motion portion (SD5-75) of the record. These localized modifications disrupt the original frequency-dependent amplitude characteristics of the seed record, potentially resulting in significant displacement drifts. To mitigate this, a baseline correction is implemented. This correction involves removing a low-order polynomial trend from the acceleration time series and employing a minimally invasive scheme that specifically targets the beginning and end of the signal, thereby preserving the strong motion portion. This scheme was originally proposed in [31] and a detailed outline of the algorithm is provided in [32].
- 6.
Final check and amplitude scaling: A final verification is required given that: (1) the record modifications performed in steps 2 and 3 were based on the frequencies used for the wavelet decomposition; and (2) the PGA and baseline corrections performed in steps 4 and 5 could have slightly affected the record response spectrum and PSD. In this final verification, the PSD check is conducted using Fourier frequencies, while the PSA check is performed at frequencies defined in SRP 3.7.1. Specifically, the PSA check uses 100 frequency points per decade on a logarithmic frequency scale, spanning from 0.1 Hz to either 50 Hz or the Nyquist frequency. This means that for each tenfold increase in frequency (e.g., from 0.1 to 1 Hz, or from 1 to 10 Hz), 100 points are evenly distributed along the logarithmic frequency axis. The response spectrum must fall within 90%–130% of the target design spectrum, and the PSD must exceed 70% of the target PSD function within the range of interest. If either requirement is not met, the record is amplitude-scaled as a last resort to achieve compliance.
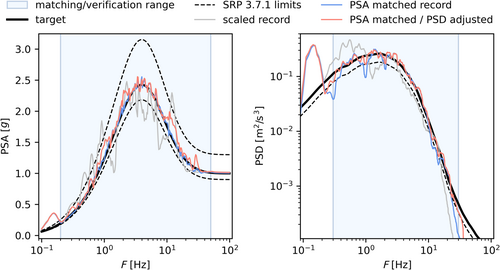
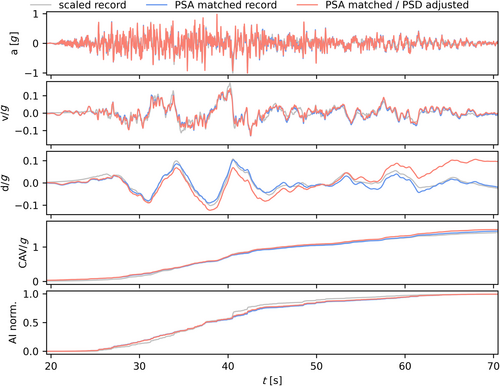
Figures 4 and 5 present the final results for the PSD-adjusted record, incorporating PGA correction, baseline correction, and final amplitude scaling. For comparison, the spectrally matched and amplitude-scaled records are also included. As shown in Figure 5, baseline correction effectively addressed the drift observed in Figure 4 for the displacements of the PSD-adjusted record, which now align closely with the PSA-matched and amplitude-scaled records displacements. Figure 6 demonstrates that these final corrections had minimal impact on the record's response and power spectra. This figure also displays the record-to-target ratios for these spectra, along with the SPR 3.7.1 limits. While the PSD-adjusted record meets the minimum PSA ratio of 0.9 and PSD ratio of 0.7, it slightly exceeds the maximum PSA ratio of 1.3 at a frequency around 0.3 Hz with a ratio of 1.32. If the seismic analysis were to be performed using a single record, this record would not be compliant and could not be used. However, while SRP 3.7.1 allows for single-record use in linear structural analyses, this practice is strongly discouraged and a suite of multiple records is preferred in current practice [33, 34]. When multiple records are used, the PSA and PSD requirements are assessed based on the average suite spectra. As a result, minor, localized exceedances like the observed in the example presented are likely to vanish once the spectra are averaged.
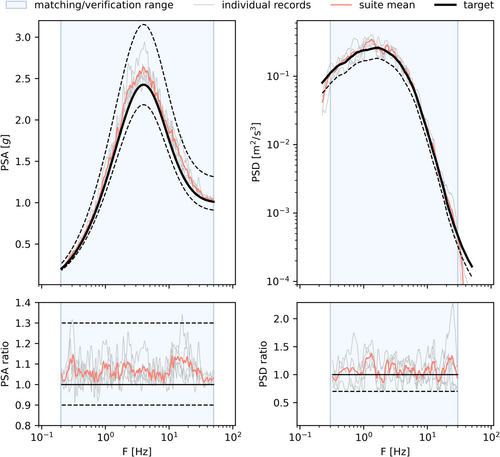
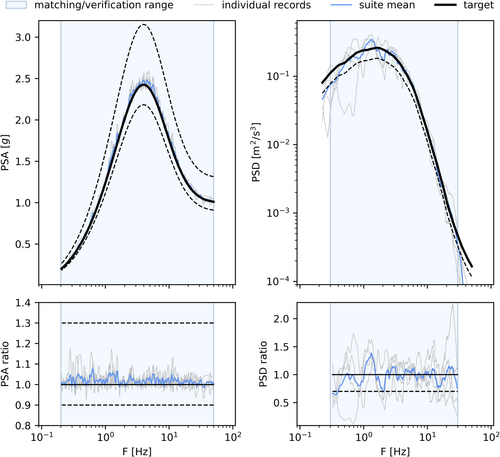
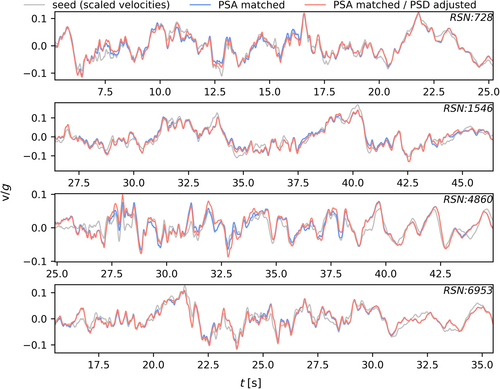
For instance, Figure 7 illustrates the outcomes for a set of four records using the same PSA and PSD target spectra. The seed records employed are detailed in Table 1. Note that four records constitute the minimum number recommended in SRP 3.7.1 for linear analyses. As observed in Figure 7, while certain individual records may occasionally exceed the 1.3PSA limit, the suite's average PSA and PSD values fully adhere to the SRP 3.7.1 criteria. For comparative purposes, Figure 8 presents the results garnered when the seeds are spectrally matched, but the PSD adjustment is disregarded. It is seen that in this scenario, the suite's average PSD falls short of the 0.7PSD limit at frequencies around 0.4 and 2 Hz, indicating noncompliance. Figure 9 compares the velocity traces of the four PSD-adjusted records to their corresponding PSA-matched and seed records. In this figure the seed record velocities were scaled to allow direct comparison. The results indicate that the nonstationary characteristics of the seeds are largely preserved. As Table 1 shows, PSA matching generally extends the seed's strong motion duration, while PSD adjustment tends to shorten the duration of the spectrally matched records, bringing it closer to the seed record duration.
| SD5-75 [s] | ||||||
|---|---|---|---|---|---|---|
| RSN | Earthquake | M | R (km) | Original | PSA matched | PSD adjusted |
| 728 | 1987 Superstition Hills | 6.54 | 13.03 | 11.9 | 12.6 | 12.1 |
| 1546 | 1999 Chi-Chi Taiwan (China) | 7.62 | 9.34 | 15.3 | 17.7 | 17.1 |
| 4860 | 2007 Chuetsu-Oki Japan | 6.80 | 23.18 | 10.9 | 12.5 | 12.0 |
| 6953 | 2010 Darfield New Zealand | 7.00 | 24.55 | 11.2 | 14.1 | 13.7 |
- Note: All records were obtained from the NGA-West database [22], RSN is the record sequence number within this database.
2.1 Selection of Seed Records and Target PSD Function
In traditional spectral matching, seed records are primarily selected based on their response spectrum shape's similarity to the target spectrum. Since the comparison is based on shape, the seed record is first scaled to minimize the mismatch with the target. The underlying assumption is that records closely resembling the target will require less invasive modifications to achieve an acceptable match, thus increasing the likelihood of preserving the seed record's original characteristics.
When a minimum PSD constraint is added to the matching process, then, in addition to the target response spectrum mismatch, a comparison between the scaled seed record's PSD and the target PSD is desirable during the seeds' selection process. However, while earthquake databases typically include response spectra, PSD data is less common. Since it has been shown that the relationship between response spectrum and PSD is largely controlled by the duration of strong motion, an alternative approach is to use the strong motion duration as a proxy for the PSD, noticing that this approach is potentially viable as long as the target PSD is compatible with both the target spectrum and the expected strong motion duration.
Figure 10 displays the response spectra for the scaled and spectrally matched records along with their mean values, the target spectrum and SRP 3.7.1 limits. While both means closely align with the target, the dispersion among the scaled records is significantly greater than that observed in the spectrally matched records. Nevertheless, Figure 11 shows that, despite having very similar response spectra, the spectrally matched records show considerable variability in their PSD.
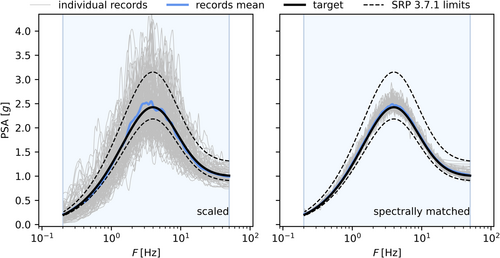
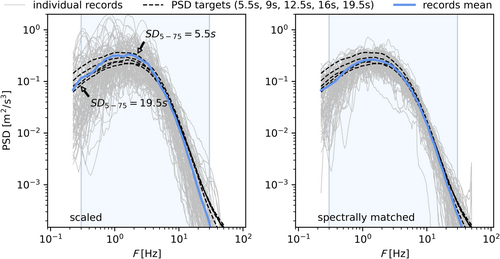
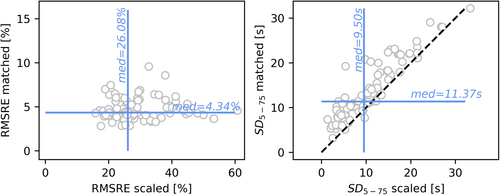
Figure 12 illustrates the impact of spectral matching on spectral mismatch and strong motion duration. As expected from Figure 10, the spectral mismatch is significantly reduced, with all spectrally matched records achieving an RMSRE below 10% and a median RMSRE of 4.34%. This represents an approximately 83% reduction compared to the 26.08% median RMSRE for the scaled records (Figure 12—left). Additionally, as shown in Figure 12 (right), most durations lie above the equal duration line, indicating that the strong motion duration increased for the majority of records during the spectral matching process. The median duration for the spectrally matched records was 11.37 s, roughly 20% longer than the median duration of 9.5 s for the scaled records.
To ensure compliance with minimum PSD requirements, all 92 spectrally matched records were modified using the proposed procedure. Five different target PSD functions were used, corresponding to expected strong motion durations of 5.5, 9, 12.5, 16, and 19.5 s (Figure 11), resulting in 460 PSD adjusted records. The frequency range for the PSD check was maintained at [0.3–30 Hz]. When the 92 spectrally matched records are evaluated individually for PSD compliance, without any further modifications, the results are unsatisfactory: none meet the requirement for the 5.5 s strong motion duration scenario, and only three meet the requirement for the 19.5 s scenario.
Figure 13 illustrates the impact of the PSD adjustments on spectral mismatch (assessed through the RMSRE) and strong motion duration (measured by the SD5-75 ratio of each modified record to its original seed). The results are presented as violin plots, showcasing the distribution of each parameter across the 92 records in each group. It is seen that the adjustments performed to the spectrally matched records to comply with the minimum PSD increase the mismatch with the target PSA (Figure 13 left). While the spread is similar for all PSD adjusted groups, the largest mismatches occur when the target PSD function is constructed for the lowest SD5-75 (5.5 s) and decreases as SD5-75 increases. This pattern is understandable, as shorter durations yield target PSDs with higher amplitudes (refer to Figure 1), necessitating greater modifications to the spectrally matched records.
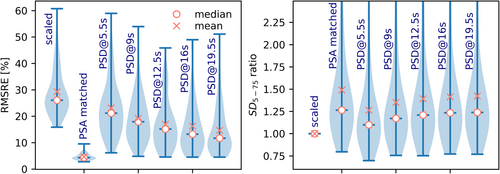
Regarding strong motion duration, Figure 13 (right) indicates that while the initial spectral matching increases the SD5-75, the subsequent adjustments to meet the minimum PSD requirements lead to a reduction. Notably, the shorter the duration used to generate the target PSD function, the greater the decrease in the SD5-75 of the records. Overall, the SD5-75 for the PSD-adjusted records falls between that of the seed records and the spectrally matched records.
Each match was deemed successful if the final record adhered to the SRP 3.7.1 limits for PSA and PSD. Figure 14 illustrates the successful and unsuccessful matches as a function of the seed record SD5-75 and RMSRE. As expected from the findings in Figure 13, the most challenging scenario was the target PSD function created for the lowest SD5-75 of 5.5 s, resulting in only 6.5% successful matches. As the SD5-75 used to generate the target PSDs increases, the minimum PSD amplitudes decrease, leading to a rise in the percentage of successful matches - reaching 33.7% for the target PSD generated with an SD5-75 of 19.5 s. Because the proposed algorithm first enforces the lower limits (0.9PSA and 0.7PSD) all of the noncompliance cases were triggered by exceedances in the response spectra upper limit (1.3PSA). Note also that the SRP 3.7.1 criteria were applied on an individual record basis. As mentioned earlier, when using a suite of records, the acceptance criteria are applied to the mean PSA and mean PSD of the suite, meaning that minor exceedances in single records may be mitigated when the spectra are averaged. Thus, if a suite of records is used, the limits for individual records can be relaxed. Figure 15 shows that if the limits for PSA are adjusted from [90–130]% to [90–140]%, the success rate increases by approximately 70%.
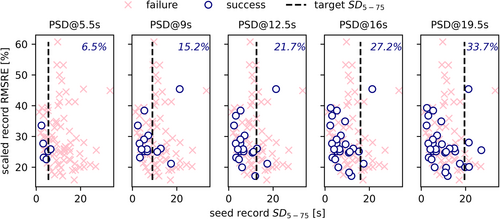
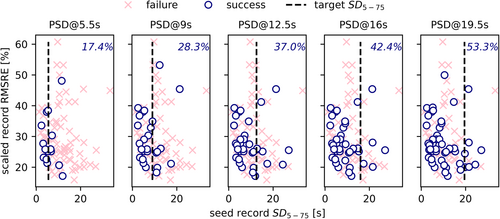
Figures 14 and 15 demonstrate that seed record selection can be significantly improved by considering strong motion duration alongside response spectrum shape similarity. Specifically, records with a strong motion duration exceeding the target PSD's generation duration are unlikely to achieve a successful match. Therefore, to maximize matching success, it is recommended that selected seed records have an SD5-75 duration less than 110% of the target. Additionally, the RMSRE of the scaled seed record should not exceed 40%.
3 Conclusions
The CWT-based algorithm for spectral matching was extended to ensure that the resulting records also meet a minimum spectral density defined by a target PSD function. As evidenced by the velocity time history comparisons in Figure 9, the proposed algorithm successfully preserves much of the seed records' non-stationary time-domain behavior.
When evaluating spectrally matched records for compliance with a minimum PSD, incorporating strong motion duration alongside spectral mismatch during seed record selection improves the probability of successful matching. It is recommended to select seed records with a root mean square error (RMSE) below 40% and an SD5-75 duration less than 110% of the target PSD's generation duration. Furthermore, the results highlight the importance of developing a target PSD function that is consistent with both the target response spectrum and the expected strong motion duration.
Acknowledgments
This study was performed under award number 31310024M0015 from the US Nuclear Regulatory Commission. The statements, findings, conclusions, and recommendations are those of the author and do not necessarily reflect the view of the US Nuclear Regulatory Commission.
Conflicts of Interest
The authors declare no conflicts of interest.
Open Research
Data Availability Statement
A python implementation of the proposed algorithm is available from the author's GitHub repository.


