Time-dependent seismic resilience of aging repairable structures considering multiple damage states
Abstract
Earthquakes are among the natural hazards threatening the serviceafbility, functionality, and safety of engineering structures significantly. Posthazard structures may suffer from different damage states and correspondingly different functionality losses/recovery processes in the aftermath of hazardous events. This paper proposes a measure for structural time-dependent seismic resilience considering multiple damage states. Its specific case (i.e., considering damage–no damage scenario) reduces to the existing resilience measure in the literature. The time-variant fragility curves and the generalized seismic capacities are used to determine the damage states conditional on the peak ground motion (PGA). The proposed measure is applicable for both of the following two cases: (1) the earthquake occurrence rate and the magnitude of PGA conditional on earthquake occurrence are known; (2) the probability distribution of annual maximum PGA is known. In terms of the latter, the annual seismic hazard function can be used to describe the seismic load uncertainty. A numerical example is presented to demonstrate the applicability of the proposed resilience measure. It is shown that the proposed measure can be used to quantitatively guide structural design to meet the target resilience level.
1 INTRODUCTION
Earthquakes are responsible for a significant portion of natural hazard-induced damages to civil structures and infrastructures around the world. According to a report by the Federal Emergency Management Agency (FEMA)1 in 2017, earthquakes cost the United States approximately $6.1 billion annually in the national building stock. In China, the annual direct economic loss due to earthquakes is about 24.6 billion CNY2 for the period of 2009–2019. Apart from the seismic hazards, in-service structures also suffer from performance (e.g., stiffness, strength) deterioration due to environmental attacks such as spalling of reinforced concrete members, and corrosion of steel reinforcement.3-7 For example, the 2021 Report Card for America's Infrastructure, released by the American Society of Civil Engineers (https://infrastructurereportcard.org/), showed that 42% of all the bridges in the United States are at least 50 years old, and about 7.5% of them are structurally deficient (i.e., in “poor” condition). While the deterioration of structural performance does not necessarily mean an immediate failure, the structure becomes increasingly more susceptible to hazardous events with time. In practice, due to the constraints of available resources, it is not practically and economically implementable to maintain the performances of all in-service structures as good as new. Instead, reliability and resilience assessment is a powerful tool to quantitatively measure the structural ability to fulfill service requirements, based on which planners and decision-makers can optimize the maintenance strategies and allocate limited resources wisely. Structural reliability is defined as the probability of survival (withstanding external load effects),8-10 while resilience is indicative of structural ability in terms of preparing for and adapting to hazardous events and recovering rapidly from the disruptions.11-15
This paper presents a measure for time-dependent seismic resilience of aging structures that incorporates different postearthquake damage states. The focus is on the resilience of repairable structures, that is, the structural functionality, if being reduced due to earthquake load, can be restored via some repair measures to the prehazard state or some other state to account for adaptability. It is shown that the proposed measure is a generalized form of Equation (2). A numerical example is presented to demonstrate the applicability of the proposed resilience measure.
2 STRUCTURAL SEISMIC PERFORMANCE
2.1 Seismic fragility curve
Observing Equation (6), it is found that follows a lognormal distribution with a median value of and dispersion of . In Equation (3), the intensity measure of PGA has been widely used in seismic fragility analysis due to its simplicity,34-37 although some other measures could behave better in some specific cases.38, 39 In this paper, the fragility curves with respect to PGA will be considered only, in an attempt that the developed resilience measure can be conveniently adopted by the engineering practice.
If taking into account the impact of structural deterioration, the seismic fragility curve would be time-variant.28, 29, 40, 41 For example, in the presence of corrosion-induced degradation, the corrosion propagation is often represented by the metal loss of reinforced bars.42, 43 With the reduction of the cross-sectional area of reinforced bars, as well as the deteriorated concrete-reinforcement bond, the structural performance (e.g., bending moment) deterioration can be further calculated, which plays an important role in the estimation of time-variant seismic fragility curves. Other deterioration mechanisms, such as sulfate attack and diffusion-controlled aging,8, 44 may also be dominant, depending on the service environment of the structure. In this context, Equation (7) would be rewritten as to reflect its time-variant characteristics, where denotes time. The notation of , representing the evolution of the fragility curve on the temporal scale, will be used in the derivation of the resilience measure in Section 3.
2.2 Resilience associated with a single earthquake event
In Equation (9), is the exponential integral function, defined as . For more general cases (with other distribution types of , recovery strategies, etc.), an explicit form of is not necessarily available; in such a case, one may use a fitting-based approach to approximate the expression for . The resilience associated with a single earthquake event will be incorporated in the estimation of structural time-dependent resilience, as shown in Section 3.
3 PROPOSED RESILIENCE MEASURE CONSIDERING MULTIPLE DAMAGE STATES
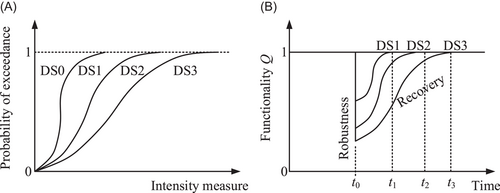
For a posthazard structure, its functionality loss and the subsequent recovery process would be dependent on the specific damage state. In a probabilistic manner, the damage states can be determined through the use of fragility curves. Figure 1A shows an example of three fragility curves and the associated four damage states (DS0 through to DS3, where DS0 refers to “no damage”). The damage state-dependent recovery processes are illustrated in Figure 1B.
Equation (17) is the proposed measure for structural time-dependent seismic resilience, which takes into account the multiple damage states and the associated resilience measures . Based on Equation (17), the seismic nonresilience, denoted by , is simply equal to .
4 DISCUSSION ON THE PROPOSED TIME-DEPENDENT RESILIENCE MEASURE
4.1 Properties of the proposed measure
4.2 Resilience-oriented performance-based structural design
5 EXAMPLE
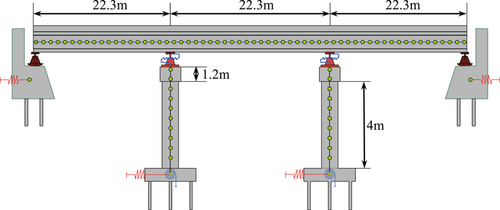
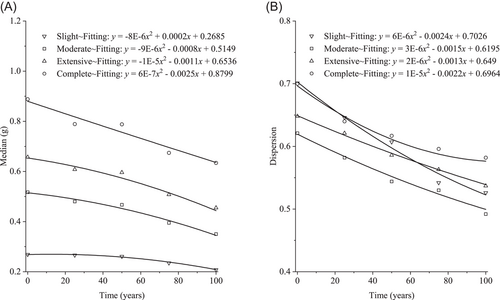
The overall time-variant fragility curve of the bridge is obtained by considering the bridge as a series system consisting of different components. Based on Equation (7), the time-variant median values (in terms of the acceleration of gravity, ) and dispersions are presented in Figure 3, in the presence of totally five damage states (): none, slight, moderate, extensive, and complete. In the aftermath of an earthquake event, the damage state-dependent restriction strategies and recovery rates are shown in Table 1. It is further assumed that the postearthquake functionality loss increases with time as follows: over a reference period of 100 years, (a) slight damage, from 25% (as in Table 1) to 50%; (b) moderate damage, from 50% to 75%; (c) extensive damage, from 75% to 90%. The recovery rate for the damage state of “collapse” is not applicable in Table 1, indicating that the bridge is not repairable after collapse (with which ). For the other damage states (slight, moderate, and extensive), the idle time of the posthazard bridge (i.e., the time between the occurrence of earthquake and the start of the recovery process) is not considered.
| Damage state | Restriction strategy47 | Functionality loss47 (percentage of normal serviceability) | Recovery rate (days)48 | |
|---|---|---|---|---|
| Lower bound | Upper bound | |||
| No damage | Immediate access | 0 | n.a. | n.a. |
| Slight damage | Weight restriction | 25 | 0.1 | 1 |
| Moderate damage | One lane open only | 50 | 1 | 5 |
| Extensive damage | Emergency access only | 75 | 30 | 120 |
| Collapse | Closed | 100 | n.a. | n.a. |
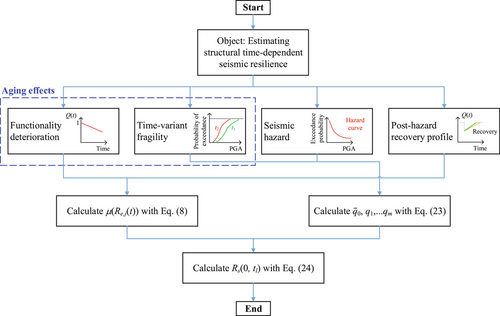
Two representative locations from the CSUS will be chosen for the bridge, namely St. Louis, Missouri, and Memphis, Tennessee. The seismic hazard curves associated with the two locations are available at the United States Geological Survey (USGS; https://earthquake.usgs.gov/hazards/interactive/). The former has a characteristic value of about 0.1g corresponding to a return period of 475 years, while the latter has a characteristic value of 0.2g. Using the edition of Conterminous U.S. 2014 (V4.0.x), the hazard curves (annual exceedance probability) can be approximated by the Extreme Type II distribution.33 For St. Louis, the shape and scale parameters (see Equation 19) are and , respectively; for Memphis, and . With the above configuration, the bridge's time-dependent seismic resilience will be evaluated using Equation (24) (see Figure 4 for a flowchart of the calculation steps).
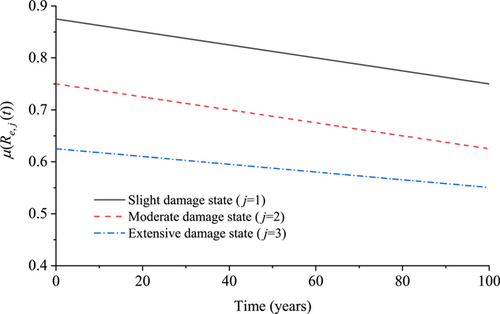
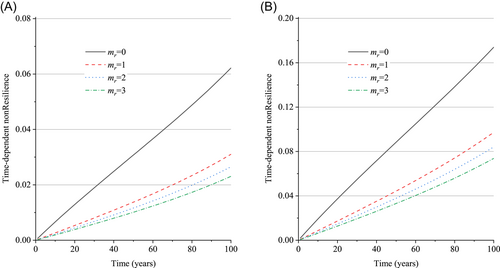
First, the time-variant resilience measures associated with a single earthquake event, , are computed by Equation (8) and are presented in Figure 5 for slight, moderate, and extensive damage states. It is seen that for each , the resilience measure decreases with time, due to the increasing posthazard functionality loss. The resilience measure associated with the slight damage state is the greatest, followed by those associated with the moderate and extensive damage states, respectively. With the results in Figure 5, the bridge's time-dependent nonresiliences for reference periods up to 100 years are calculated according to Equation (24) and are shown in Figure 6 (see the legend “”). The structural nonresilience increases with time due to the accumulation of damage potential of the bridge with time. For the two locations, the nonresilience associated with St. Louis is smaller than that of Memphis, because the seismic risk at Memphis is greater, as reflected by the statistics of the annual seismic hazard curves. In Figure 6, the nonresiliences associated with other values of are also presented. The case of corresponds to the structural failure probability as estimated by Equation (1), which serves as an upper bound for structural nonresilience. A greater value of results in a smaller nonresilience, due to the consideration of more repairable damage scenarios of the postearthquake bridge. For instance, at St. Louis, the nonresilience for 100 years is 0.062 with , which is approximately 2.7 times that associated with . Furthermore, the results in Figure 6 can also be used to predict the bridge's service life, given the target resilience level. For example, if the nonresilience threshold is 0.01 for St. Louis, the structural service life is predicted to be 49.5 years. With the same target level, the service life becomes 15.7 years if the bridge is located in Memphis. If the target nonresilience measure is raised to be 0.03 for Memphis, the service life increases to 45.6 years.
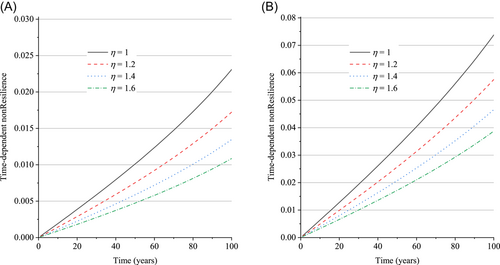
During the design phase of the bridge, one may adjust the structural design so that the resilience measure can meet a predefined threshold. Illustratively, an adjustment factor is introduced, with which the median values of the time-variant fragility curves become times the original ones in Figure 3A. The variation of reflects the adjustment process of the design scheme. Given the target resilience goal, the desired structural design would be achieved through a trial-and-error approach. Based on the results in Figure 6, the dependence of structural nonresilience on the value of is shown in Figure 7. Clearly, a greater value of results in a smaller nonresilience due to the enhanced seismic performance of the bridge. For example, at St. Louis, if the median values increase by 40%, the nonresilience for a reference period of 100 years decreases from 0.023 to 0.013. Furthermore, if the nonresilience threshold is 0.01 for a service life of 75 years at St. Louis, the median values are required to increase by at least 35% (i.e., ). Similarly, if the target nonresilience is 0.03 over 75 years for Memphis, one would need to enhance the median values of the fragility curves by 50%, corresponding to , at the minimum. Although it is out of the scope of this paper to discuss how to determine the target resilience level, the results herein demonstrate that the resilience-based design is promising to become a useful tool for use in structural design, in conjunction with the traditional reliability-based design.
6 CONCLUSIONS
- 1.
The proposed time-dependent resilience measure is a generalized form of that in the literature, incorporating the multiple posthazard damage states as well as the associated resilience measures conditional on earthquake occurrence. It also reduces structural time-dependent reliability if the structure is nonrepairable once suffering from any damage/failure.
- 2.
The structural nonresilience would be overestimated if not considering all the postearthquake damage scenarios with which the structure is repairable. For example, for the illustrative bridge located in St. Louis, the seismic nonresilience for a reference period of 100 years is overestimated by about 170% if assuming that the structure is nonrepairable in the presence of any damage state.
- 3.
The proposed resilience measure can be used to probabilistically predict structural service life and to quantitatively guide the design of structures given a resilience threshold, where a trial-and-error process can be used to ensure that the resilience requirement is met.
ACKNOWLEDGMENT
The authors would like to acknowledge the thoughtful suggestions of three anonymous reviewers, which substantially improved the present paper. Open access publishing facilitated by University of Wollongong, as part of the Wiley - University of Wollongong agreement via the Council of Australian University Librarians.
CONFLICTS OF INTEREST
The authors declare no conflicts of interest.


