Seismic performance analysis of steel frame structures with separated three-dimensional isolation
Abstract
Three-dimensional (3D) base isolation can significantly improve the seismic performance of structures. However, significant 3D movement coupling and rocking behavior of the superstructure due to the high gravity center of the structure can be observed, which will lead to a complex design of the isolation system and the isolators. In addition, as the 3D isolators are installed beneath the structures, they need to support the heavy weight of the superstructure with low vertical stiffness. It is difficult to meet both the vertical load and stiffness design demands of the isolators using traditional isolation materials and mechanisms, especially for large-size structures. A separated 3D isolation scheme is proposed by installing the horizontal isolation at the base of the superstructure and the vertical isolation under the floor slabs. Simulations are carried out to examine the dynamic responses including the acceleration, inter-storey drift, and stress of structural members of a typical steel frame structure with the separated 3D isolation scheme. The isolation effect was also studied by shaking table tests of a two-storey steel frame structure. The simulation and test results show that the proposed separated 3D isolation scheme has high performance in mitigating the structural accelerations in both horizontal and vertical directions, and the vertical load on isolators. The rocking behavior of the structure is effectively restrained for the separated 3D isolation scheme due to a low mass center configuration of the vertically isolated slabs. Although the isolation of the floor slabs from the beams in the structure with separated 3D isolation weakens the constraint of the floor slabs to the beam and column members as in a traditional frame structure, the horizontal isolation at the base of the superstructure reduces the adverse effect and the stress of structural members is similar to that in a horizontal base-isolated structure and significantly lower than that in a base-fixed structure. In addition, as the vertical isolation is installed under the slabs, the vertical load on the vertical isolators is small and it is easy to design the isolators.
1 INTRODUCTION
Base isolation has been widely studied and used in engineering practice. Its isolation effect has been demonstrated through theoretical, numerical, and experimental studies, and verified by actual earthquakes.1-3 However, the research in recent years shows that the vertical response of traditional base-isolated structures under strong vertical excitations is significant. Sato et al.,4 Furukawa et al.,5 Shi et al.,6 Ryan et al.,7 and so on conducted a series of shaking table tests for full-scale base-isolated structures using the E-Defense shaking table in Japan and the University of California, San Diego, shaking table in the United States. The results show that the traditional base-isolated structures could not provide adequate protection of nonstructural components under vertical excitations. The amplification of the vertical acceleration of the floor slabs from the ground acceleration could reach 6.5 times when the vertical excitations propagated from the foundation to the floor slabs through the isolation layer, columns, and beams.5 The violent vertical response of the floor slabs has a significant impact on a variety of nonstructural components such as medical equipment, precision instruments, water and gas pipes, ceilings, and so on, in important buildings such as medical facilities, data centers, and scientific research institutions. Although the primary structural system can be protected with the base isolation, the damage to the vertical vibration-sensitive nonstructural components can lead to the loss of the functionality of the whole structure and, consequently, the traditional base-isolated structures may fail to achieve the “Full operational” or “Operational” performance states after the earthquakes.8
To provide a complete protection of the structure and important nonstructural components, scholars have proposed the three-dimensional (3D) base isolation technology to mitigate the transmission of the ground motions to the superstructure in both horizontal and vertical directions. Many types of 3D and vertical isolators such as rubber bearings, steel spring bearings, air spring bearings, and so on, were developed and investigated.9-20 Generally, to effectively mitigate the vertical seismic responses, a relatively low vertical stiffness of the 3D base isolator is desired to extend the vertical natural period of the structure from the dominant period range of the vertical excitations. However, it becomes very costly and difficult for the long period 3D isolator to carry heavy vertical load because of the stability problem and limited material properties of the isolator. To date, the 3D base isolation is mainly discussed and used in critical facilities and structures with relatively light weight, such as nuclear power plants,10-15 long-span spatial structures,16-18 low-rise frame structures,19 and important equipment such as power transformers.20
Another challenge for the 3D base isolation is that the overturning moment generated by the horizontal inertia forces of the superstructure under earthquakes causes the coupling of 3D motions and rocking behaviors of the structure, especially when the vertical isolation period is long and the height-to-width ratio of the structure is large. The rocking motion of the structure may increase the seismic responses of the superstructure and internal nonstructural components (especially the free-standing equipment and furniture items). More importantly, the rocking behavior of the structure leads to an increased displacement demand of the vertical isolators and a complex stress state of the vertical isolator components, which will threat the safety of the 3D isolators. To suppress the rocking behavior of the structures and avoid horizontal shear failure and instability problem of the vertical isolators, the vertical isolators currently developed are generally equipped with rigid guiding devices to realize the motion decoupling of the 3D isolators using sleeves, guide rails, piston rods, and other rigid forms.12, 21, 22 However, the manufacture and installation imperfections of guiding devices are easy to cause the jam of the guiding devices in the vertical direction. Specially designed rocking constraint devices have also been developed to suppress the rocking behavior of the 3D base isolation system. For example, Mori et al.19 built a 3D base isolation system with a rocking suppression system consisting of two oil dampers and two hydraulic pipes, which are connected with the upper and lower oil rooms of the oil dampers oppositely in a practical structure. Kageyama et al.23 used pulleys, steel cables, and shafts to design an antirocking system in a fast breeder reactor 3D base isolation system. Shimada et al.24 combined hydraulic load-carrying cylinders, rocking-suppression cylinders, and laminated rubber bearings to constitute a 3D base isolation system for nuclear power plants with adequate capacity for supporting the mass of an actual structure and for suppressing the rocking motion.
The application of vertical movement guiding devices and rocking constraint devices can effectively reduce the influence of the rocking behavior in 3D base isolation system. However, the rocking behavior is an inherent property of the structure with high gravity center. When the structure is heavy, slender or isolated with long period, the price to enhance the rocking constraint capacities is very high. Designing a vertical or 3D floor isolation system by installing a secondary floor on the original structural floor provides a solution to protect important nonstructural components in the room,25-28 but at the price of doubling the slab load to the structural design, and thus it only works in the case with limited need of floor isolation areas.
In this study, a separated 3D isolation scheme is proposed for frame structures. Through the combination of the horizontal isolation at the base of the superstructure and the vertical isolation under the floor slabs, the separated 3D isolation scheme is expected to mitigate the horizontal acceleration of the whole structure to protect the structural members and control the vertical acceleration of the floor slabs to protect the nonstructural components. As the gravity center of the floor slabs is low, the rocking response of the floor slabs can be effectively suppressed. Numerical simulations and shaking table tests are conducted to study the isolation mechanism and seismic performance of the proposed separated 3D isolation scheme. In addition, as the isolation of the floor slabs weakens the constraint of the floor slabs to the beam and column members as in a traditional frame structure,29 the influences of releasing floor slabs to the dynamic properties as well as the seismic behaviors of the structural members are investigated.
2 3D SEPARATED ISOLATION SCHEME FOR FRAME STRUCTURES
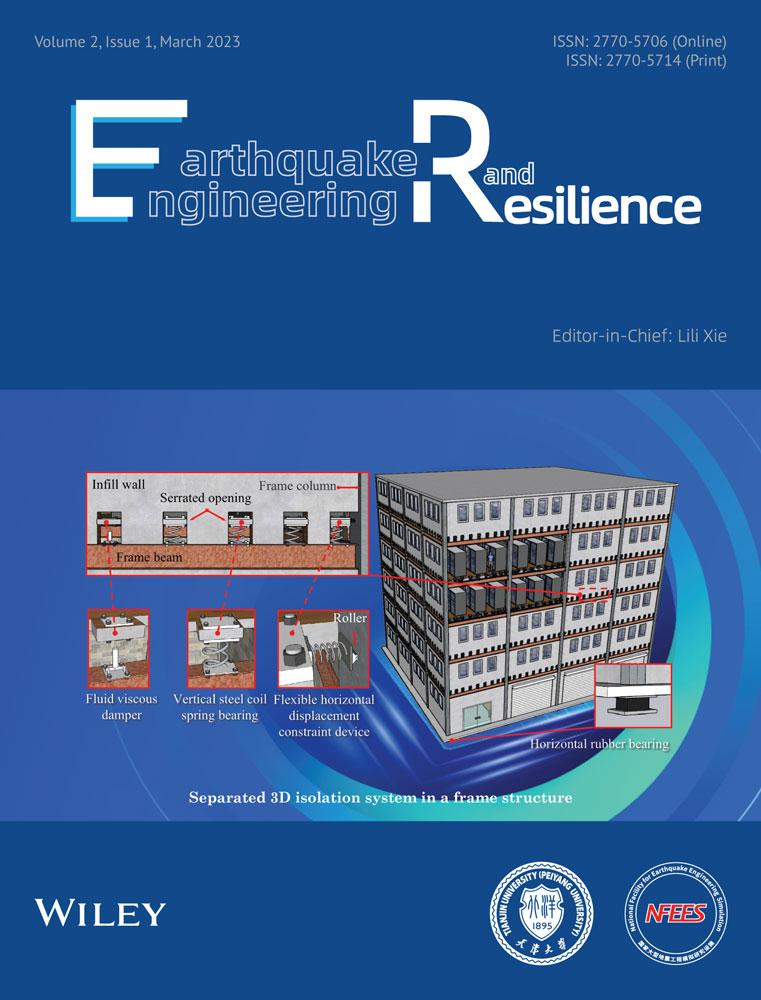
The proposed separated 3D isolation scheme separates the installation locations of horizontal and vertical isolators. The horizontal isolators are arranged at the base of the superstructure and the vertical isolators are arranged between the floor slabs and the beams of each floor. The horizontal isolation in the separated 3D isolation is identical to a traditional base isolation and rubber bearings or friction pendulum bearings can be adopted. The vertical isolators only need to support the load of the floor slabs and steel coil springs can be used. Figure 1 shows an example of the application of the separated 3D isolation scheme in a frame structure for a data center.

According to specific use requirements, the vertical isolation can be installed under all or part of the floor slabs. The infill walls are separated from the isolated floor slabs and connected to the beams and columns as in a traditional frame structure. However, as the floor slabs need to move vertically during an earthquake, they will collide with the infill walls. To accommodate the movements of the floor slabs and the infill walls, serrated openings are set in the infill walls as shown in Figure 1. The isolators and dampers are installed on the beams and can move in the openings.
As the horizontal stiffness of the vertical isolators (e.g., coil springs) is relatively low, the isolated floor slabs can move horizontally when no vertical guiding devices are designed. The floor slabs will also collide with the walls and columns in the horizontal direction. More importantly, the nonstructural components placed close to the walls will collide with the wall. Therefore, to avoid the movement conflict between floor slabs and columns and walls, a flexible horizontal displacement constraint device is designed and installed between the floor slabs and the columns as shown in Figure 1. The device uses a horizontally placed spring and a roller in the vertical direction to provide large horizontal stiffness for the floor slab isolation and small vertical movement friction.
The safety of a frame structure under earthquake mainly depends on the horizontal seismic response of the structure, whereas the behaviors of many nonstructural components in a frame structure, especially for those free-standing items on the floor slabs, are correlated with the vertical floor slab responses. The separated 3D isolation scheme realizes the mitigation of horizontal seismic responses of structural members including the columns and beams through horizontal isolation at the base of the superstructure. On the other hand, the floor slab responses are suppressed by the horizontal isolation at the base of the superstructure and the vertical isolation beneath the floor slabs. Compared with the existing floor isolation scheme,25-28 the separated 3D isolation scheme does not need to build another floor slab above the original structural one that will increase the design load of the structure. The floating of the floor slabs in the separated 3D isolation scheme can reduce the vertical inertia forces transmitted to the structural members but at the expense of weakened integration of the structure. In addition, it is noted that the serrated openings in the walls will reduce the sound insulation performance of the buildings and thus the separated 3D isolation scheme is mainly applicable to laboratories, data and computing centers, and other places with high demands for isolation performance but low requirements for sound insulation and privacy.
3 NUMERICAL SIMULATION OF SEISMIC PERFORMANCE OF SEPARATED 3D ISOLATION SCHEME
To study the isolation effect of the separated 3D isolation scheme in frame structures and verify the influence of floating the floor slabs to the structural performance, a series of simulations are carried out for a typical steel frame structure with different isolation schemes in ABAQUS.
3.1 Finite element model and simulation program
A four-storey full-scale steel frame structure tested in E-Defense30 is adopted in the finite element simulation. Figure 2 shows the configuration and sizes of the structure. The total height is 14.375 m and the height-to-width ratio is 2.40. The weight of a single floor slab in a room is 23.3 t and the total weight of the structure is 225.4 t. The structure is directly used as the base-fixed structure (BF) model and it is also used as the superstructure of different isolation models.

Elastic constitutive model is adopted for concrete floor slabs and bilinear elastic-plastic constitutive model is adopted for steel beams and columns. The Young's modulus of concrete and steel is taken as 30 and 210 GPa, respectively. The section dimension, yield strength, and ultimate strength of different structural members are determined according to Lignos et al.30 A Rayleigh damping model is adopted and the modal damping ratios assigned to the first and second modes to determine the mass proportional damping and stiffness proportional damping are assumed to be 5%. The modal frequency analysis shows that the first two modal frequencies of the BF model are 1.19 and 1.27 Hz, respectively, and their differences from the measured first two modal frequencies of 1.25 and 1.32 Hz in the shaking table test30 are 4.97% and 3.78%, respectively.
The finite element models of the horizontal base-isolated structure (HBI), the 3D base-isolated structure (3DBI), and the separated 3D isolated structure (S3DI) are established by adding an isolation layer at the base of the superstructure as shown in Figure 3 and a vertical isolation layer at the base of all the floor slabs for the S3DI. For the isolation layer at the base of the superstructure, six horizontal or 3D isolators are installed at the locations corresponding to the columns as shown in Figure 2A. With the isolation layer, the total height of the structure is 15.375 m. For the isolation layer at the base of the slabs, three vertical isolators are installed on each beam.

Eight groups of models are designed with different combinations of horizontal and vertical isolation periods as show in Table 1. For the horizontal isolation of the HBI, 3DBI, and S3DI, lead rubber bearings are adopted and the mechanical properties of the bearings are described by a bilinear stiffness model as shown in Figure 3. An isolation period of 3 s is accepted in the design based on the equivalent stiffness corresponding to a 100% shear deformation, when the superstructure is assumed rigid. Detailed design parameters of the lead rubber bearings are shown in Table 2. The resulted equivalent damping ratio corresponding to a 100% shear deformation is 27.2%. Steel coil springs are adopted for the vertical isolation of the 3DBI and S3DI, and the stiffness is described by a linear stiffness model as shown in Figure 3. Three different vertical isolation periods including 0.5, 1, and 3 s are adopted to investigate the coupling behavior of the 3D isolation systems. As shown in Table 1, the required stiffness of a single vertical isolator in the S3DI is significantly smaller than that in the 3DBI and, thus, it is easier to design and manufacture the vertical isolators used in the S3DI. The damping ratio of the vertical isolation is assumed as 0.2, which can be implemented using viscous dampers. To verify the influence of floating the floor slabs, a vertical floor slab isolation (VSI), where the structural base is fixed but the floor slabs are vertically isolated with an isolation period of 0.5 s, is designed for the BF.
| Models | Horizontal isolation | Vertical isolation | ||
|---|---|---|---|---|
| Isolation period (s) | Single isolator stiffness (kN/m) | Isolation period (s) | Single isolator stiffness (kN/m) | |
| HBI | 3 | 166.7 | – | – |
| 3DBI-0.5s | 3 | 166.7 | 0.5 | 5949.4 |
| 3DBI-1s | 3 | 166.7 | 1 | 1484.8 |
| 3DBI-3s | 3 | 166.7 | 3 | 166.7 |
| S3DI-0.5s | 3 | 166.7 | 0.5 | 175.4 |
| S3DI-1s | 3 | 166.7 | 1 | 43.9 |
| S3DI-3s | 3 | 166.7 | 3 | 4.9 |
| VSI-0.5s | – | – | 0.5 | 175.4 |
- Abbreviations: 3DBI, three-dimensional base-isolated structure; HBI, horizontal base-isolated structure; S3DI, separated three-dimensional isolated structure; VSI, vertical floor slab isolation.
| Rubber diameter (mm) | Lead core diameter (mm) | Rubber thickness (mm) | Yield displacement (mm) | 100% Shear deformation | Ultimate deformation (%) | |
|---|---|---|---|---|---|---|
| Equivalent stiffness keq (kN/m) | Equivalent damping ratio | |||||
| 700 | 140 | 110 | 10 | 166.7 | 0.272 | 300 |
The isolators are simulated using a Cartesian connection by setting three-directional stiffness and damping coefficient. For the vertical isolation of the floor slabs, the total horizontal stiffness is set as 10 times the total vertical stiffness to simulate the flexible horizontal displacement constraint device.
It is worth noting that, although the vertical isolation periods are the same for the 3DBI and S3DI, their isolation mechanisms are essentially different. The 3DBI prevents the transmission of the ground motion to the superstructure from the base and reduces the vertical responses of the whole structure. On the other hand, however, the S3DI attempts to mitigate the vertical responses of the floor slabs only, and the input to the vertical isolation is the excitation of the beams.
3.2 Selected ground motions
To study the seismic performance of different isolation schemes under rare earthquakes, 10 near-fault ground motions (closest horizontal distance to the surface projection of the fault plane Rjb < 20 km) at soft soil sites (VS30 < 260 km/s), which have a relatively high ratio of peak vertical ground acceleration (PGAV) to peak horizontal ground acceleration (PGAH) are selected from the Pacific Earthquake Engineering Research Center database. The basic information and the PGAV/PGAH ratio of the ground motions are shown in Table 3. The amplitude of the maximum acceleration in three directions of each ground motion is scaled to 6.2 m/s2 (0.62 g), which is corresponding to the rarely occurred earthquake of seismic precautionary intensity of 9 in the Chinese seismic design code,31 and the maximum accelerations in the other two directions are adjusted with the same scale ratio.
| Record number | PEER ID | Record name | Rjb (km) | VS30 (km/s) | PGA of X, Y, and Z directions (m/s2) | PGAV/PGAH |
|---|---|---|---|---|---|---|
| 1 | 6 | Imperial Valley-02 | 6.1 | 213.4 | 2.75, 2.07, 1.75 | 0.85 |
| 2 | 170 | Imperial Valley-06 | 7.3 | 192.1 | 2.08, 2.31, 2.40 | 1.15 |
| 3 | 209 | Imperial Valley-08 | 9.4 | 193.7 | 1.10, 1.48, 1.16 | 1.05 |
| 4 | 1114 | Kobe_Japan | 3.3 | 198.0 | 3.41, 2.84, 5.56 | 1.96 |
| 5 | 5992 | El Mayor-Cucapah_Mexico | 15.4 | 196.3 | 5.75, 4.33, 2.46 | 0.57 |
| 6 | 458 | Morgan Hill | 11.5 | 221.8 | 2.20, 3.42, 4.05 | 1.84 |
| 7 | 718 | Superstition Hills-01 | 17.6 | 179.0 | 1.28, 1.30, 1.78 | 1.39 |
| 8 | 721 | Superstition Hills-02 | 18.2 | 192.1 | 3.50, 2.51, 1.25 | 0.50 |
| 9 | 266 | Victoria_Mexico | 18.5 | 242.1 | 1.48, 0.96, 0.95 | 0.99 |
| 10 | 317 | Westmorland | 7.6 | 191.1 | 1.91, 1.78, 2.28 | 1.28 |
- Abbreviations: PEER, Pacific Earthquake Engineering Research Center; PGA, peak ground acceleration; PGAH, peak horizontal ground acceleration; PGAV, peak vertical ground acceleration.
Figure 4 shows the acceleration spectra corresponding to a 5% damping ratio in the three directions of the selected ground motions scaled to 6.2 m/s2 and the average spectrum. As shown by the figure, the dominant frequency of the vertical component of the ground motions is relatively higher than that of the horizontal components. This illustrates that adopting a shorter isolation period in the vertical direction than in the horizontal direction is reasonable.

3.3 Discussion of simulation results
3.3.1 Influence of motion coupling behavior of 3D isolations to modal properties
The modal analysis results of different isolation schemes are shown in Table 4. The values in brackets in columns 3–8 of the table are the reduction percentage of the corresponding frequencies relative to the frequencies of the HBI in column 2. Besides, the changes of the modal frequencies of different isolation schemes with the vertical isolation periods are shown in Figure 5. The results of the HBI are also shown in the figure with red dotted lines for reference. From the comparison of the modal frequencies of the HBI and 3DBI with different vertical isolation periods, it is noted that the modal frequencies of the 3DBI have changed dramatically due to the coupling of translational modes in X and Y directions and the rocking modes. As the vertical isolation period gradually approaches the horizontal isolation period, the motion coupling effect becomes more significant. The decrease of the first two mode frequencies caused by the motion coupling is around 70% for the 3DBI-3s case. When the vertical isolation is installed beneath the floor slabs in the S3DI, the influence of motion coupling effect on the modal frequency of the structure is effectively mitigated. The variation of the vertical isolation period of the floor slabs only changes the modal frequencies slightly. According to the simulation results shown in Table 4, the frequency change is <2.4% for the first horizontal translational mode. For the second horizontal translational mode, the maximum decrease of the modal frequency increases to 31.2%, mainly due to the stiffness reduction of superstructure caused by the isolation of the floor slabs. Therefore, the proposed separated 3D isolation scheme can effectively reduce the influence of the motion coupling effect on the dynamic characteristics of the structures. In addition, it is noted that the vertical isolation of the whole structure or the floor slabs does not affect the torsion mode and the vertical mode significantly, according to Figure 5E,F.
| Mode | HBI | 3DBI-0.5s | 3DBI-1s | 3DBI-3s | S3DI-0.5s | S3DI-1s | S3DI-3s |
|---|---|---|---|---|---|---|---|
| 1st mode in X direction | 0.328 | 0.301 (8.2%) | 0.242 (26.2%) | 0.104 (68.2%) | 0.322 (1.8%) | 0.321 (2.1%) | 0.320 (2.4%) |
| 1st mode in Y direction | 0.329 | 0.313 (4.8%) | 0.274 (16.7%) | 0.134 (59.3%) | 0.324 (1.5%) | 0.324 (1.5%) | 0.323 (1.8%) |
| Torsion | 0.438 | 0.433 (1.1%) | 0.433 (1.1%) | 0.433 (1.1%) | 0.432 (1.4%) | 0.432 (1.4%) | 0.432 (1.4%) |
| 2nd mode in X direction | 1.736 | 0.977 (43.7%) | 0.669 (61.4%) | 0.522 (69.9%) | 1.228 (29.3%) | 1.215 (30.0%) | 1.233 (28.9%) |
| 2nd mode in Y direction | 1.871 | 1.148 (38.6%) | 0.736 (60.7%) | 0.535 (71.4%) | 1.296 (30.7%) | 1.295 (30.8%) | 1.288 (31.2%) |
- Abbreviations: 3DBI, three-dimensional base-isolated structure; HBI, horizontal base-isolated structure; S3DI, separated three-dimensional isolated structure.

3.3.2 Structural responses and the isolation performance
Figure 6 shows the transmission of horizontal (X) and vertical (Z) accelerations at different locations (floor slab center and column-to-beam joint) in the structures along the height under the Kobe_Japan ground motion (No. 4, see Table 3). For the BF, the lateral stiffness is relatively low and the vertical stiffness is large for the frame, and the in-plane stiffness is large and the out-of-plane stiffness is small for the floor slabs. Therefore, the horizontal acceleration of the BF is mainly amplified among different floors along the structure height and the difference of horizontal acceleration response on the same floor (floor slab center and column-to-beam joint) is small as shown in Figure 6. On the contrary, the vertical acceleration is mainly amplified on the same floor from the column-to-beam joint to the floor slab center and the difference of vertical acceleration response between different floors is small. Installing the vertical isolation layers under the floor slabs is expected to suppress the transmission of strong vertical ground acceleration to different floors.

It can be seen from Figure 6A that the three different types of isolation structures can effectively mitigate the amplification of horizontal acceleration between different floors. According to Figure 6B, the vertical acceleration response at the beam-to-column joints of the S3DI is similar to that of the HBI and larger than that of the 3DBI because the beams and columns are not vertically isolated. Nevertheless, the vertical acceleration at the center of each floor slab in the S3DI is similar to that in the 3DBI. The vertical isolation under the floor slabs can effectively mitigate the amplification of vertical acceleration on the same floor and thus achieve the protection of acceleration-sensitive nonstructural components such as suspended ceilings, pipes, and free-standing equipment. Although the vertical acceleration at the beam-to-column joints is relatively large, it has little impact on the structural safety and the response of nonstructural components. Furthermore, in the HBI and S3DI, the vertical acceleration is amplified from the ground to the base due to the high vertical stiffness of the horizontal isolation layer, which causes the resonance of the vertical high-frequency components of the ground motion, resulting in the amplification of the vertical acceleration.
The maximum accelerations in X and Z directions of the slab center of the second floor in different structures under the 10 ground motions are shown in Table 5. For other floors, the responses are similar under the same ground motion due to the isolation effect of different isolation schemes except for the BF, as shown in Figure 6.
| Record number | Structures | Max acceleration (m/s2) | Record number | Structures | Max acceleration (m/s2) | ||
|---|---|---|---|---|---|---|---|
| X | Z | X | Z | ||||
| 1 | BF | 8.70 | 14.26 | 2 | BF | 3.11 | 31.85 |
| HBI | 1.16 | 15.74 | HBI | 2.52 | 34.49 | ||
| 3DBI-0.5s | 1.04 | 3.44 | 3DBI-0.5s | 2.45 | 3.84 | ||
| S3DI-0.5s | 1.00 | 3.16 | S3DI-0.5s | 2.50 | 3.31 | ||
| 3DBI-1s | 0.94 | 1.00 | 3DBI-1s | 2.02 | 2.05 | ||
| S3DI-1s | 1.00 | 0.97 | S3DI-1s | 2.49 | 2.15 | ||
| 3DBI-3s | 0.88 | 0.48 | 3DBI-3s | 1.21 | 1.24 | ||
| S3DI-3s | 0.99 | 0.27 | S3DI-3s | 2.49 | 0.95 | ||
| 3 | BF | 8.10 | 23.02 | 4 | BF | 5.97 | 11.56 |
| HBI | 0.96 | 16.18 | HBI | 1.33 | 14.66 | ||
| 3DBI-0.5s | 0.86 | 1.79 | 3DBI-0.5s | 1.00 | 4.91 | ||
| S3DI-0.5s | 0.74 | 1.86 | S3DI-0.5s | 1.05 | 5.15 | ||
| 3DBI-1s | 0.91 | 1.01 | 3DBI-1s | 1.07 | 3.68 | ||
| S3DI-1s | 0.72 | 1.05 | S3DI-1s | 1.04 | 3.61 | ||
| 3DBI-3s | 0.79 | 0.25 | 3DBI-3s | 0.74 | 1.61 | ||
| S3DI-3s | 0.72 | 0.19 | S3DI-3s | 0.99 | 1.74 | ||
| 5 | BF | 13.13 | 9.35 | 6 | BF | 8.62 | 23.40 |
| HBI | 1.12 | 8.61 | HBI | 0.76 | 26.43 | ||
| 3DBI-0.5s | 0.97 | 1.56 | 3DBI-0.5s | 0.67 | 2.52 | ||
| S3DI-0.5s | 0.76 | 1.82 | S3DI-0.5s | 0.68 | 2.78 | ||
| 3DBI-1s | 1.22 | 1.01 | 3DBI-1s | 0.70 | 1.33 | ||
| S3DI-1s | 0.75 | 0.94 | S3DI-1s | 0.67 | 1.38 | ||
| 3DBI-3s | 1.19 | 0.53 | 3DBI-3s | 0.81 | 0.46 | ||
| S3DI-3s | 0.55 | 0.36 | S3DI-3s | 0.58 | 0.46 | ||
| 7 | BF | 9.35 | 20.76 | 8 | BF | 5.33 | 10.49 |
| HBI | 0.95 | 21.22 | HBI | 1.21 | 9.13 | ||
| 3DBI-0.5s | 0.79 | 2.37 | 3DBI-0.5s | 1.04 | 1.46 | ||
| S3DI-0.5s | 0.75 | 2.76 | S3DI-0.5s | 1.00 | 1.72 | ||
| 3DBI-1s | 0.79 | 1.03 | 3DBI-1s | 0.73 | 1.16 | ||
| S3DI-1s | 0.74 | 1.19 | S3DI-1s | 1.00 | 1.00 | ||
| 3DBI-3s | 0.77 | 0.48 | 3DBI-3s | 0.85 | 0.62 | ||
| S3DI-3s | 0.64 | 0.42 | S3DI-3s | 0.98 | 0.35 | ||
| 9 | BF | 8.22 | 12.36 | 10 | BF | 9.87 | 18.44 |
| HBI | 1.57 | 11.50 | HBI | 0.94 | 14.22 | ||
| 3DBI-0.5s | 1.46 | 3.93 | 3DBI-0.5s | 0.80 | 1.81 | ||
| S3DI-0.5s | 1.41 | 4.19 | S3DI-0.5s | 0.80 | 1.53 | ||
| 3DBI-1s | 1.00 | 1.99 | 3DBI-1s | 0.95 | 1.11 | ||
| S3DI-1s | 1.42 | 1.87 | S3DI-1s | 0.77 | 0.85 | ||
| 3DBI-3s | 0.91 | 0.53 | 3DBI-3s | 1.10 | 0.56 | ||
| S3DI-3s | 1.42 | 0.46 | S3DI-3s | 0.57 | 0.33 | ||
- Abbreviations: 3DBI, three-dimensional base-isolated structure; BF, base-fixed structure; HBI, horizontal base-isolated structure; S3DI, separated three-dimensional isolated structure.
The isolation efficiency of horizontal and vertical acceleration at the center of the second floor under rare earthquakes of seismic precautionary intensity of 9 is shown in Figure 7, where the numbers and red dotted lines show the average reduction rate. According to Figure 7A, the average isolation efficiency of the maximum horizontal acceleration of the HBI is 79.27% under 10 ground motions. When the vertical isolation period is 0.5 s, the average isolation efficiency of the maximum horizontal acceleration of the 3DBI and S3DI is 81.29% and 81.57%, respectively. The increase of the vertical isolation period from 0.5 to 3 s changes the horizontal isolation efficiency of the 3DBI slightly but does not change that of the S3DI as shown in Figure 7A, because the change of the vertical isolation period affects the first-mode horizontal natural period of the 3DBI obviously, whereas it has very limited influence on the dynamic characteristics of the S3DI as shown in Table 4.

According to Figure 7B, the average isolation efficiency of the maximum vertical acceleration of the HBI is only 1.98%. When the vertical isolation period is 0.5 s, the average isolation efficiency of the maximum vertical acceleration of the 3DBI and S3DI is 81.92% and 81.16%, respectively. When the vertical isolation period increases to 3 s, the average isolation efficiency increases to 95.45% and 96.26%, respectively. The vertical isolation efficiency of the 3DBI and S3DI is close, and it is significantly higher than that of the HBI.
The isolation efficiency of the inter-storey drift ratio of the first storey in the X direction under the 10 ground motions is shown in Figure 8, where the red dotted lines show the average reduction rate. According to the figure, the average isolation efficiency of the inter-storey drift ratio of the HBI and 3DBI under the 10 ground motions is 73.69% and 88.38%, respectively. The performance of the 3DBI is better than that of the HBI because of the higher horizontal acceleration isolation control effect as shown in Figure 7A. Although the floor slab constraint effect is weakened because of the floated floor slabs, the S3DI can still significantly mitigate the inter-storey drift with the maximum average inter-storey drift isolation efficiency of 74.31%, which is similar to that of the HBI due to the base isolation effect on the frame.

Figure 9 shows the vertical load varying range of the horizontal isolators at the locations of C1-1 and C2-1 as shown in Figure 2A under the selected ground motions. The numbers and red dotted lines in the figure represent the average ranges of the vertical load in different isolated structures and the red solid line shows the static vertical load of the isolators under the weight of the structure. For the HBI, the combination of the large vertical acceleration as shown in Table 5 and the rocking moment of the structure caused by the horizontal acceleration leads to large compression forces of the isolators with the maximum value of 1146 kN. Under the dynamic responses, tensile forces occur with the maximum value of 119 kN. When the superstructure is isolated by the 3D base isolation scheme, the seismic dynamic vertical load to the isolators can be significantly mitigated. Although the horizontal acceleration is similar to that in the HBI, the reduced vertical response helps mitigate the vertical loads considerably. As the vertical isolation period becomes longer, the vertical load varying range becomes smaller and gradually approaches the static vertical load because of the mitigated dynamic vertical load. Besides, it is noted that the vertical loads on the horizontal isolators at the corner and the middle of the structure become closer to each other with the increase of the vertical isolation period. The separated 3D isolation scheme can also effectively reduce the vertical loads of the horizontal isolators and avoid the occurrence of tensile forces of the isolators. As it does not reduce the vertical responses of the beams and columns, its reduction to the vertical loads of the horizontal isolators is less effective than in the 3DBI.

3.3.3 Rocking response of 3D isolations and its influences
The rocking responses of the whole structure in the 3DBI and the floor slabs in the S3DI have an important impact on the seismic behavior of the isolators, structures, and nonstructural components. A rocking angle θ is defined as the ratio between the difference of vertical displacements of two isolators at the opposite side of the boundary of the isolation layer and the distance of the two isolators. For the S3DI, the rocking angle of the fourth floor is normally the largest and, thus, it is selected for comparison. Figure 10 shows the rocking angle under different earthquakes for the 3DBI and S3DI along the long side and the short side of the structure or the floor slab. It is noted from the figure that the rocking angles along the short side are significantly larger than that along the long side in the 3DBI and S3DI, because the height-to-width ratio of the structure and the floor slabs along the short side is larger than that along the long side.

As shown in Figure 10A, the rocking angle of the floor slabs in the S3DI is significantly smaller than that of the whole structure in the 3DBI under all the ground motions, primarily because of the lower gravity center in the 3DBI. The maximum rocking angle of floor slabs is only 0.022 rad in the S3DI, whereas it increases to 0.11 rad for the whole structure in the 3DBI when the vertical isolation period is 3 s. With the vertical isolation period approaching the horizontal isolation period (3 s) in the 3DBI, the motion coupling becomes significant,32 and the rocking angle of whole structure increases dramatically. When the vertical isolation period is increased from 0.5 s to 3 s, the rocking angle increases by 0.028 rad on average for the 3DBI and 0.011 rad on average for the S3DI.
Large rocking angles of the structure or floor slabs will cause a series of problems. Most importantly, it will considerably increase the displacement and force demand to the isolators. Figure 11 shows the maximum vertical displacement responses of the vertical isolator at the corner (C1-1 in Figure 2) in the 3DBI and S3DI, and Figure 12 shows the corresponding ratio of the minimum and the maximum vertical loads under different ground motions to the static vertical load of the vertical isolators. The black dotted lines in the figure represent the static state under the dead weight of the superstructure. By comparing the maximum and minimum ratios shown by the columns with the black dotted lines, the degree of change in the vertical load of the isolators under earthquakes can be demonstrated. According to Figure 11, the vertical displacement varying ranges of the vertical isolator for the 3DBI with the isolation periods of 0.5, 1, and 3 s are at most 2.8, 5.0, and 6.7 times larger than for the S3DI under different ground motions because of the rocking effect. It is noted that when the vertical isolation period is longer, the difference in the rocking effect of the two isolation schemes is more significant, and thus the difference in their vertical displacement varying ranges is larger. The increased displacement demand to the vertical isolator consequently causes higher levels of dynamic loads to the isolator as shown in Figure 12. For the 3DBI, the ratio of the minimum and the maximum vertical loads under different ground motions to the static vertical load from the structure weight is in the range of (0.18, 1.73). When the floor slabs are isolated, the vertical load demand is greatly reduced and the ratio is in the range of (0.62, 1.24). In addition, it is noted that the absolute maximum vertical load of 1 vertical isolator in the 3DBI is about 47 times that in the S3DI. Considering the difficulties in designing and manufacturing 3D or vertical isolators with large size and capacity, the vertical load for the isolators becomes one of the most important factors which influence the application of 3D isolation in engineering practice. The low vertical load for the vertical isolators in the S3DI enables an easy and feasible solution to control the vertical responses of the structures.


The large rocking responses of the 3DBI also cause significant displacement and velocity responses of the superstructure, which can become a threat to the human safety.33 Figure 13 shows the displacement and velocity responses at the roof of 3DBI and S3DI when the vertical isolation period is 1 s under the Imperial Valley-06 ground motion (No. 2, see Table 3). The results show that the S3DI can effectively mitigate the displacement and velocity responses of the superstructure comparing to the 3DBI.

In addition, the rocking response may increase the seismic responses of the free-standing nonstructural components and cause disorder and damage of them.34 For the free-standing components with a small friction ratio (can be smaller than 0.036), the great rocking angle of the structure of 0.1 rad can even cause the sliding under the rocking excitations only. For the items with a large friction ratio (can be larger than 0.66), the great rocking angle may accelerate its rocking responses and increase the possibility of overturning. Installing the vertical isolation under the floor slabs in the S3DI can greatly mitigate the rocking influences to the nonstructural components at a low cost (does not need rocking constraint devices).
3.3.4 Influence of isolating the slabs to the structural member responses
Previous analysis shows that the S3DI can effectively mitigate the acceleration responses of the floor slabs in both horizontal and vertical directions. However, isolating the floor slabs from the beams will considerably weaken the constraint of the floor slabs to the beams and column-to-beam connections, and thus influence the integration of the whole structure.
Table 6 gives the peak structural responses on the second floor, including the transverse bending moment and stress in the middle span of the G11 beam (see Figure 2). In the table, α1 is the ratio of the difference between the BF and VSI to the result of the BF, whereas α2 is the ratio of the difference between the HBI and S3DI with a vertical isolation period of 0.5 s to the result of the HBI. By comparing the results of the BF and VSI, the lack of floor slab constraint will lead to a significant increase of the transverse bending moment and stress. The maximum increases of the transverse bending moment and the stress in the middle span of the beam are up to 134% and 131%, respectively. Figure 14 graphically shows the time history of the transverse bending moment My in the midspan of G11 beam and C1-2 column on the second floor (see Figure 2) of the BF and VSI with a vertical isolation period of 0.5 s under the El Mayor-Cucapah_Mexico ground motion (No. 5, see Table 3). Similar observations can be found from the figure.
| Record number | Response | BF | VSI | α1 | HBI | S3DI-0.5s | α2 |
|---|---|---|---|---|---|---|---|
| 1 | My (kN·m) | 21.1 | 42.9 | 103% | 12.0 | 14.2 | 18% |
| Stress (MPa) | 35.0 | 80.9 | 131% | 30.6 | 39.8 | 30% | |
| 2 | My (kN·m) | 28.9 | 65.6 | 127% | 25.6 | 21.4 | −16% |
| Stress (MPa) | 42.6 | 60.2 | 41% | 39.6 | 34.0 | −14% | |
| 3 | My (kN·m) | 12.2 | 28.6 | 134% | 5.8 | 6.0 | 3% |
| Stress (MPa) | 28.8 | 44.9 | 56% | 35.9 | 30.1 | −16% | |
| 4 | My (kN·m) | 37.1 | 43.5 | 17% | 20.1 | 15.2 | −24% |
| Stress (MPa) | 34.3 | 47.8 | 39% | 31.1 | 40.5 | 23% | |
| 5 | My (kN·m) | 28.2 | 41.5 | 47% | 10.8 | 7.5 | −31% |
| Stress (MPa) | 40.7 | 43.8 | 8% | 33.5 | 23.5 | −30% | |
| 6 | My (kN·m) | 18.1 | 27.6 | 52% | 25.8 | 16.6 | −36% |
| Stress (MPa) | 22.1 | 47.3 | 114% | 33.1 | 28.3 | −15% | |
| 7 | My (kN·m) | 21.5 | 28.1 | 31% | 17.6 | 6.3 | −64% |
| Stress (MPa) | 35.1 | 44.5 | 27% | 33.1 | 30.4 | −8% | |
| 8 | My (kN·m) | 14.9 | 20.4 | 35% | 12.2 | 6.8 | −44% |
| Stress (MPa) | 26.9 | 36.4 | 35% | 23.1 | 19.1 | −17% | |
| 9 | My (kN·m) | 20.5 | 43.9 | 114% | 14.8 | 10.4 | −30% |
| Stress (MPa) | 34.3 | 62.2 | 81% | 28.1 | 39.0 | 39% | |
| 10 | My (kN·m) | 19.9 | 37.7 | 89% | 13.6 | 10.2 | −33% |
| Stress (MPa) | 35.7 | 72.9 | 104% | 26.8 | 29.1 | 9% |
- Abbreviations: BF, base-fixed structure; HBI, horizontal base-isolated structure; S3DI, separated three-dimensional isolated structure; VSI, vertical floor slab isolation.

In contrary, when the horizontal isolation is adopted in the S3DI, the influence of the lack of floor slab constraint is mitigated significantly. As shown in Section 3.3.1, the isolation of the slabs primarily affects the high modes of the structure. The differences of the transverse bending moment and stress between the HBI and S3DI are small with the maximum α2 ratio of 18% and 39%, respectively. In most of the cases, the transverse bending moment and stress are reduced due to the vertical isolation of floor slabs in the S3DI, with the maximum α2 ratio of 64% and 30%, respectively. Figure 15 graphically shows the time history of the transverse bending moment My of the G11 beam and C1-2 column on the second floor of the HBI and S3DI with a vertical isolation period of 0.5 s under the El Mayor-Cucapah_Mexico ground motion (No. 5, see Table 3). It is noted that the transverse bending moments of beams and columns of the S3DI are reduced by 31% and 33%, respectively, compared with the HBI.

According to the analysis above, the vertical isolation of the floor slabs in the horizontal base isolation does not cause a significant increase of the structural responses compared with results of the horizontal base isolation. This is because the lateral stiffness of the horizontal isolation layer is small and the lateral stiffness of the superstructure in the S3DI is far larger than that of the horizontal isolation layer even if the floor slab is elevated, which reduces the influence of weakened constraint of the floor slabs to the beams and column-to-beam joints.
4 SHAKING TABLE TEST AND ANALYSIS
4.1 Test specimen
To verify the performance of the proposed separated 3D isolation scheme, shaking table tests were carried out. The test specimen is shown in Figure 16. The side length of the structure was 1 m in the X direction and 1.77 m in the Y direction. The height of the first and second floors was 1 and 1.3 m, respectively, and the height-to-width ratio of the structure in X and Y directions was 2.6 and 1.47, respectively. H-shaped steel beams and columns were adopted and the section size was 100 × 100 × 6 × 8 mm. The second and third floors were installed with concrete slabs with a size of 1770 × 1100 × 200 mm and the mass of a single concrete slab was 880 kg. The slabs were considered to be rigid in the test.

There were three types of structures in the shaking table tests including the BF, HBI, and S3DI. Springs and linear sliders as shown in Figure 17 were adopted at the base of the structure for the HBI and the design value of the horizontal isolation period was 2 s. The vertical isolation springs of the floor slabs were arranged on the beams of the second floor and the design value of the vertical isolation period was 1 s. The damping of the isolation layer was achieved using viscous dampers (see Figure 17C) and the tested damping ratios of the horizontal and vertical isolation layers were 8% and 11.5%, respectively.

4.2 Measuring scheme
Figure 18 shows the installation of sensors. Nine accelerometers were arranged in the test to record the acceleration responses. Three accelerometers (A0X, A0Y, and A0Z) were arranged in X, Y, and Z directions of the shaking table, respectively, and six accelerometers (A2X, A2Y, A2Z, A3X, A3Y, and A3Z) were arranged in the center of the floor slabs on the second and third floors in X, Y, and Z directions, respectively. Five displacement sensors were adopted to measure the inter-story drift of the first and second floors (D1 and D2), the rocking angle of floor slabs (D3 and D4) and the displacement of the horizontal isolation layer (D5). Six strain gauges were also arranged at the beam end and column end in the first floor (S1, S2, S3) and second floor (S4, S5, and S6).

4.3 Testing schedule
In the shaking table test, four ground motion records were selected as shown in Table 7. The peak acceleration in X, Y, and Z directions of each ground motion was scaled to 2.0 or 4.0 m/s2 (0.2 or 0.4 g), which was corresponding to the level of frequently occurred or rarely occurred earthquake of seismic precautionary intensity of 8 in the Chinese seismic design code.31 In the shaking table test, the X and Z direction components of the selected ground motions were used as the input.
| Record number | Record name | Year | PGA of X, Y, and Z directions (m/s2) | Scaled PGA of X, Y, and Z directions (m/s2) |
|---|---|---|---|---|
| 1 | ChiChi | 1999 | 1.45, 1.94, 1.31 | 1.49, 2.00, 1.35 |
| 2 | Northridge | 1994 | 4.83, 2.10, 1.17 | 2.00, 0.87, 0.48 |
| 3 | Tianjin | 1976 | 1.04, 1.46, 0.73 | 1.42, 2.00, 1.00 |
| 4 | JMA (0.2 g) | 1995 | 8.18, 6.17, 3.32 | 2.00, 1.51, 0.81 |
| 5 | JMA (0.4 g) | 1995 | 8.18, 6.17, 3.32 | 4.00, 3.02, 1.62 |
- Abbreviation: JMA, Kobe earthquake recorded by the Japan Meteorological Agency; PGA, peak ground acceleration.
4.4 Testing results analysis
The second floor slab acceleration response reduction rate (see Equation 1 in Section 3.3.2) of the HBI and S3DI is shown in Figure 19A,B. According to the figure, the average horizontal and vertical acceleration reduction rates for the S3DI under multiple ground motions were 56.3% and 49.6%, respectively. The average horizontal acceleration reduction rate of the HBI was 45.9%. However, the average vertical acceleration reduction rate was reduced to only 7% and the vertical acceleration was even amplified by 33.5% under the Kobe earthquake recorded by the Japan Meteorological Agency (0.2 g) ground motion (No. 4, see Table 7). Therefore, the S3DI could effectively reduce the horizontal and vertical acceleration responses of the structure.

The comparison of the structural stress reduction rate of the beams and columns close to the beam-to-column joint on the second floor (see Equation 1 in Section 3.3.2) between the HBI and S3DI is shown in Figure 19C,D. According to Figure 19D, it is noted that the isolation effect of the column stress of the S3DI was lower than that of the HBI under the Northridge ground motion (No. 2, see Table 7), because the constraint of the floor slab to the frame was weakened. Although the floor slab was elevated and the floor slab constraint was weakened, the stress of beams and columns did not increase. According to Figure 19C,D, the S3DI effectively reduced the stress on the key structural members and performed better than the HBI in most cases. The observations from test results were consistent with the finite element analysis results.
The maximum inter-story drift ratio and the maximum floor slab rocking angle of the S3DI under each ground motion measured in the test are shown in Table 8. The reduction rates of the maximum inter-story drift ratio (see Equation 1 in Section 3.3.2) of the first and second floors were 69.6% and 79.8%, respectively, for the S3DI, and 72.4% and 73.3%, respectively, for the HBI. The reduction effect of the inter-story drift ratio of the S3DI and HBI was similar, which was also consistent with the conclusions obtained by finite element simulation.
| Record | ChiChi (0.2 g) | Northridge (0.2 g) | Tianjin (0.2 g) | JMA (0.2 g) | JMA (0.4 g) |
|---|---|---|---|---|---|
| Maximum rocking angle (rad) | 0.0050 | 0.0043 | 0.0046 | 0.0051 | 0.0071 |
| Peak inter-story drift ratio of first floor | 0.00023 | 0.00025 | 0.00046 | 0.00028 | 0.00047 |
| Peak inter-story drift ratio of second floor | 0.00014 | 0.00019 | 0.00033 | 0.00032 | 0.00038 |
- Abbreviation: JMA, Kobe earthquake recorded by the Japan Meteorological Agency; S3DI, separated three-dimensional isolated structure.
The maximum rocking angle of the second floor slab in the S3DI was 0.0071 rad and the average value under the 0.2 g ground motions was 0.0048 rad. The observed rocking angle of the slab in the test was small as expected.
5 CONCLUSIONS
- 1.
The horizontal acceleration of the structure is mainly amplified between different floors, and the vertical acceleration is mainly amplified on the same floor. Therefore, the separated 3D isolation scheme can suppress the transmission of the horizontal ground motion to higher floors and the transmission of vertical ground motion on the same floor. Isolating the slabs from the beams will weaken the constraint of the slabs to the beams and column-to-beam joints and thus influence the integration of the whole structure. However, with the horizontal base isolation for the superstructure, the weakened constraint only affects the high-mode dynamic properties and the first-mode (isolation mode) natural frequency is only slightly changed. The horizontal base isolation reduces the influence resulting from isolating the floor slabs.
- 2.
The simulation results show that the separated 3D isolation scheme can result in a similar horizontal acceleration isolation effect as a horizontal base isolation and a similar vertical acceleration isolation effect as a 3D base isolation. It can significantly restrain the structural motion coupling and reduce the rocking behavior in 3D base isolation due to its low gravity center of the floor slabs. A smaller vertical load bearing capacity demand is achieved because of the light weight and suppressed rocking behavior of the floor slabs. The separated 3D isolation scheme can also effectively control the inter-storey drift, and beam and column member stress as in a horizontal isolation. The weakened constraint of the floor slabs to the beams and column-to-beam joint does not cause safety concerns for the structure because of the contribution of the horizontal base isolation at the base.
- 3.
The shaking table results show that the average maximum isolation efficiency of the horizontal and vertical accelerations of the S3DI was 56.3% and 49.6%, respectively, and the maximum isolation efficiency of the inter-story drift was 79.8%. The stress of the beams and columns was similar to that in the HBI, and the maximum rocking angle of the floor slab measured in the shaking table tests was 0.7% under the 0.4 g input excitation. The observations from the shaking test results for different response reductions were consistent with the finite element analysis results.
Nevertheless, it has to be pointed out that the separated 3D isolation scheme needs to leave openings on the infill walls to accommodate the movement of the isolated slab and the structure. Therefore, the separated 3D isolation scheme is mainly applicable to structures with high isolation requirements but low requirements for sound insulation and privacy.
ACKNOWLEDGMENTS
This research is funded by the National Natural Science Foundation of China (Grant No. 51978463, 52178497), State Key Laboratory of Disaster Reduction in Civil Engineering (Grant No. SLDRCE18-03).
CONFLICTS OF INTEREST STATEMENT
The authors declare no conflicts of interest.