Seismic hazard mapping of Ohrid, North Macedonia
Abstract
The city of Ohrid is one of the oldest settlements in the western Balkans, exceptionally rich with archeological, architectural, and cultural sites, which must be protected from damage during future earthquakes by proper retrofitting and strengthening of the old structures. To provide a sound basis for retrofitting work, in this paper, we describe the amplitudes of strong ground motion in Ohrid for a range of probabilities of being exceeded. We use the Uniform Hazard Method to compute the amplitudes of strong motion, and, in the calculations, we explicitly include the geological site conditions for all the maps we show. By noting the large jumps in the predicted strong motion amplitudes at sites along the contact between basement rock and sediments, we emphasize that the empirical scaling equations for strong motion amplitudes must include explicit dependence on the geological site conditions.
1 INTRODUCTION
Seismic hazard mapping is significant for the city of Ohrid, a double World Heritage Site (natural and cultural), because of its numerous archeological remains and many structures that are of exceptional importance for the Macedonian cultural heritage and should be protected from damage from future earthquake shaking. Ohrid is one of the oldest human settlements in Europe. The old town has structures dating back to different historic periods, including antiquity, the early Christian period, the Middle Ages, and the Ottoman period. It is the seat of the oldest Slav monastery, St. Pantelejmon, and the home of more than 800 Byzantine-style icons painted between the 11th and the 14th centuries. One of the oldest monasteries, founded by St. Clement in the 9th century, is considered to be the first University in the Balkans. Archeological excavations have uncovered seven basilicas in ancient Ohrid (Lychnidos) dating from the 4th, 5th, and early 6th centuries featuring numerous exquisite mosaic floors. Other prominent architectural and spiritual centers around Lake Ohrid and the cities of Ohrid and Struga are the monasteries, St. Naum, at the southern coast of the lake, St. Archangel Michael in Ragožda on the west coast of the lake and St. John the Theologian at Kaneo.
Despite its proximity to the seismically active regions of eastern Albania and northern Greece, we noted low levels of predicted amplitudes of strong ground motion for the city, for example, 0.24 g, as in the map from NATO project 983054, reproduced in Figure 1.1 In contrast, other studies estimate considerably larger amplitudes of strong motion, for example, peak acceleration of 0.66 g, as in Figure 2.2 Because of the discrepancy in the predicted ground motions by different studies, and in view of the high concentration of historical, archeological, and architectural sites and their significance, in this paper, we address and further quantify these large differences by presenting Uniform Hazard Spectrum amplitudes of strong ground motion for this city.
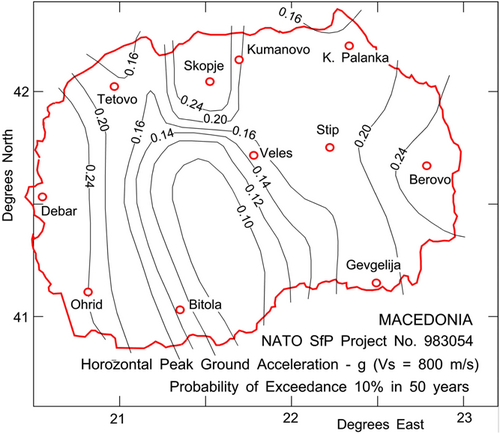
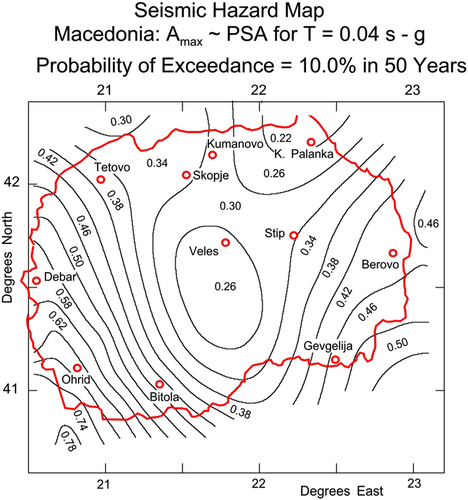
Another reason for presenting this study is related to the geological surroundings of Ohrid, which allows us to illustrate abrupt jumps in predicted amplitudes of shaking that are caused by large contrasts in the geological site conditions. The majority of published scaling equations for forecasting the amplitudes of strong ground motion ignore the role of the geological site conditions.4 Our equations do include the geological site conditions, and the old town of Ohrid, being situated on basement rocks surrounded by sediments, offers an excellent opportunity to show large amplitude contrasts that result from including the effects of site geology in seismic hazard mapping.
In addition to and beyond the above-stated goals, this paper can be viewed as an addition to the series of our papers in which we explore how best to use the Uniform Hazard Spectrum approach for mapping the spatial variations of seismic hazards. The subject is complex and requires the synthesis of contributions from many sources of different strengths and nature in time, space, amplitudes, and frequency. This includes realistic attenuation equations, dependence on the geology and soil site parameters, frequency-dependent attenuation of amplitudes, and realistic representation of the seismic activity surrounding the site.
Studies have shown that the spatial variations of earthquake damage are related to the properties of the local site conditions. To account for those, zoning maps have been proposed with coefficients that describe the variations in amplitudes of shaking and, hence, in the design forces used by engineers to construct earthquake-resistant structures.5-7 The equivalent horizontal earthquake force and the spectra for design are then increased or decreased according to the values of the coefficients in the hazard zoning maps.
Seismic zoning maps first appeared in the 1930s, in the former Soviet Union8 and in Japan.5 Based on observations, guidelines were developed for relative increase or decrease of the expected site intensities (and of the strong motion amplitudes) based on the site geology and surface soil.6, 9 The early seismic microzonation maps resembled maps showing the distribution of geological and soil deposits in the area.7, 10, 11 The maps were first based mainly on the site geology6, 7 and were later expanded to include the effects of the local soils.
The availability of direct empirical scaling of spectral amplitudes in the 1970s made it possible to formulate the seismic zoning maps in terms of the probabilities of earthquake occurrence, the spatial distributions of seismicity, the frequency-dependent attenuation of spectral amplitudes, and the local site conditions.3, 12-20 This made it possible to consider simultaneously all the factors that contribute to the end result. Comparisons with contemporary seismicity in southern California have confirmed the merits of this approach. For example, the seismic zoning maps based on the Uniform Hazard Method21, 22 published in 198723 for the Los Angeles metropolitan area have since not been contradicted by any earthquakes that occurred in the area since 1985.24, 25
When presenting the peak accelerations in Figure 1 at “rock soil” sites (i.e., for site class A) it is assumed that those can be modified to other soil site classes by analysis using some model that can describe the amplification of ground motion. However, as we noted previously, describing the site conditions only in terms of the surface soil in the top 30 m ( or A, B, C, and D, for example) does not lead to reliable results and should not be used.26 In the following, we will employ the description of site parameters describing the site geology (s = 0, 1, or 2) and the site soil properties that extend beyond 30 m depth of ( = 0 and 1).27
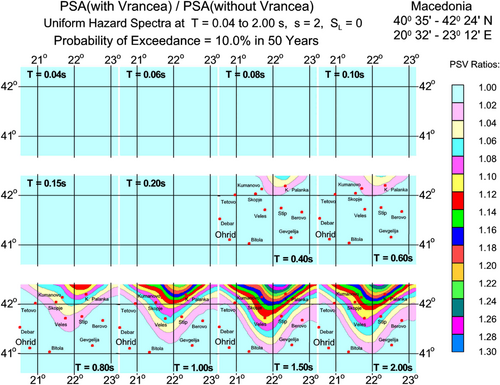
We have shown that large earthquakes in the Vrancea source zone in Romania contribute to seismic hazards in Serbia and Macedonia to a degree that depends on the distance to the Vrancea sources.28-31 Figure 3 shows the ratio of spectral accelerations for North Macedonia computed with and without contributions from the Vrancea earthquakes. It is seen that, at high frequencies (higher than about 2 Hz), the contribution from the Vrancea earthquakes can be neglected for all sites in Macedonia for p = 0.1 and 50 years. However, as the oscillator periods become longer, these contributions increase. At 0.7 Hz, in Skopje, the Vrancea earthquakes increase the spectral accelerations by about 13%. Figure 3 further shows that south and south-west of the line connecting Tetovo with Bitola, Gevgelija, and Berovo, at distances greater than about 600 km, the contribution to seismic hazard from the Vrancea earthquakes can be neglected (selected examples of distances from Vrancea are: Tetovo—645 km; Bitola—706 km; Gevgelija—638 km; Berovo—578 km). Therefore, in this paper, the contributions of the Vrancea earthquakes will not be included in the calculations of the microzonation maps for Ohrid.
2 GEOLOGY IN THE OHRID AREA
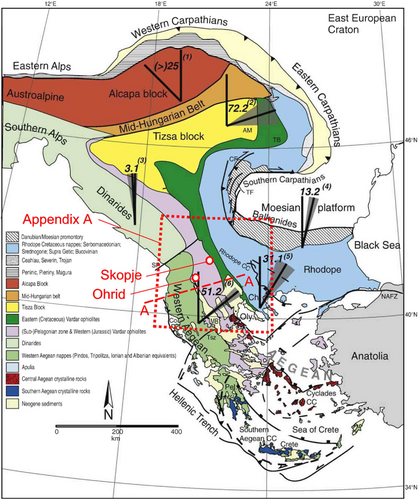
To describe the geology and tectonics of the area surrounding Ohrid, we begin with summarizing the model of the regional motions presented by van Hinsbergen et al.32 Their model is summarized in Figure 4. Between the Carpathian and Balkan orogenic systems is the Moesian Platform, a Precambrian basement block, which belongs to stable Europe and which they used as a reference for kinematic reconstructions during the Cenozoic. Around it, large block rotations, determined paleomagnetically, constrain and quantify the Cenozoic kinematics. To the north, in the Carpathian region, ~80° of clockwise rotations in the Tisza Block since the Oligocene have been interpreted to reflect its motion around the northwestern corner of the Moesian Platform during eastward roll-back of the Carpathian subducted slab. To the south, the entire area consisting of the western Aegean and Albanian regions rotated 50° clockwise (away from the Northern Rhodopes and the Moesian Platform) between ~15 and 8 Ma. This was interpreted by van Hinsbergen et al.32 to have resulted from a combination of the southward rollback of the African slab and the westward extrusion of Anatolia. These interpretations depend on the assumption that the Moesian Platform has not rotated during the movement of these domains. To date, paleomagnetic information from the Moesian Platform is incomplete but suggests some Cenozoic rotation. Recently acquired results from the Platform itself suggest a ~15° clockwise rotation during or after the early to mid-Eocene. Along the northern margin of the Moesian Platform, the basin sediments of the southern Carpathians, show a phase of 30° clockwise rotation between 13 and 6 Ma. This rotation is interpreted to relate to dextral shear associated with the eastward emplacement of the Tisza block, assuming the Moesian Platform did not rotate. The reader can peruse further details about this interpretation in the paper by van Hinsbergen et al.32
Lake Ohrid is located at the southwest corner of North Macedonia, at the border with east Albania and northwestern Greece. It is one of the oldest lakes in Europe, 30 km long and 15 km wide, and is surrounded by the Mokra Mountains to the west (1.514 m) and the Galičica Mountains to the east (2.265 m). The historical record of earthquakes and instrumental data show that the Ohrid area is tectonically active.
Ohrid Basin is a graben caused by an E–W extension, while the Korca and Erseka Basins are half-grabens bordered by a NW–SE trending normal fault on their eastern side. According to Hoffman et al.,33 sedimentation in the Ohrid Basin started in the Late Miocene with the formation of a pull-apart basin controlled by right-lateral strike-slip movements, with subsidence and extension accompanying the dynamic component since the Pliocene-Pleistocene. Hoffman et al.33 state that the oldest sediments in the lake are probably Pliocene Piskupstina and Solnje Formations, while today, sedimentation is likely to be compensated by subsidence.
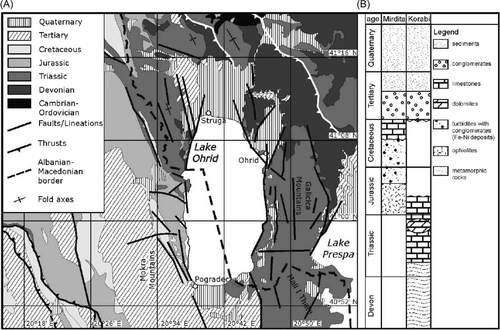
Ohrid Basin has active N–S trending normal faults, which may be associated with recent earthquakes (Figure 5). They trend mainly N–S in the west of the lake and N–S to NNE–SSW in the east. Sets of NW–SE and E–W lineaments are also present, probably related to the E–W extension of the basin. Between Ohrid and Prespa lakes, the Galičica mountain is separated from the Mali i Thatë Mountains in the south by a normal fault that cuts the mountain ridge. According to Hoffman et al.,33 recent slip rates are estimated to be not more than 2 mm/year.
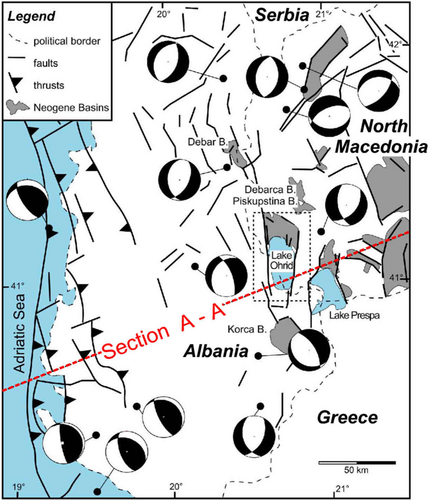
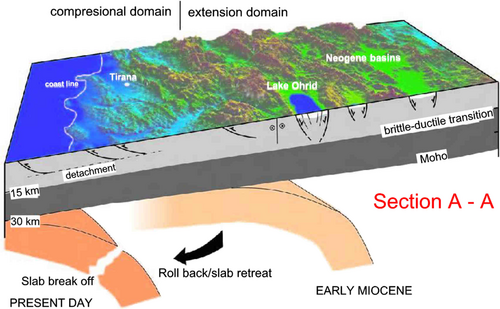
In 518 AD, an earthquake destroyed the cities of Ohrid and Skopje. Another strong earthquake in the area was reported by the historian Procopius (ca. 500–565 AD). Other events occurred in 548, 1673, 1871, 1889, 1896, and 1911. Instrumental data on seismicity surrounding Ohrid begin in the early 1900s. The strongest event took place on February 18, 1911, which had a magnitude of 6.6 and occurred in the Ohrid-Korca area at 15 km depth. The background seismicity in the Ohrid area is low compared with that in Greece, Western Albania, and the Eastern Macedonia-Bulgaria regions. The most recent events are the November 23, 2004, magnitude 5.4 earthquake in the Korca region (focal depth 20 km, normal faulting) and the September 6, 2009, magnitude 5.6 event in Albania. This earthquake occurred at a 2-km depth, had a normal faulting mechanism (Figure 5), and is a result of the E–W extension. Smaller recent events had shallow hypocenters, less than 25 km deep, while deeper events are rare. Most of the earthquakes are associated with the fault zones that border Ohrid Basin. The fault-plane solutions of the recent earthquakes generally agree with compression along the Albanian coast and normal faulting, which contribute to the extension inland (Figures 5 and 6). Hoffman et al.33 conclude that the N–S striking faults that border Lake Ohrid are the active elements today and that the regional extension is ongoing (Figure 7).
3 GEOLOGICAL SITE PARAMETER
The area selected for seismic hazard mapping in this paper (Figure 8) has been divided into rectangular 5 × 5 s cells between 41° 5′ 30″ N and 41° 8′ 30″ N and between 20° 46′ 15″ E and 20° 51′ 35″ E. For each of the 2304 cells, within a matrix having 64 columns and 36 rows, the site geology parameter was described by the predominant litho-stratigraphic formations and by their depths.

We used Trifunac and Brady's34 classification methodology and Dumardjanov, and Ivanovski,35 geological quadrant Ohrid K 34-102. We assigned the geological site parameter to each cell as either “basement rock” (s = 2), “alluvial and sedimentary deposits” (s = 0), or as “intermediate sites” (s = 1). The result is shown in Figure 8.
4 RESULTS
The seismicity model used for computing the hazard is presented in Appendix A. The scaling equations for pseudo-spectral velocities (PSV) for all calculations in this paper are from Lee.41 For each geographical cell, 5 × 5 s, with its geological site parameter (Figure 8), the UHS was calculated two times, for 0 (“rock” soil site) and for 1 (stiff soil site). The amplitudes of the UHS for PSV spectra in cm/s for a 5% damping ratio are shown for 0 in Figures 9A through E and for = 1 in Figures 10A through E. These figures describe the spatial distributions of PSV amplitudes for probabilities p = 0.01, 0.05, 0.10, 0.30, and 0.50 of being exceeded at least once during Y = 50 years of exposure.
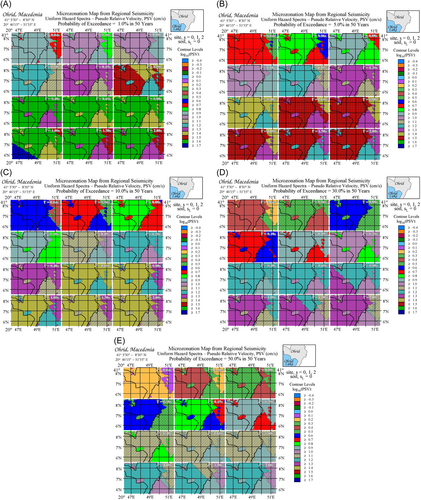
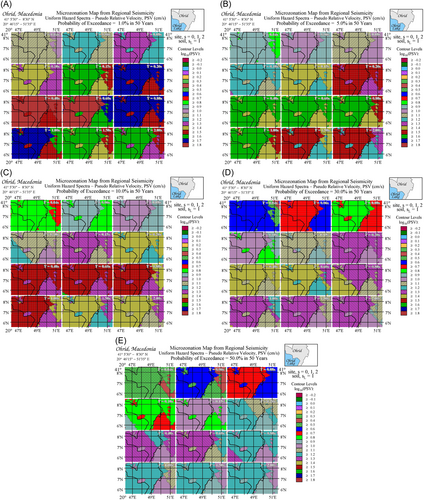
Figure 9A through E, and Figure 10A through E show the spatial variations of the PSV amplitudes. From these figures, the uniform hazard spectrum (UHS) of PSV amplitudes at a given location can be obtained by reading and plotting the spectral amplitudes at the corresponding latitude and longitude within the windows shown in these figures and connecting the point values to define a continuous spectrum. To reduce the consequences of discretization, those 12 spectral amplitudes finally need to be smoothed.
Figures 9 and 10 and all other figures in this paper present the UHS of PSV for horizontal motions. These can be converted to UHS spectra of vertical motions on a logarithmic scale by adding to the logarithms of UHS of horizontal motions at each of the 12 periods . The factor is given in Lee41 and in Table 1. On a linear amplitude scale, the vertical UHS amplitudes can be obtained by multiplication of horizontal UHS amplitudes by .
| (s) | 0.04 | 0.06 | 0.08 | 0.10 | 0.15 | 0.20 | 0.40 | 0.60 | 0.80 | 1.0 | 1.5 | 2.0 |
| −0.141 | −0.145 | −0.156 | −0.169 | −0.2 | −0.223 | −0.267 | −0.266 | −0.25 | −0.231 | −0.183 | −0.144 |
- Abbreviation: PSV, pseudo-spectral velocities.
Multiplying the spectra in Figures 9 and 10 by will produce uniform hazard amplitudes of the pseudo-absolute acceleration, , while dividing by will result in the UHS of relative displacement, SD, spectra. As the period of the oscillator approaches zero, , the acceleration spectra asymptotically approach from above the peak ground acceleration. Thus, multiplying all left-top quadrants in Figures 9 and 10 by will produce maps of peak ground accelerations for probabilities 0.01 through 0.5 of being exceeded at least once during 50 years of exposure. Thus, Figures 9A through 10E contain data convertible to maps of seismic microzonation of Ohrid in terms of peak ground acceleration for the regional distribution of site geology ( 0, 1 and 2), for soil sites = 0 and 1, and for 50 years exposure.
Figure 11A–D show the upper bounds for peak ground acceleration in Ohrid for a 10% probability of being exceeded, 10, and 50 years exposure and “rock” ( 0) and stiff ( 1) soil site conditions. The geological site parameter (Figure 8) is included in the hazard calculations. The spatial variations seen in these figures are dominated mainly by the distance to the seismic activity south of Ohrid and by the geological site parameters 0, 1, and 2.
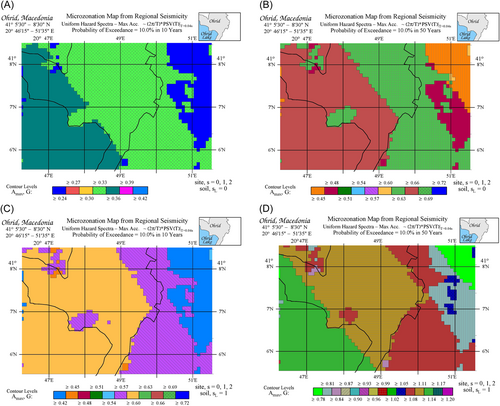
We note that the amplitudes of peak accelerations shown in Figure 11A–D are not sensitive to the distant earthquakes in the Vrancea source zone in Romania. This is because the high frequencies attenuate fast, and, when they reach Ohrid, their contribution is smaller than that from the local events. Figure 11A–D show that the peak accelerations are slightly larger on sediments ( 0) than on basement rock ( 2) for both “rock” soil sites ( 0) and for stiff soil sites ( 1). The spatial variations of the UHS amplitudes in these figures are small mainly because most of the city rests on sediment ( 0).
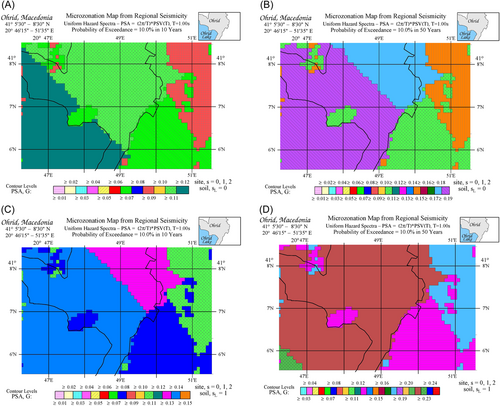
Figure 12A–D represent the corresponding pseudo-ground acceleration, PSA, around Ohrid at period 1.0 s, for 10% probability of being exceeded, 10 and 50 years exposure, and for “rock” ( = 0) and stiff ( = 1) soil site conditions.
5 EXAMPLES OF UHS AT FIVE SITES
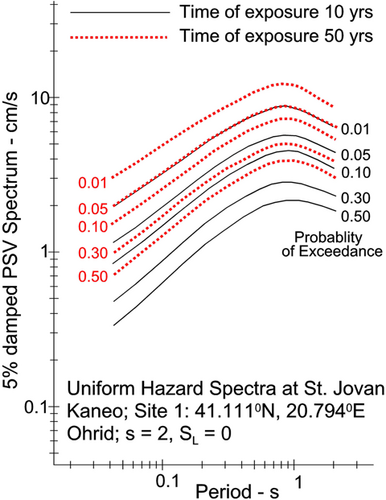
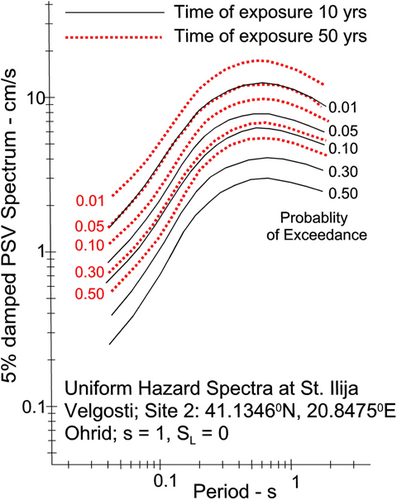
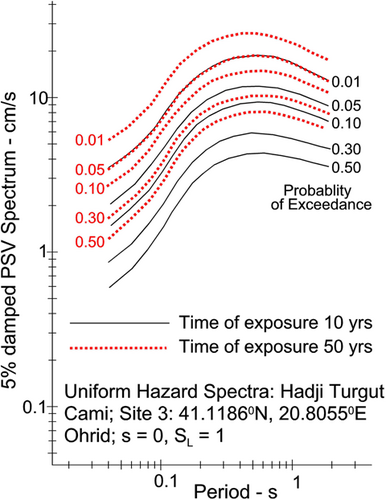
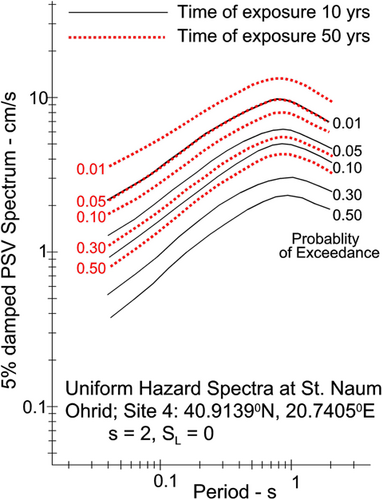
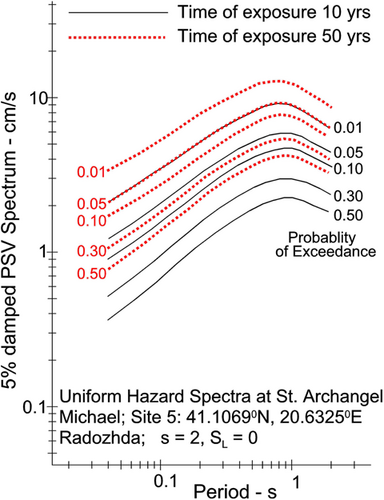
We calculated the uniform hazard spectra of PSV at three sites in the Ohrid area (Figure 8) and at two additional sites, one at the southern end of Lake Ohrid (#4 St Naum), and one on its western shore (#5 St Archangel Michael). Their coordinates and their geological and local soil site conditions are listed in Table 2. Figures 13-17 show the corresponding uniform hazard spectra. Site #1 through #3 are within the city of Ohrid, while Site#4 and Site#5 are close to but outside the city. In each figure, the black continuous curves show the UHS for probabilities p = 0.01, 0.05, 0.10, 0.30, and 0.50 of being exceeded in 10 years exposure, while the dotted red curves show the UHS for the same probabilities of exceedance during 50 years exposure. As expected, the UHS spectra for 50 years are higher than those for 10 years.
| Site # | Site name | Location | Geological site parameter | Soil condition parameter |
|---|---|---|---|---|
| 1 | St. Jovan Kaneo | 41.1111 N, 20.7944 E | ||
| 2 | St. Ilija Velgosti | 41.1336 N, 20.8475 E | ||
| 3 | Hadji Turgut Cami | 41.1186 N, 20.8055 E | ||
| 4 | St Naum | 40.9139 N, 20.7405 E | ||
| 5 | St. Archangel Michael | 41.1069 N, 20.6325 E |
- Abbreviations: PSV, pseudo-spectral velocities; UHS, uniform hazard spectrum.
6 DISCUSSION AND CONCLUSIONS
This paper is an addition to a series of our papers devoted to the seismic microzonation of cities. In contrast to the microzonation maps for Belgrade in Serbia30 and Skopje and Štip in Macedonia,2, 31 which were influenced to various degrees by contributions from azimuthally variable distributions of the local seismicity and large distant earthquakes in the Vrancea source zone in Romania, the principal variations in the microzonation maps for Ohrid result only from the local geological and soil site conditions. This finding is summarized in Figure 18, the top left quadrant of which compares UHS of PSV at the five sites around Lake Ohrid (Table 2), of which sites 1, 2, and 3 are in the city. The fact that the spatial variations on the scale of 30 km, caused by azimuthal variations of seismicity, are small can be seen from a comparison of UHS of PSV at sites 1, 4, and 5, which all have geological and soil site parameters 2 and 0. The spectra at sites 2 and 3 are different due to local amplification by the site conditions ( 1, 0 at site 2 and 0, 1 at site 3).
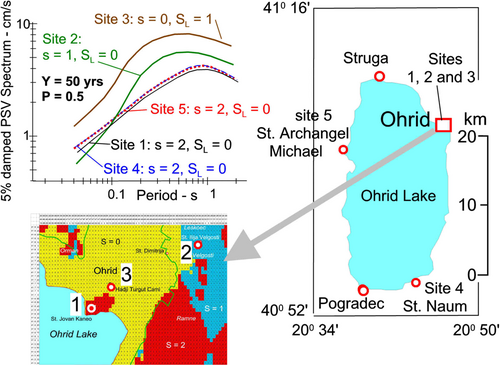
During the past four decades, we have emphasized the need to consider the geological site parameter in addition to the soil site parameter in all empirical scaling equations of strong motion amplitudes. The seismic microzonation of Ohrid is a perfect example demonstrating the importance of the geological site parameter , because the local seismicity variations are small (Figure A1) and the contribution from distant large earthquakes is also negligible (Figure 3).
ACKNOWLEDGMENTS
The seismicity model that is used in this paper (in Appendix A) is the same as the model we used previously in our work involving seismic hazard calculations in Macedonia28 and in seismic microzonation of Skopje.2 We thank Professors D. Herak and M. Herak for preparing this model and for their invaluable help and support in its implementation.
CONFLICTS OF INTEREST STATEMENT
The authors declare no conflicts of interest.
APPENDIX A: SEISMIC ACTIVITY AND SEISMICITY MODEL
To provide a background for the computations of the strong motion earthquake hazard in this paper, we briefly summarize the data on seismic activity surrounding Ohrid. The earthquake activity in the region is assumed to be well represented by a catalog compiled by M. Herak and D. Herak in 2017 (see Lee and colleagues2, 28, 31). For consistency with our previous work in North Macedonia, we employ the same catalog in this paper as not much has changed since this catalog was assembled in 2017.
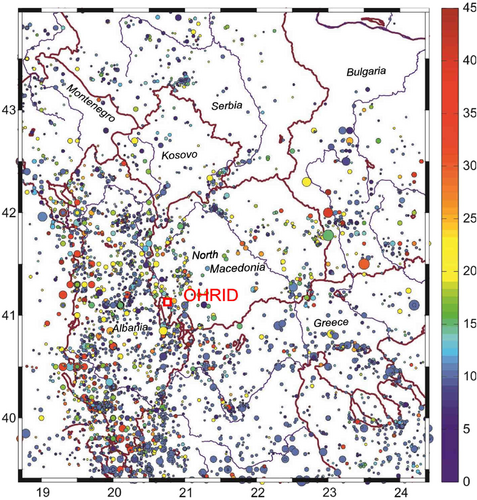
All magnitudes were converted to the moment magnitude, , using regionally adjusted correlations between , , or , and .36 The earthquake catalog was declustered using time-space windows the size of which depends on the mainshock's magnitude, as described, for example, in Herak et al.,37 thus removing dependent events (foreshocks and aftershocks). In the estimation of the recurrence parameters, only main shocks with a magnitude exceeding 3.4 were considered. Figure A1 shows the geographical distribution of the earthquake epicenters.
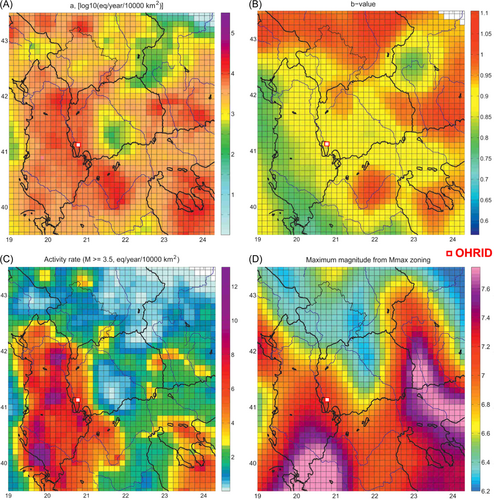
The seismicity of the region was modeled using a variant of the distributed smoothed seismicity approach (see Lee and colleagues2, 31). For the computations, the region is divided into a mosaic of rectangular cells (0.1° × 0.1°, or approximately 11.1 × 11.1 = 123 km2) and, for each cell, parameters and in Equation (A1), along with their uncertainties, are calculated taking into account the magnitude completeness thresholds. Parameter is estimated using the maximum-likelihood algorithm of Weichert,39 which considers only the earthquakes above their respective completeness thresholds within the smallest circle centered in each of the cells that holds at least 40 such events. The resulting spatial distribution of the value is shown in Figure A2. Parameter is assessed by counting the number of events , , within the circle that occurred after the corresponding onset of complete reporting. For each , is estimated using Equation (A1) and a representative a is obtained by taking the logarithm of the average. The seismicity rates thus obtained are normalized to 1 year and to an area of 10,000 km2. After the values have been assigned to each of the grid cells, the resulting spatial distribution is smoothed using a bivariate, normal-elliptical smoothing kernel (for an example see, Lapajne et al.,40). The seismicity model is then defined for each of the cells by the following parameters: geographical coordinates of the cell center, value, and its standard deviation, value, and its standard deviation, maximum moment magnitude, , average focal depth (km) and its standard deviation, the predominant strike of the seismogenic faults (°) and its standard deviation and predominant style of faulting (unknown, normal, reverse, strike-slip).
Our seismicity model is based on the past seismicity record. It does not explicitly consider the fault sources, as we feel that the necessary data on the positions of the seismogenic faults, their segmentation, geometry, quaternary activity rates, and so forth, are still far from being reliable and complete. Nevertheless, the model includes some of the fault-specific data (predominant strike, the style of faulting, and lengths of some known segments) when such data were available.


