Seismic microzoning of the Delhi metropolitan area, India—II: Hazard computation and zoning maps
Abstract
We present seismic microzonation maps of New Delhi, India, using the probabilistic seismic hazard analysis (PSHA) method with input seismic activity parameters estimated in Part-I of this two-part paper. Our calculations required three different attenuation equations for amplitude scaling of strong ground motion from three principal contributing sources: the National Capital Region (NCR), Northwestern Himalaya (NWH), and the Hindu Kush subduction (HKS). We show that uniform hazard spectral (UHS) amplitudes are dominated only by the local seismicity in the NCR at high frequencies beyond about 2 Hz. For intermediate and long periods, UHS amplitudes are dominated by contributions from the NWH and HKS earthquakes. Our results show that specifying strong motion amplitudes for use in engineering design by means of peak ground acceleration can lead to serious errors for buildings higher than four to five stories and hence should not be used. Our results also show that the shape of design spectra must depend on the nature of contributing earthquake sources, their relative activity, potential to create large magnitudes, and geographical placement relative to the site of interest, and thus a standard design-spectrum shape cannot satisfy all these requirements. We use local geological site condition parameters directly in all calculations and present hazard maps for three different soil site conditions (“rock,” stiff soil sites, and deep soil sites). Thus, the user can extract the UHS amplitudes of pseudo relative velocity spectra at any site in the National Capital Territory by experimentally determining the local soil site conditions and then applying the corresponding maps shown in this paper.
1 INTRODUCTION
The purpose of this paper is to show how a model of regional seismic activity can be used to formulate microzoning maps of the Delhi Metropolitan area and adjoining areas of the states of Haryana and the Uttar Pradesh in India. Our maps consider geological site characterization,1 path-dependent attenuation of spectral amplitudes from local events in the National Capital Region (NCR) of India,2 events in the western part of the Himalayan Plate Boundary region at distances exceeding 120 km,3 as well as deep events in the Hindu Kush subduction (HKS) zone at very long distances of around 1000 km.4 The methodology we use has been described in Lee et al.5-7 The scaling equations we use are those developed by Gupta and Trifunac,3, 4 while the method of seismicity description in Part I of the paper is similar to what has been reported in Lee et al.,8, 9 Lee and Trifunac,10, 11 and Gupta et al.12 Useful features of this methodology include the following: (1) the spatial variations of the geologic site conditions can be included directly in the calculation of spectral amplitudes for microzoning maps and, as will be subsequently shown, do significantly influence the final result; (2) the consequences from large, distant earthquakes contributions (in this case from western Himalaya and the Hindu Kush zones) can be included in unbiased way; and (3) the differences in attenuation of strong motion amplitudes caused by different geology along shallow- versus deep-wave propagation paths can be included explicitly.
Although the Delhi region has not experienced a damaging earthquake in the known past, the area is considered to be prone to high level of seismic hazard and the resulting risk due to large-scale urbanization, industrial development, and socio-political importance. During past two decades, several Indian researchers have therefore carried out seismic zoning studies for Delhi. All but one of these studies is focused on the peak ground accelerations (PGA) only—a parameter that does not relate well to the structural response. To highlight the major weaknesses of the existing studies and the need for yet another study, we briefly review them.
2 BRIEF REVIEW OF PAST STUDIES
Sharma et al.13 adopted a deterministic approach to generate a seismic zoning map of the Delhi region by computing the median PGA values for bedrock site conditions at a grid of sites spaced at 0.5° × 0.5° in latitude and longitude due to the maximum magnitudes from the nearest distance to six different faults in the region using GMPE due to Abrahamson and Liteheiser's.14 The maximum magnitude for each fault was estimated with a 20% probability of exceedance over 50 years using the mixed data-probability distribution given by Kijko and Sellevoll,15 which has been erroneously reported to be the probability of exceeding the PGA estimates during 50 years. The highest of the six PGA estimates obtained at each site from the six seismic sources was used to prepare the zoning map shown in figure 6 on page 2395 of their paper. The major limitations of this zoning map include unrealistic spatial distribution of the hazard due to very coarse site grids used, arbitrary selection of the GMPE, and neglecting uncertainty in the input seismicity. A following paper by Sharma et al.16 produced a zoning map of a limited part of Delhi by applying the amplification factors to the rock site PGA values. The amplification factors were estimated using Kanai's formula17 for a single layer over bedrock with several approximations and idealizations leading to physically unrealistic results.
Iyengar and Ghosh18 used the probabilistic seismic hazard analysis (PSHA) method to prepare a PGA map for the bedrock site condition of a 40 km × 30 km area of Delhi with a 2% probability of exceedance in 50 years as shown in figure 7 of their paper. They estimated the seismic activity rates from the past earthquake data in two large tectonic regimes of Himalaya and Delhi, but associated the entire activity in an unrealistic way with only the known faults in these regimes. The GMPE used was developed using PGA data from 61 records and from 9 earthquakes with the majority of data from the Himalayan region and northeast India and only a few from the Delhi region. Thus, the GMPE could not have been considered to represent the attenuation characteristics of the Delhi region. The authors computed the amplification factors at predominant frequencies with the available soil data at only 17 sites using the software SHAKE91 for sinusoidal excitation of unit amplitude as the incident motion at rock level, which cannot be considered to represent the PGA amplifications realistically.
Another study for seismic zoning of Delhi area in terms of rock site PGA estimates given by Agrawal, Chawla19 is also based on the PSHA approach in which the median PGA values were first computed at each site due to a limited number of past earthquakes in the region using four different GMPEs.14, 18, 20, 21 Assuming that the largest of these four values for all of the earthquakes follow a Poisson distribution, the authors then estimated the PGA value with a 10% probability of exceedance in 50 years to prepare the zoning map shown in figure 2A on page 1722 of their paper. Major limitations of this map include the use of the previous earthquakes in a literal manner, very coarse spacing of 0.5° for the sites, and arbitrarily selected GMPEs with their standard deviations not accounted for.
Mohanty et al.22 followed an altogether different approach to prepare a microzoning map of a limited part of Delhi by integrating five thematic maps compiled from the published literature for rock-site peak ground acceleration (PGA), soil types at 6 m depth, surface geology, groundwater fluctuation, and depth to bedrock using Saaty's23 analytical hierarchy process (AHP), which is basically a multicriteria, decision-making tool. The AHP was used to estimate the weight factor for each of the six parameters based on subjectively assigned relative scores as per its contribution to the seismic hazard compared to the other parameters in pairs with a score of unity relative to itself. The complete range of values taken by each parameter was next divided into several levels arranged in increasing order of contribution to the hazard and then normalized to values between 0 and 1. The weighted sum of the five parameters' normalized values at each location expressed as a percentage was finally used to generate the microzoning map of Delhi depicting areas of low, moderate, high, and very high hazards as shown in figure 6 on page 258 of their paper. However, such a map based on subjectively selected hazard categories cannot be considered to have much practical use. To be of better use in practical applications, seismic microzoning maps should be prepared directly in terms of the hazard parameters of engineering significance with the effects of all controlling parameters taken into account in the PSHA computation itself. To characterize the seismic hazard more comprehensively, it is possible to use the PSHA method for microzonation in terms of other natural earthquake effects, such as the peak strains in soil,24, 25 liquefaction potential,26 and permanent ground displacement.27, 28
The only microzonation study available for the Delhi National Capital Territory (NCT) in terms of uniform hazard spectrum (UHS) amplitudes was carried out by a multidisciplinary and multi-institutional working group, which was presented in a report for the National Center for Seismology (NCS),29 Ministry of Earth Sciences, New Delhi. This study first generated the bedrock (VS30 = 760 m/s)-level probabilistic zoning maps using computer code CRISIS (Version released in 2007), with the epistemic uncertainties modeled by considering two sets of seismic sources and three GMPEs. The first set of seismic sources comprised four area-type sources of spatially uniform seismicity, whereas the second set considered the total seismicity in each area source to be associated with a selected single fault in the source zone. The three GMPEs used are from Abrahamson and Silva,30 Sadigh et al.,31 and Boore and Atkinson.32 The bedrock-level uniform hazard response spectra at 449 sites throughout the NCT area at which detailed geotechnical investigations had been carried out to define the soil columns were used to generate compatible acceleration time-histories, which were then propagated to the surface using 1D shear wave propagation with an equivalent linear method of solution. The response spectra computed from the time-histories at the surface were finally used to prepare the microzoning maps for the NCT in terms of the spectral amplitudes at different natural periods for 10% and 2% probabilities of exceedance in 50 years. Typical examples of these maps are presented as Maps 23, 24, and 26–33 in the NCS report.29 However, the PSHA analysis as well as the site response analysis used to prepare these zoning maps suffer from major drawbacks in that the spatial distribution of the rock-level hazard is not realistic due to seismic sources of homogeneous seismicity, the suitability of the GMPEs used has not been tested against any recorded strong motion data in the region, and the site amplification factors obtained may have large variations from their true values due to approximations made in defining the soil columns and the limitations associated with the one-dimensional vertically propagating shear wave model used.
The NCS,29 report has also presented a qualitative hazard map using AHP to integrate seven thematic maps in terms of the peak ground acceleration at the surface, the site amplification factor, liquefaction potential, the engineering bedrock depth, the site classification based on VS30, predominant frequency, and the geology and geomorphology. However, due to the reasons already enumerated in response to Mohanty et al.'s22 zoning map, we do not consider such maps to have much practical use.
The common weaknesses of most existing studies are that (i) they use empirical scaling equations not based on strong motion recordings in India, and hence are inconsistent with local geological effects on attenuation and ignore regional biases in earthquake magnitude determination; (ii) work only with the PGA, which, when combined with spectral shapes in design codes, give biased design amplitudes at intermediate and long periods of vibration; (iii) completely ignore the effects of geological site conditions and use soil site condition parameter , which has been demonstrated to be a statistically insignificant proxy for a site parameter meant to characterize local site amplification.33
The present study has developed improved high-resolution microzoning maps of the Delhi NCT and adjacent areas using refined input seismicity by updating the earthquake catalog and improving the smoothing process to normalize for the uncertainty in defining the seismic source-zone boundaries as described in Part-I of the paper. Further, the local geological and site soil conditions effects are considered directly in the PSHA computations to prepare large number of microzoning maps in terms of the pseudo spectrum velocity amplitudes at natural periods for several different probabilities of exceedance over the next 50 years. Finally, more realistic zoning maps are obtained by using three different region-specific ground motion attenuation relations developed using the strong motion data recorded from local NCR earthquakes, earthquakes in western Himalaya recorded in the Himalaya and adjacent alluvial plains, and the HKS-zone earthquakes recorded in western Himalaya.
3 LOCAL GEOLOGY
More than 75% of the terrain in the Delhi metropolitan area is generally flat, comprising varying thickness of alluvium. The remaining area shows exposed rocks of the Pre-Cambrian period in the form of NNE–SSW trending low-height ridges and plateaus, known as the Delhi fold belt. The quaternary alluvium is deposited unconformably over the Pre-Cambrian rocks. The alluvium thickness increases as one moves away from the outcrops, which may cause significant spatial variation in the ground motion amplification.
A detailed geological map of the Delhi metropolitan area on a 1:50K scale as downloaded from the official website of the Geological Survey of India (https://bhukosh.gsi.gov.in/Bhukosh/Public) is shown Figure 1. Geological formations exposed in the area belong to the Pre-Cambrian and the Quaternary periods with no rock formations of the intervening period,34 because the region has been subjected to subaerial erosion since its evolution in the late Pre-Cambrian times. The Pre-Cambrian rocks exposed in the region are the Alwar series of the Delhi Super group.22, 35 The rock formations exposed within and to the immediate south of the NCT comprise metamorphic rocks such as phyllite, slate, quartzite, and schist, whereas the major rock formations to the further south comprise igneous rocks such as pegmatite, granite, and granite gneiss. These rocks occur in the NNE–SSW trending narrow range of low lying hills, ridges and plateaus, which are probably the remnants of a major folded structure. The rest of the terrain is generally flat and comprises varying thickness of older (Late Pleistocene) and younger (Holocene) alluvium, which lies unconformably over the Pre-Cambrian rocks.22
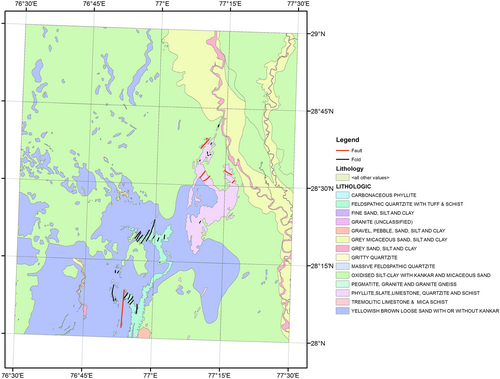
The younger alluvium is confined to the flood plains of the Yamuna River and mainly comprises a gray micaceous medium to fine-grained sand, which is an intercalation of silt and clay with fine nodular kankar. The gently undulatory terrain on either side of the rocky surface is described as older alluvium plain, which mainly consists of yellowish brown, occasionally white micaceous, medium to fine sand, silt, silty clay, clay and kankar. The kankar occurs both in the form of bedded deposits and as sporadic nodular lenses.36 The thickness of alluvial deposits is less than 100 m in the vicinity of the ridges and the outcrops, but increases up to about 1 km as one is further away.
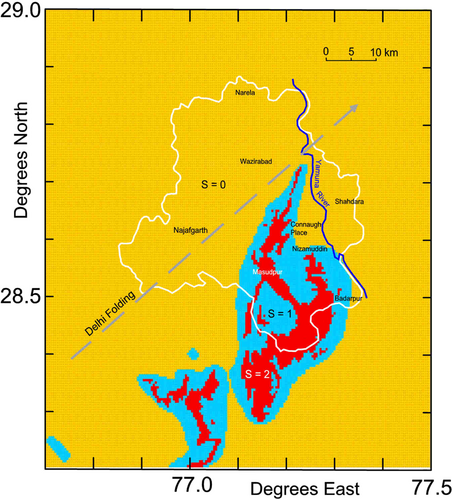
Figure 2 shows the distribution of geological site parameters in rectangular area 76.7°–77.5° east and 28.2°–29.0° north, within which all the microzonation hazard maps will be shown in this paper. The width and height of this recangle are divided into 192 intervals each corresponding to a rectangular cell 15″ × 15″ or 0.463 km NS and 0.407 km EW, with area of 0.188 km². We assigned geological site parameters to each cell following the site classification adopted in Trifunac and Brady37 and described in Trifunac.1
4 EMPIRICAL SCALING EQUATIONS
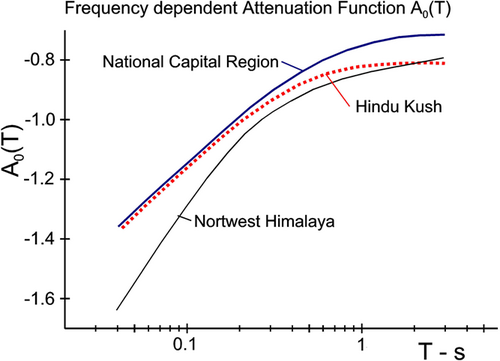
Here, represents the expected value of the pseudo-relative velocity spectral amplitude at a natural period of the structure for a specific damping ratio , denotes the earthquake magnitude, denotes the component of motion ( 0 for horizontal and 1 for vertical component), denotes the site geology parameter ( 0 for alluvium, 1 for intermediate sites, and 2 for basement rock sites), and , , and are variables taking on the value of 1 for the site soil parameters = 0, 1, and 2 representing “rock soil,” stiff soil, deep soil, respectively, and zero otherwise. The coefficients , , , , , , , and are smoothed values of the period-dependent scaling functions. The values of these scaling coefficients for the NCR are found in Gupta and Trifunac2 for the western Himalaya region in Gupta and Trifunac3 and the Hindu Kush earthquakes in Gupta and Trifunac,4 and are given at 13 periods between 0.04 and 3.0 s and for five fractions of critical damping in the tables in these papers.
The coefficient in Equation (1) is multiplied by , which is 0 for horizontal components of motion and 1 for vertical components of ground motion. Since all results in this paper are presented for horizontal motions only, one simply adds to or for the linear-scale multiplies by to convert to the vertical-motion results.
Contributions to strong motion hazard in New Delhi from earthquakes in the Hindu Kush source volume occur at distances around 1000 km. Thus, such a large distance is unusual for any analysis of seismic microzonation, and the recorded strong motion is also rarely available at such large distances. To demonstrate that our scaling equation for HKS events works at these large distances, in Figure 4, we show a comparison of recorded and predicted PSV amplitudes at three stations: Chamoli, Dhanaulti, and Roorkee at distances of 1010, 940, and 966 km, respectively.

5 UNIFORM HAZARD METHOD
The computer program used for the calculations in this paper, “India Delhi EQRISK,” is the most recent PC version of the38, 39 program, EQRISK. The program has been continuously upgraded and generalized over the past four decades28, 40 and is at present in version 90 Fortran running on Windows 10. The program can distinguish three different attenuations and different scaling equations of shallow and deep sources. The new program comprises four steps: Step 1: Read all earthquake events from the National Captal Region (NCR) of India, divide them into discrete sets of equal (similar) hypocentral distances, and apply the NCR attenuation function and scaling equations to compute , which is the expected number of times that a spectral amplitude will be exceeded at the site in Y years, and the corresponding recurrence time . Step 2: Repeat Step 1 for all earthquake events from the Northwest Himalaya (NWH) region to compute using the NWH attenuation and the corresponding recurrence time . Step 3. Repeat Step 2 for all earthquake events from the Hindu Kush (HKS) region to compute using the HKS attenuation and the corresponding recurrence time . Step 4: Combine Steps 1, 2, and 3 to find the total number of the expected number of times that some spectral amplitude will be exceeded at the site in Y years from each of the following zones and the corresponding recurrence time —namely seismic risk from each of the following combinations of cases: NCR, NWH, HKS, NCR + NWH, NCR + HKS, and NCR + NWH + HKS.
In the examples presented in this paper, all sources in the region contributing to the hazard are assumed to follow a Poisson sequence in time. As in all previous versions of EQRISK, the program can take a combination of events, some of which are Poissonian in time and some that occur with certainty (e.g., a prediction by a committee of experts), and can also include events that have time-dependent occurrence rates (e.g., when seismic sources include identified characteristic events). In the examples in this paper, we will not consider such cases, but we note that this is an available alternate option for more advanced site-specific modeling. This option also means that if an earthquake prediction is made, one can use the probabilistic hazard calculations and existing microzonation maps to evaluate the impact of such a prediction and determine whether and by how much such a prediction may change the results based only on the Poisson process, for example.
6 RESULTS
For each cell, 15 × 15 s (0.463 × 0.407 km²), with specified geological site parameter (see Figure 2), the UHS was calculated three times, for soil site conditions = 0, = 1 and = 2. Interpolated UHS amplitudes for pseudo relative velocity (PSV) spectra in cm/s for a damping ratio of 5% at 13 periods, = 0.04, 0.06, 0.08, 0.10, 0.15, 0.20, 0.40, 0.60, 0.80, 1.00, 1.50, 2.0, and 3.0 s are shown in Figures 5A through 5F for = 0; in Figures 6A through 6F for = 1; and in Figures 7A through 7F for = 2 for distribution of geological site parameters (Figure 2) included in all calculations. Figures describe the spatial distributions of PSV amplitudes in the Delhi Metropolitan area for six probabilities of at least one exceedance, p = 0.01, 0.02, 0.05, 0.10, 0.30, and 0.50 during an exposure period of = 50 years.
Figures 5, 6, and 7A-F show spatial distributions of PSV amplitudes. To compute the UHS of PSV amplitudes at a desired location, one reads the spectral amplitudes at the selected latitude and longitude coordinates within the 13 windows shown in each of these figures, plots the 13 values read, and then connects those to define the continuous spectrum. This gives the desired UHS amplitudes. Figures 5-7 give the UHS of PSV for horizontal motions. The UHS of PSV for vertical motion can be obtained by multiplying the PSV for horizontal motion with the factors , where , at different natural periods , for a damping ratio of 5%. can be taken from table 4.3 in Gupta and Trifunac3 or table B.3 in Gupta and Trifunac.4 The use of such multiplication factors to obtain the spectra of vertical motions has been described in more detail in Lee et al.6 and in Lee.41 This procedure is also identical to the one described by Lee and Trifunac42 for constructing the microzonation maps in the Los Angeles, California, metropolitan area. The same procedure has been used also for the calculation of the UHS and construction of seismic hazard maps in Bosnia and Herzegovina,5, 7 Macedonia,10 and Serbia11), and in microzonation maps of cities like Banja Luka,43 Belgrade,8 Skopje,9 Stip,44 and Kraljevo.45
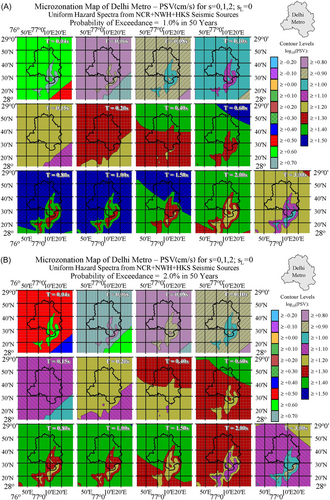
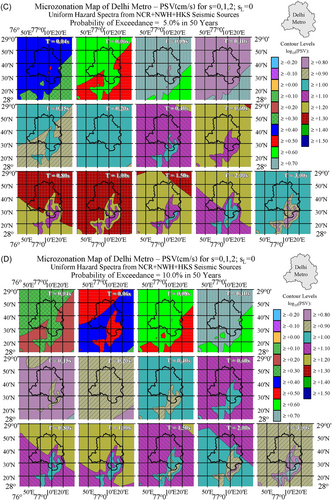
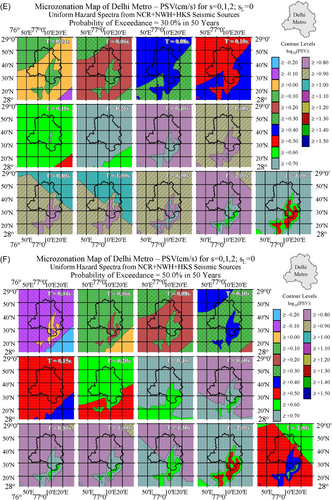
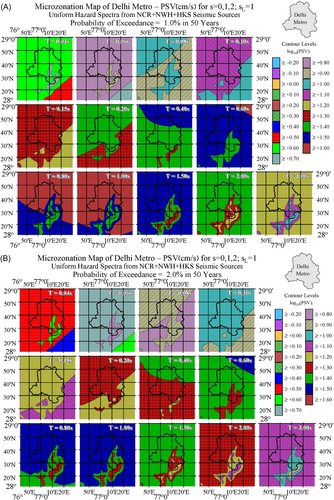
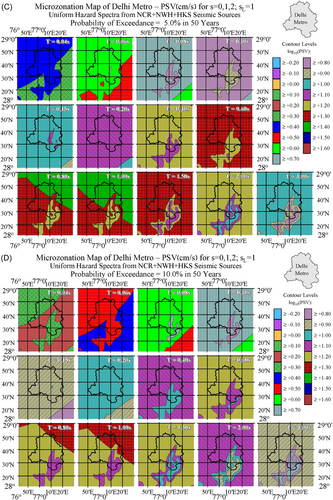
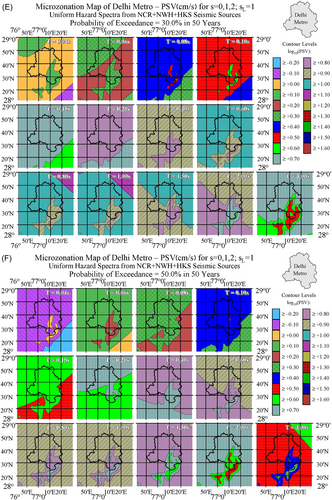
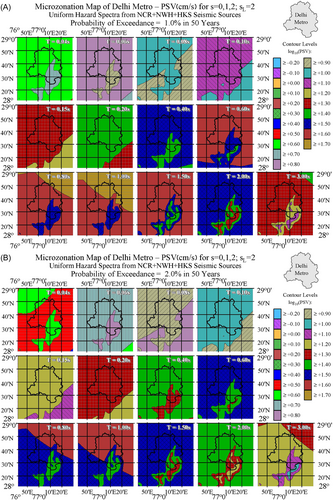
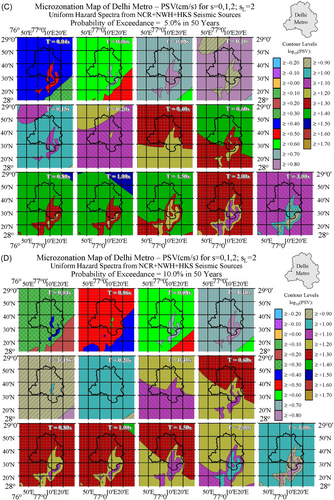
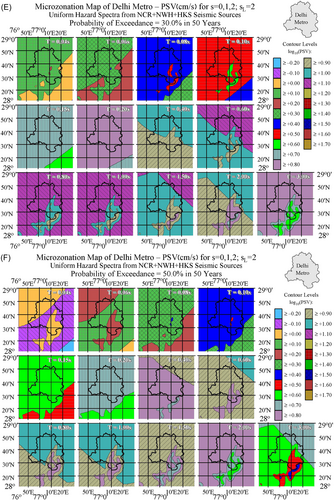
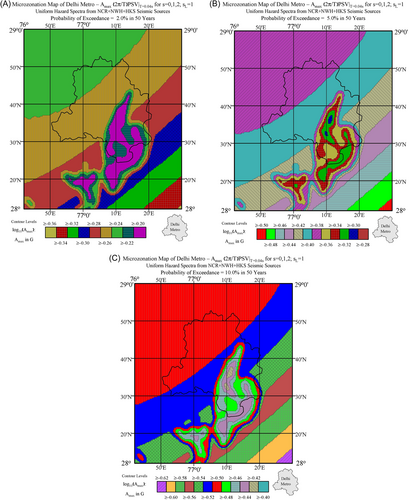
Multiplying the spectra in Figures 5A–F through 7A–F by will produce UHS of pseudo absolute acceleration (PSA) while dividing the spectra by will result in the UHS of relative displacement spectra (SD). As the period of oscillator approaches zero, , acceleration spectra asymptotically approach from above the peak ground acceleration. Thus, multiplying all left top quadrants in Figures 5A–F through 7A–F by will produce maps of peak ground accelerations for probabilities 0.01 through 0.50 (P = 1% through 50%) of being exceeded at least once, during the exposure time of Y = 50 years. Thus Figures 5A–F through 7A–F contain also the maps of seismic microzonation of the Delhi Metropolitan area in terms of peak ground acceleration for the corresponding probabilities of exceedance, for the regional distribution of site geology ( = 0, 1, and 2), for soil sites = 0, 1, and 2, and for exposure time of Y = 50 years.
We next show examples of such microzonation maps of peak ground acceleration. For in cm/s, will be in cm/s2. It is customary to scale in units of g by diving by 980.665 cm/s2. Plots of peak ground acceleration for probabilities P = 2%, 5% and 10% of exceedance in 50 years at are shown in Figure 8A–C.
7 CONTRIBUTION OF NWH AND HKS SEISMICITIES TO THE SEISMIC HAZARD IN DELHI METRO
Calculations of the seismic hazard for Delhi Metropolitan area include contributions from earthquakes in the NCR, from the NWH, and from the HKS zone. This requires the use of three different attenuation equations in computation of UHS amplitudes.
Figure 9A,B show the PSV ratios for the above two cases at 13 periods, with ; the probability of at least one exceedance from exposure to earthquake shaking during years; the variations due to the geological site parameter ; and the soil parameter is . The cases for other soil parameters , show similar trends and are not shown here.
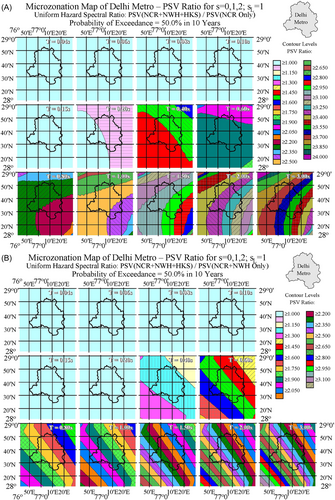
The PSV ratios in Figure 9A are in the 1–4 range. It is seen that for the short periods s (frequencies ), the PSV ratio is at or close to 1. This means that the UHS at those periods are dominated by the earthquakes from the NCR. As the periods become longer, the ratio increases to ≥2.05 at intermediate period of s, beyond which the ratio further increases to ≥4.0 at period s and beyond.
To further explore which source region contributes more to the intermediate and long periods of the spectral amplitudes, we consider the 2nd ratio: PSV(NCR + NWH + HKS)/PSV (NCR + NWH only) (Figure 9B). The amplitudes are now in the range between 1.0 and 3.5. It is again noted that for short periods s, the PSV ratio is at or close to 1.0. Near s, the PSV ratio is in the range of >1.075 to <1.375. Again, the UHS at those period ranges are dominated by contributions from earthquakes in the NCR. As the period increases, the ratio increases from 1.375 to <1.75 at intermediate periods near s to s, beyond which the ratio increases to ≥2.80 to 3.10 at period s and beyond. This shows that excluding the earthquake contribution from the HKS, the UHS in Delhi would decrease by a factor of up to and above 2.80 at long periods.
Figure 10A,B are similar to Figure 9A,B but present the ratios for exposure during years. Figure 10A for the ratio PSV(NCR + NWH + HKS)/PSV (NCR only) shows that the maximum ratio is ~3.40 versus that of ~4.00 in Figure 9A. Figure 10B shows that the maximum ratio is ~2.75 versus that at ~3.10 in Figure 9B.

8 EXAMPLES OF UHS AT THREE SITES IN DELHI METROPLITAN AREA
- (1)
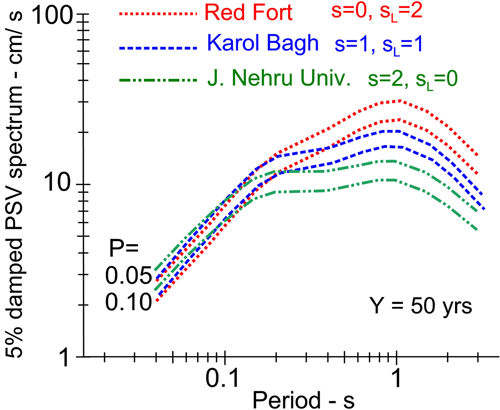
Delhi Metro Site 1: 28.6562° N, 77.2410° E Red Fort, s = 0, sL = 2
- (2)
Delhi Metro Site 2: 28.6550° N, 77.1888° E, Karol Bagh, s = 1, sL = 1
- (3)
Delhi Metro Site 3: 28.5402° N, 77.1662° E, Jawaharlal Nehru University, s = 2, sL = 0.
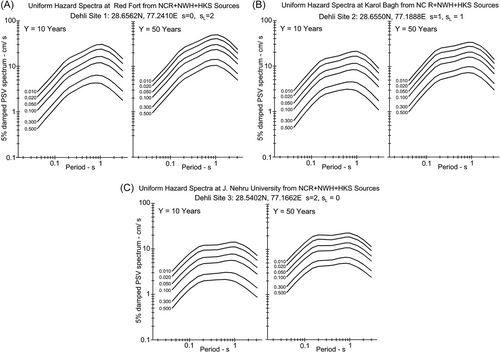
Figure 11A–C show the UHS at these three sites for exposure periods of Y = 10 and Y = 50 years. Each figure shows the UHS for shaking contributions from the NCR, NWH, and HKS seismic sources. Each plot shows five curves for five probabilities of exceedances p = 0.01, 0.02, 0.05, 0.30, and 0.50. All figures show a change in spectral shapes starting near 0.2 s and then a slower rate of growth beyond. For short periods, the spectra from the NCR earthquakes dominate and the contributions from NWH and HKS zones are small. This trend begins to change near 0.2 s and the resulting UHS amplitudes at longer periods are dominated by contributions from the NWH and HKS source zones. This transition is illustrated in Figure 12 for the Red Fort site and only for p = 0.01 and 0.5 and exposure period of Y = 50 years. Together with Figures 9A,B and 10A,B it further illustrates that the seismic hazard in Delhi is dominated by the earthquakes in the NCR seismic zone when periods are shorter than about 0.2 s. At intermediate and long periods, the UHS amplitudes are dominated by NWH and HKS seismic sources.
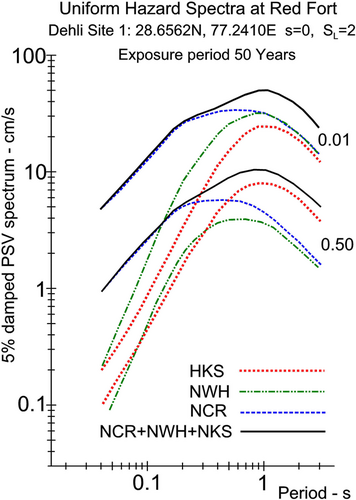
This result in Figures 9 and 12 is similar to what was found for seismic hazard mapping in Guwahati, India,12 where the UHS was influenced by the earthquakes from both Northeast India and the Burmese subduction zone.46 It was found that the contribution from the Burmese events is small at short periods, but gradually increases for longer periods of motion.
This result is also similar to what was found for seismic hazard mapping in Serbia, where we calculate the UHS for contributions from local seismicity and from distant large earthquakes in the Vrancea source zone.10, 11 All of these examples show that the design spectra computation for intermediate and tall buildings, based on the classical approach with standard spectral shapes anchored to peak ground motion as well as determined deterministically or probabilistically, can be seriously underestimated because of the frequency dependent rates of attenuation of short versus long periods of motion.
Figure 13 illustrates how spectral shapes and amplitudes vary over short separation distances, due to different geological and soil site conditions. At high frequencies, spectral amplitudes are similar with peak accelerations varying only from 0.40 g (Red Fort) to 0.48 g (J.N.U.) for Y = 50 years and p = 0.50. Beyond 0.2 s, the spectral shapes and amplitudes begin to differ appreciably, reaching factors of 3 near T = 1 s. These differences are dominated by the changes in the geological site conditions ( = 2 at geological basement rocks to = 0 for sites on sediments).
9 CONCLUSIONS
Spatial variations in the shape and amplitudes of microzonation maps are complex functions of many contributing factors. The dominant factors include (1) the nature, size, distance, and azimuthal distribution of contributing seismic sources, (2) differences in the attenuation of wave amplitudes that propagate along different geological materials along their path, (3) the role of the local geological and soil site conditions in the amplification of incident seismic waves, (4) selection of the governing scaling parameters (e.g., peak ground acceleration vs. direct scaling of spectral amplitudes), and (5) selection of temporal models to represent the occurrence rate of seismicity in time (Poissonian, renewal models with lognormal distribution, deterministic scenarios, predictions, and so forth.). In this paper we illustrated how three different seismic source regions, with different attenuation of spectral amplitudes contribute to the seismic microzonation maps of Delhi.
Early seismic microzonation methods have included explicit dependence of site amplification on the local geological site conditions,47-50 and as can be seen from Equation (3) we also included these conditions in all calculations presented in this paper. The way we have described geological site conditions in the empirical scaling of strong motion amplitudes has been consistent in all of our past studies since the 1970s.51-54 However, this approach is not common, as the majority of geotechnical and engineering papers have consistently ignored the geological site conditions and have used only the shallow soil properties, , as a proxy for site amplification regardless of the fact that this measurement is not statistically significant.1, 33
Another important lesson, again clearly shown by the results of this paper, is that although the scaling of spectral amplitudes by standard design-spectrum shapes anchored to peak ground acceleration might be tolerated for one-or-two story buildings, it leads to erroneous predictions of design forces at intermediate and long periods. This is because seismic hazard analyses based on scaling with peak ground acceleration depend only on the local seismicity and cannot detect intermediate- and long-period spectral amplitudes from large distant earthquakes. At what period range this information becomes important depends on the size and distance to the large contributing events. In the case of seismic microzonation of the Delhi metropolitan region, this occurs near T = 0.2 s. We have already noted this problem with scaling design ground motions in several previous studies,10, 11 but it is also clearly shown by the results in this paper.
ACKNOWLEDGMENT
We are indebted to B. Bulajić for his help with preparing the map of geological site parameters s in Figure 2.
CONFLICTS OF INTEREST
The authors declare no conflicts of interest.


