Switching Optimally Balanced Fe–N Interaction Enables Extremely Stable Energy Storage
Abstract
The interaction between electrode materials and charge carriers is one of the central issues dominating underlying energy storage mechanisms. To address the notoriously significant volume changes accompanying intercalation or formation of alloy/compounds, we aim to introduce and utilize a weak, reversible Fe–N interaction during the (de)intercalation of ammonium ions (NH4+) within iron(III) hexacyanoferrate (FeHCF), inspired by manipulating the electrostatic adsorption between N and Fe in the early stages of ammonia synthesis (Bosch-Harber Process, Chemical Engineering) and steel nitriding processes (Metal Industry). Such strategy of switching well-balanced Fe–N interaction is confirmed in between the nitrogen of ammonium ions and high-spin Fe in FeHCF, as observed by using X-ray absorption spectroscopy. The resulting material provided an extremely stable energy storage (58 mAh g−1 after 10 000 cycles at current density of 1 A g−1) as well as high-rate performance (23.6 mAh g−1 at current density of 10 A g−1).
1 Introduction
For an electrochemical energy storage (EES) device, such as a battery or supercapacitor, there are a variety of interactions between charge carriers and electrode materials.[1-8] These are essentially controlled by some types of reversible chemical bonding,[9] such as redox processes, alloying/decomposition/conversion reactions, and the intercalation mechanism. They typically follow Faraday's law, and a charge transfer reaction usually occurs at the electrochemical interfaces.[10, 11] Those mobile ions or molecules diffuse rapidly in and out of the space between adjacent layers or octahedral/tetrahedral positions in host materials.[12] accompanied by the same amount of electrons entering into the available d-orbits of transition metal cations.[13]
Due to the relative scarcity of lithium and diminishing returns on materials research in this area,[14, 15] the chemistry of alternative alkali metal or nonmetallic ion intercalation attracts renewed attention.[16, 17] However, ions with larger ionic radii (e.g., Na+ = 1.02 Å, K+ = 1.38 Å, NH4+ = 1.48 Å, Cl− = 1.81 Å) lead to a larger lattice distortion during (de)intercalation, which can significantly restrict the life span of the EES system[18] Consequently, it is of great interest to find approaches at the chemical bonding level to alleviate or mitigate lattice expansion (as opposed to traditional than compositional or architecture tunning,[19] such as conversion reaction based on our proposed diffusionless transformation[20]) in order to unlock the potential of extremely stable EES devices—although doing so remains a great challenge.
In contrast to the neglectable electron transfer between metallic ions/electrode, it is the covalent ionic bonds that follows the principle of donor–acceptor between the nonmetallic ions/electrode.[1, 21] This scenario inspired us to examine the possibility of tailoring a force acting in opposition to that exerted by intercalation—helping to mitigate volume expansion.
Sustainable and readily available NH4+ represents an attractive electrolyte candidate for this work, as it offers a light relative molecular mass (18 g mol−1) and the smaller ion/hydrated ion (1.48, 3.31 Å).[1, 22-34] When considering a suitable electrode counterpart, it is posited that the ideal choice of metal (M) should preferentially offer a tunable M–N (from NH4+) interaction, as well as being an environmentally friendly and readily abundant element. Among those well-known miscellaneous interactions, iron (Fe) offers a degree of flexibility as it is capable of not only the ammonization from ammonia reaction[35, 36] but also nitriding of steel,[37, 38] as shown in Figure 1. It should be noted that the activation of nitrogen is very sensitive to the electron density of metal active sites and the surface band bending of semiconductors.[39] Since the strong bonds will hinder the deintercalation of the working ions, we target the electrostatic attraction between the nitrogen and electrode for exploitation.[40] Materials benefiting from such a tunable method (in order to obtain a long cycling life by bypassing the notorious lattice expansion) during architectural selection demonstrate that a tunable Fe–N interaction can offer a promising design descriptor.
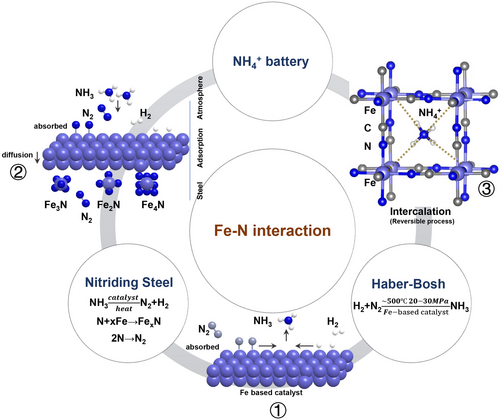
As a member of the Prussian blue analogs (PBAs) family, an iron(III) hexacyanoferrate (FeHCF) electrode can effectively store various ions[41] due to very large A sites with dimensions of ~1.6 Å and channel spacing of ~3.2 Å in the <100> direction. Moreover, FeHCF offers a typical reaction mechanism of (de)intercalation via the change in transition metal (TM) valance state.[42, 43] The ion insertion enables a slight shift toward Fe2+ (the TM position).[44-46] As described in ③ of Figure 1, such a weak Fe–N interaction triggers a reversible interaction between the charge carrier and electrode.
Herein, we demonstrate a proof-of-concept system to validate the exploitation of reversible Fe–N interactions dominating the aqueous ammonium ion battery, via the use of FeHCF as an electrode material. This remains an area ripe for exploration as the subtleties of delocalized electrons interacting between nonmetallic ions and electrode materials, and the resulting effects on our electrode analogs (and even many other systems) has yet to be thoroughly explored.[1] Rather than pursue further significant modification of electrode materials in order to target improving the performance,[24, 26-29, 47-53] we choose instead to explore the underlying dynamic chemistry architecture using a variety of characterization techniques in order to provide a foundation for future design optimization. Ultimately, we propose that the Fe–N interaction enables reduction of the lattice distortion caused by ammonium ion (de)intercalation, thereby enabling the material to achieve excellent rate capability and long-term cyclability over 10 000 cycles (58 mAh g−1 with ~94% capacity retention at current density of 1 A g−1), as of the occurrence under only one electron transfer. On this basis, we also assembled two full batteries, copper hexacyanoferrate (CuHCF)//FeHCF and FeHCF//MoO3. It can also offer an energy density of 33 Wh kg−1 and 34.8 Wh kg−1 at current density of 0.2 A g−1 and 15 mA g−1, respectively. This proves that it is possible to assemble a full battery using ammonium ion as charge carrier. Moreover, such positive properties resulting from the delicate tuning of chemical bonding has considerable implications with respect to electrode material design principles—potentially leading to further extension and development of novel systems able to support a wide range of new EES devices.
2 Results and Discussion
Iron(III) hexacyanoferrate (FeHCF) and nonoptimized sample (p-FeHCF) were synthesized via a simple hydrothermal method.[26, 54] The peaks of the X-ray diffraction (XRD) pattern are well-indexed as a FCC phase (52-1907, space group Fmm, a = b = c = 10.22 Å, α = β = γ = 90°) (Figure 2a and Figure S1a, Supporting Information).[26, 54, 55] The confirmed material structural model is shown in Figure 2b, and is consistent with the SAED (inset of Figure 2c). There are four peaks in the Fourier transform infrared spectroscopy (FTIR), as shown in Figure 2c—the peaks of 2060 and 2160 cm−1 are attributed to the vibrations of the cyanide groups of FeII-CN-FeIII and FeIII-CN-FeIII,[26, 56, 57] while those at 1610 and 3625 cm−1 are ascribed to the crystal water in FeHCF, and denoted as δ(O–H) and ν(O–H), respectively.[58] X-ray photoelectron spectroscopy (XPS) (Figure 2d) shows the existence of both Fe2+ and Fe3+. From this, it shows that some Fe3+ appears to be coordinated with nitrogen, while a mixture of Fe2+ and Fe3+ is coordinated with carbon;[26] it is believed that it is the strong oxidation capability of FeIII[FeIII(CN)6] that leads to the occurrence of Fe2+.[26] The EDS elemental mapping demonstrates a uniform distribution of Fe, N, and C elements (Figure 2e). In addition, thermogravimetric analysis (TGA) shows that the content of crystal water is only 10%—less than the nonoptimized sample of p-FeHCF without chelating agent, as shown in Figure S1b, Supporting Information. Thus, FeHCF may be described with the stoichiometry of FeIII/II[FeIII(CN)6]·□y·1.65 H2O (□ represents Fe(CN)6 vacancies). Besides (as deduced from FTIR, and XPS analysis), FeHCF and p-FeHCF are predominantly the same (Figures S1c,d, Supporting Information) except for crystal water. However, what has changed includes the morphological changes from the amorphous to nested square (Figure S1f, Supporting Information) and the increase in particle size (Figure S2, Supporting Information) and specific surface area (from 15.96 to 116.42 m2 g−1, Figure S1e, Supporting Information). Moreover, due to the presence of mesopores and micropores in FeHCF, a larger specific surface area can be offered although the particles are larger.[59] It is mainly that F− has a strong chelating capability which slows down the release of Fe2+, thus leading to lower amounts of water and defects.[60] These behaviors enable the enhanced electrochemical energy storage of FeHCF.
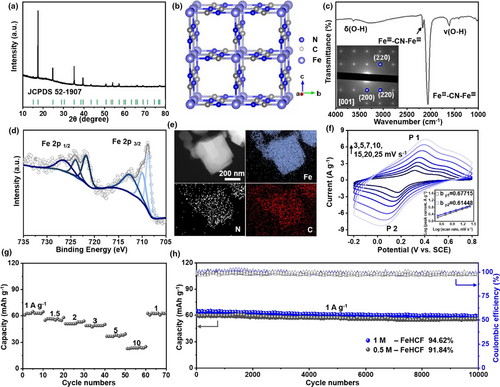
Analysis of the CV plots is obtained by fitting the peak currents using the power law, ip = avb (where ip is the height of the redox peak, v is scan rate, and the coefficient a and exponent b are fitting parameters). For NH4+ storage in FeHCF, the b-values are nearly the identical for one pair of peaks, ~0.67/0.61 (inset of Figure 2f and Table S2, Supporting Information). This shows that the reaction kinetics of ammonium ions are dominatingly limited by diffusion (e.g., a battery-type electrochemical process) with a minor capacitance surface reaction.[61] It shows excellent rate performance (Figure 2g), delivering 23.6 mAh g−1 capacity at the high current density of 10 A g−1—significantly higher than p-FeHCF (12.8 mAh g−1) as shown in Figure S3a, Supporting Information. The high-rate performance is superior to that of the previously reported electrode material for NH4+ battery.[24, 26, 54] Furthermore, the capacity is restored when the current density returns to 1 A g−1. This is attributed to the formation of larger particles with higher specific surface areas, leading to a shorter ion diffusion path. The performance of the battery was tested at fast charge (5 A g−1) and slow release (0.5 A g−1) marked as Condition 1 (Figure S4a, Supporting Information), and slow charge (0.5 A g−1) and fast release (5 A g−1) marked as Condition 2 (Figure S4b, Supporting Information). In contrast to the 64.63% capacity retention of Condition 1, Condition 2 can reach 99.97% after 10 000 cycles. This shows one practical miniature for FeHCF to store ammonium, that is, charge slowly at routine condition and discharge rapidly at peak power consumption. Upon long-term cycling, the stability of FeHCF remains impressive (Figure 2h) compared to p-FeHCF (Figure S3b, Supporting Information), giving a capacity of 55.5 mAh g−1 after 10 000 cycles (94.4% capacity retention), with an average CE of 99.17% (the CE increase during the initial cycle was caused by the completion of side reactions in aqueous-based batteries[24]). Moreover, after 10 000 cycles, FeHCF and p-FeHCF appear to almost retain their pristine forms and exhibit a slight structural collapse (Figure S5, Supporting Information), implying that the Fe–N interaction can effectively alleviate the volume expansion and maintain the structural stability. In addition, there appears to be no discernable capacity loss even upon reduction of electrolyte concentration—the stability at 0.5 M (Figure 2h) is equivalent to that at 1 M (this is worth noting as reduction in electrolyte concentration can facilitate a large reduction in battery costs).
Furthermore, we in situ grew FeHCF on carbon cloth (CC, Figure S6a, Supporting Information) (FeHCF-CC, Figure S6b, Supporting Information), demonstrated with XRD analysis (Figure S6c, Supporting Information), and the mass loading reaches 7–13 mg cm−2. Despite such high amounts of active materials, the capacity retention can still maintain 96% after 10 000 cycles at current density of 1 A g−1 (Figures S6d, Supporting Information). This further reinforces the suitability of FeHCF for large-scale production and application.
To pinpoint the nonmetal charge carrier (NH4+) topochemistry in the FeHCF lattice, we undertook a comparison using sodium and potassium ions. The energy storage mechanism of their (de)intercalation in PB has been widely recognized.[62, 63] As previously mentioned, the reduction in electrolyte concentration has no significant effect on ammonium ion battery—and so, limited by the solubility of potassium sulfate, we selected 0.5 M electrolyte. Figure S7, Supporting Information shows CV curves of different charge carriers (NH4+, K+, Na+) at a scan rate of 1 mV s−1. The intercalation potential increases with the ion radius of NH4+ > Na+ > K+ (0.35 > 0.31 > 0.26 V).[54] However, the electrochemical performance of metal ions is rather poor (Figure S8, Supporting Information). This may be a result of exfoliation of the active material resulting from the intercalation of increasingly larger ions (from Na+ onwards) as shown in Figure S9, Supporting Information. This correlates with the results of a long-term stability test (Figure S10, Supporting Information) which shows that the active substances were damaged. In addition, the (200) peaks shift left instead of returning to the original position, and the lattice spacings subjected to the K+ and Na+ cycling change more than that of NH4+ after 10 000 cycles (Figure S11, Supporting Information). Furthermore, the kinetic process and interface of electrode materials for NH4+, Na+, and K+ were studied by using electrochemical impedance spectroscopy (EIS) (Figure S12b, Supporting Information).[64, 65] Impedance is composed of ohmic impedance (R0) and charge transfer impedance (Rct) in a high-frequency region, and Warburg impedance (W) in a low-frequency region.[64, 65] The equivalent circuit diagram and corresponding fitting values are displayed in Figure S12a and Table S3, Supporting Information, respectively. The case of NH4+ has smaller Rct before (7.786 Ω) and after the stability test (11.49 Ω), while Rct after K+ cycling increases from 23 to 63.04 Ω. Na+ cycling leads to a larger damage to the electrode/electrolyte interface due to the peeling of active substances and greater volume expansion. As a result, Rct increases from 42.69 to 117.1 Ω. It also shows that our designed Fe–N interaction can well alleviate the volume expansion and help to maintain the interface stability.
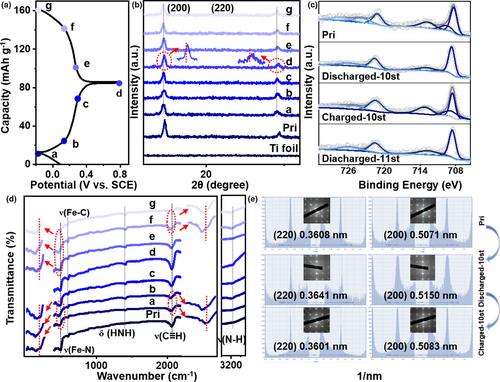
To investigate the electrochemical behaviors during the (dis)charge process, a set of analyses were performed in order to trace the structural evolution of FeHCF (Pristine, and thereafter Pri) and its different states of charge (SOC) (Figure 3a). First, ex situ XRD (Figure 3b) shows that the (200) peak slightly shifted left with decreasing voltage (NH4+ intercalation) and then shifts right with the increase in voltage (NH4+ deintercalation), which is consistent with our SAED (Figure 3e). During cycling with respect to the metal ions (K+ and Na+) (Figures S13 and S14, Supporting Information) the (200) peak shift is much more obvious in comparison to NH4+, which is indicative of larger volume expansion (which would be in keeping with increased degradation of the structure—and thus the observed greater reduction in capacity). XPS data (Figure 3c) shows that the reduction process Fe3+ → Fe2+ took place after NH4+ intercalation, and the oxidation process Fe2+ → Fe3+ afterwards (leading to a mixture of Fe2+ and Fe3+).[26] In addition, the Fe peak shifts right after NH4+ inserted, which may be due to the charge transfer between the NH4+ and Fe.[66] Moreover, in order to eliminate the influence of fluorine ions, we performed XPS analysis for the pristine FeHCF, the samples of first (dis)charge, and after the stability test (Figure S15, Supporting Information). It is only the pristine sample that contains a small amount of F, whereas not detected in the other two. This demonstrates that F ions have no effect on the subsequent electrochemical tests. In order to corroborate this, more structural details were investigated by FTIR spectroscopy. Deduced from the observed positions 1410 cm−1 and 3174 cm−1, attributed to δ(HNH) and ν(NH),[67] we judge that NH4+ enters into the FeHCF lattice. It is also worth noting that the position of C≡N and Fe–N shifts to a lower wavenumber (from ~2064 to 2047 cm−1 and ~496.6 to 467.1 cm−1 for the fully discharged, respectively), rather than those usually observed for nonshift or higher wavenumber.[68, 69] So, our observed significant shift may be related to the hydrogen bond binding/host-type interaction, that is, our designed Fe–N interaction.[70] The nonshift of Fe–C bonds also confirms that only HS Fe has electrochemical activity. However, for the metallic ions (K+ and Na+, Figures S16 and S17, Supporting Information), there is no offset in the process of ion (de)intercalation—indicating that the metal ions have little effect on the electronic structure of electrode materials.[71]
The electrochemical performance of the electrode materials is correlated with the combination of structural and electronic properties, as well as their reversible evolution during charge/discharge. X-ray absorption spectroscopy (XAS) enables the clarification of the role of the TM centers in FeHCF electrodes. Figure 4a shows X-ray absorption near edge structure (XANES) spectra of FeHCF at different SOC: pristine (Pri), fully discharged (−0.2V), and fully charged (0.8V). In the Fe K-edge, the pre-edge features are seen in the energy region (7118–7120 eV) (labeled as I, inset of Figure 4a), which is attributable to the transition to the binding state (the 1s – 3d transition), followed by the ligand to metal charge transfer.[72] In addition, due to the difference in the electron occupancy in the t2g orbital,[73, 74] the pre-edge region of Fe has also undergone significant changes. Moreover, the energy of the Fe3+ eg orbitals is slightly higher than that of the Fe2+, indicating the shift of 1s-3d eg transition after the intercalation of NH4+. Fe centers and their spin configurations after (dis)charge are shown in Figure 4c. The main strong absorption peak for the Fe K-edge at ~7130 eV (Figure 4a, labeled as II) is ascribed to the purely dipole allowed 1s to 4p transition.[44] It shifts to lower energy during discharge (confirming that the metal is reduced), while the opposite trend is observed during the charge process[75]—which coincides with the trend in valence changes observed in the previously mentioned XPS analyses (Figure 3c). It may reasonably be concluded, therefore, that the redox couple of Fe3+/Fe2+ is responsible for capacity contribution during the NH4+ (de)insertion process.
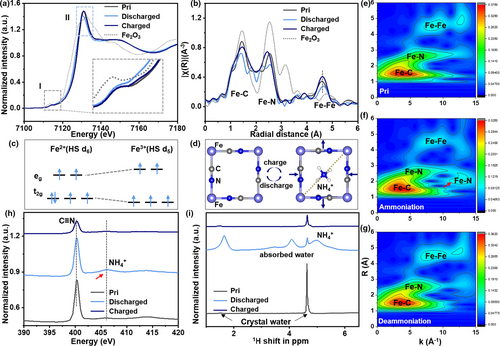
To determine the local atomic environment around the TM ions, corresponding EXAFS analyses were performed. The three main peaks identified for the pristine material are 1.44, 2.54, and 4.60 Å, attributed to Fe–C, Fe–N, and Fe–Fe shells, respectively (Figure 4b).[44, 76] Notably we found that there is an obvious peak splitting of the Fe–C (1.41 and 1.81 Å) and Fe–N (2.24 and 2.54 Å) peaks when the material is in the fully charged state. This is due to the counteraction of the negatively charged N-site of the cyanide ligand bending toward the positively charged; thus, it leads to a stabilization of the distorted structure, as shown in Figure 4d.[71, 77, 78] The overlap between the spectra of the pristine and NH4+-deserted samples indicates high reversibility during electrochemical cycling.
In contrast to the well-known Fourier transform (FT), the Wavelet transform (WT) allows the obtainment of a two-dimensional representation of the periodic signal with simultaneous localization in time and frequency space.[79] In particular, if two or more groups of different atoms are located very close to the absorber, they will overlap and become indistinguishable in the direct space R.[79] We use a Continuous Cauchy Wavelet Transform (CCWT) method for WT analysis,[80, 81] as shown in Figure 4e–g. From this, it seems reasonable to conclude that the first sublobe is dominated by the contributions of Fe–C, the second sublobe results from Fe–N, and the farther place can be attributed to the Fe–Fe bond, Fe–C≡N–Fe.[75] It is worth noting that there are two bonding modes in the Fe–N shell. Intercalated metallic ions are observed to form ionic bonds with the transition metal in PB,[44] thus for nonmetallic NH4+ this may be due to the effect of Fe–N interaction. It is worth noting that this effect disappears after the deintercalation. Moreover, because of the electrochemical activity of Fe coordinated to N, there must be an interaction between HL Fe and N in NH4+—that is, the intended Fe–N interaction, as shown in Figure 4d. To further study the electronic structure of FeHCF after the intercalation of NH4+ N K-edge XAS were obtained, as shown in Figure 4h. The peak at position 402.2 eV is characteristic of cyanide,[82] while the weak signals near 406 eV are due to the N 1s → σ * transition, and may be as attributed to NH4+.[82, 83]
In order to determine whether there is a hydrogen bond in the process of energy storage, we performed solid-state nuclear magnetic resonance (SSNMR) to analyze the proton environments in FeHCF under different SOCs, as shown in Figure 4i. The main peak at 4.62 ppm and the small peak at 1.51 ppm may be attributed to the hydrogen bond network composed of crystal water in the FeHCF material.[74, 84] Additionally, there are three other peaks after NH4+ intercalated. The characteristic peaks of NH4+ may be observed at 5.01 ppm.[85] The larger negative chemical shift is likely caused by the fact that the more the Fe paramagnetic ions are connected to the intercalation ions, the greater the distribution of the spin density on the nitrogen ions.[86] This also indicates the existence of the designed Fe–N interaction. The obvious 4.1 ppm and weak 3.5 ppm peaks are attributed to physical adsorption of water on the material surface.[87, 88] Moreover, it is worth noting that the inherent crystal water peak increases significantly after NH4+ intercalated. This may be due to the formation of hydrogen bonds between the zeolite water and the intercalated ammonium ion. However, when the crystal water content is higher, the stability of the crystal structure is reduced. It is difficult to achieve a higher capacity, as shown in Figures S1 and S3, Supporting Information. Indeed, we did not observe any evidence for the formation of other types of hydrogen bonds, such as NH4+-O. This may be because there is no oxygen layer in the oxide, or other elements that are easy to form hydrogen bonds in FeHCF. The significant shift of FTIR can be attributed to the reversible Fe–N interaction, which reduces the lattice distortion and weakens the stretching behavior of cyanide bonds.
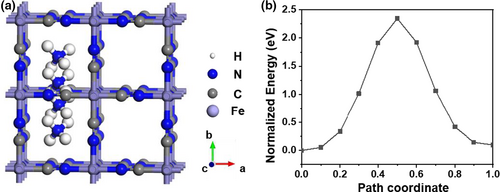
A simple DFT calculation is used to determine the diffusion path and energy barrier of ammonium ions in a perfect FeHCF crystal, simply from the perspective of ion radius. We detected a linear pattern resulting from the diffusion of a single ammonium ion through the center of the body along the [100] axis, as shown in Figures 5a. Due to the relatively large radius of the ammonium ion (1.48 Å) the energy barrier of diffusion is higher (up to 2.34 eV), which is much larger than that of other ions, as shown in Figure 5b and Figure S17, Supporting Information. This is inconsistent with the experimental observations—that is, the active material can be quickly (dis)charged with NH4+. Therefore, the interaction between the NH4+ and FeHCF must be affected by factors other than ionic radius. So, we believe that in addition to the weak Fe–N interaction, what affects include also faster diffusion coefficients (1.98 × 10⁻⁹ m2 s−1) in NH4+ than K+/Na+ (1.95/1.33 × 10−9 m2 s−1),[89] and thereof the probable distortion and directional inserting of ammonium ions.[22]
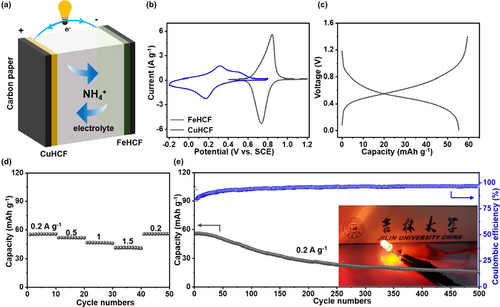
A Prussian blue-based aqueous NH4+ battery was constructed using copper hexacyanoferrate (CuHCF) and FeHCF as the cathode and anode, respectively. This is based on the fact that (as the standard ionization energy of Fe2+ is lower than that of Cu2+) CuHCF has higher electrode potential,[90] as shown in Figure 6a. The prepared CuHCF was found to be phase pure (Figure S19a, Supporting Information) and exhibited an irregular morphology consisting of small particles (Figure S19b, Supporting Information). The b value is slightly larger than for FeHCF (Figures S19c,d, Supporting Information), due to the increase in pseudo capacitance caused by these smaller particles. In addition, in order to explore the energy storage mechanism of CuHCF, we tested ex FTIR (Figure S20, Supporting Information). It shows that with the insertion of ammonium ions, Fe2+ is oxidized to Fe3+, and returned to Fe2+ with the deintercalation of NH4+.[91, 92] The change trend of Cu ion is the same as that of Fe ion, but no independent Cu redox peak is detected (Figure S19c, Supporting Information), indicating that Cu is more inert than Fe.[91, 92] The stability performance (Figure S19e, Supporting Information) is difficult to compare with FeHCF, as there is severe peeling off of the active substances (Figure S21, Supporting Information). Nevertheless, a FeHCF//CuHCF full battery was assembled and tested. Figures 6b,c shows the CV curves of half-cell and the GCD curve of the full battery. The full battery exhibits improved rate performance and reaches an energy density of 33 Wh kg−1 at the current density of 0.2 A g−1, as shown in Figure 6d. Besides, due to the serious peeling problem of active substances in CuHCF, the cycle performance of the full cell is not satisfactory, delivering 15.87 mAh g−1 after 500 cycles (Figure 6e). In addition, in order to determine if CuHCF affected the stability of the full battery, we reassembled the full battery with FeHCF and MoO3. After 300 cycles, it can reach 134 mAh g−1; based on FeHCF weight, it can deliver an energy density of 34.8 Wh kg−1 (Figure S22, Supporting Information). This proves that NH4+ can be used as a charge carrier to form a full battery.
3 Conclusions
In order to solve the well-known problem of colossal volume changes resulting from large ion intercalation in electrode materials, we present an approach inspired by nitrogen adsorption on Fe surface during the early stages of nitriding steel and iron-based ammonia catalyst synthesis. At the atomic level, we designed a material with a weak force that acts in opposition to the ion intercalation process—namely the Fe–N interaction (HL Fe and N in ammonium ions). This can effectively alleviate volume expansion, helping maintain long-term cycling stability (58 mAh g−1 after 10 000 cycles). In addition, when the concentration of electrolyte drops to 0.5 M, or when there is high loading of FeHCF (7–13 mg cm−2), there is no obvious capacity loss (59.4, 59.3 and 58.9 mAh g−1 after 10 000 cycles, respectively). We have not observed the hydrogen bond during the intercalation of NH4+, due to the absence of electronegativity-strong atoms (e.g., F, N, and O) in FeHCF. Thus, although NH4+ has a similar energy storage behavior to metal ions, the interaction between NH4+ and electrode materials varies with respect to different electrode materials.
Acknowledgements
This research is supported by the National Natural Science Foundation of China (51932003,51872115), 2020 International Cooperation Project of the Department of Science and Technology of Jilin Province (20200801001GH), Project for Self-innovation Capability Construction of Jilin Province Development and Reform Commission (2021C026), the Project supported by State Key Laboratory of Luminescence and Applications (KLA-2020-05), the Fundamental Research Funds for the Central Universities JLU, and “Double-First Class” Discipline for Materials Science & Engineering. The Beijing Synchrotron Radiation Facility (BSRF) is greatly acknowledged for providing us the beam time on beamlines 1W2B and 4W9B for the XAFS measurements, and Shanghai Synchrotron Radiation Facility, on BL14B1 beamline for XRD analysis. For Users with Excellence Program of Hefei Science Center CAS (2020HSC-UE002), the authors thank the NSRL beamlines MCD-A and MCD-B (Soochow Beamline for Energy Materials) in National Synchrotron Radiation Laboratory for providing beam time. We express our sincere thanks to Dr. Nicholas E. Drewett for his critical reading and suggestions.
Conflict of Interest
The authors declare no conflict of interest.


