Promoting Proton Migration Kinetics by Ni2+ Regulating Enables Improved Aqueous Zn-MnO2 Batteries
Abstract
The energy storage behaviors of MnO2 for aqueous Zn-MnO2 batteries mainly depend on the Zn2+/H+ intercalation but are limited by poor ion/electron migration dynamics and stability. Herein, a strategy is proposed that promoting proton migration kinetics ameliorates H+ storage activity by introducing Ni2+ into γ-MnO2 (Ni-MnO2). Ni2+ can lower the diffusion barrier of H+ and selectively induce the ion intercalation, thereby alleviating the electrostatic interaction with the lattice. Moreover, Ni2+ enables the adjacent [MnO6] octahedrons to have better electron conductivity. The Ni-MnO2 exhibits superior rate performance (nearly four times specific capacity compared with MnO2) and ultra-long-cycle stability (100% of capacity retention after 11 000 cycles at 3.0 A g−1). The calculation indicates that the Ni-MnO2 allows H+ migrate rapidly along the one-dimensional tunnel due to reduction of the activation energy caused by Ni2+ regulating, thus achieving excellent reaction kinetics. This work brings great potential for the development of high-performance aqueous Zn-MnO2 batteries.
1 Introduction
With the development trend of renewable energy technology to large-scale penetration, aqueous rechargeable zinc ion batteries (ZIBs) have broad prospects in energy storage applications due to the high theoretical capacity of Zn metal anode (820 mAh g−1), low oxidation–reduction potential (−0.76 V vs SHE), and intrinsic incombustibility of water electrolytes.[1-7] At present, most of research works are focused on the exploration of cathode materials, such as Mn-based oxides,[8-11] V-based oxides,[11-13] Prussian blue analogs,[14, 15] organic compounds,[16, 17] etc. Among them, polymorphic MnO2 (such as α-, β-, γ-, and σ-) has high theoretical capacity (Mn4+/Mn3+, ~308 mAh g−1)[18-22] and high-voltage window (1.2–1.4 V),[23-25] which make the aqueous Zn-MnO2 batteries have outstanding advantages such as high energy density, high safety, low cost, and ecofriendliness.[7, 15, 20, 26-29]
Although Zn2+ has a relatively small ionic radius (0.74 Å) and relatively high ionic conductivity (≈1−10 mS cm−1),[30] it will cause a strong electrostatic interaction with the host lattice of MnO2, thus showing slow diffusion rate and limited reversibility. Meanwhile, the Jahn–Teller distortion in the [MnO6] octahedron and the disproportionate dissolution of Mn(III) further make the host lattice framework unstable, resulting in the irreversible dissolution of manganese oxides.[31-33] Therefore, achieving the reversible intercalation of Zn2+ or H+ with high capacity and long-cycle life is still a challenge for aqueous ZIBs.
The electronic state regulation of manganese oxide by doping transition metal elements (Zn, K, Ni, Cu, and Co) is considered to be an important and effective strategy to significantly improve electrochemical performance.[22, 34-40] On the one hand, the strategy can optimize the charge/ion state and electronic band gap, and promote the rapid migration of H+, thereby improving rate performance and nanofluidic iontronics.[41-44] On the other hand, it stabilizes the crystal structure of the MnO2 cathode materials by the coordination of guest ions with neighboring host atoms. For example, our team recently reported that the multivalent cobalt-doped manganese oxide (Co-Mn3O4) can precisely regulate the electronic state of Mn-O, effectively suppressing the Jahn–Teller effect. This work improved the cycle stability of Mn3O4 (after 250 cycles at 0.2 A g−1, the capacity retention rate is as high as 90%) and increased the discharge capacity (362 mAh g−1 at 0.1 A g−1).[33] Zhou et al. adjusted the electronic structure by pre-embedding K+ in the 2 × 2 tunnel structure of α-MnO2 to improve storage capacity.[45] In addition, Qin's group reported that Ni2+-doped Mn2O3 could stabilize the Mn-O bond and promote electron rearrangement. The Zn//Mn2O3 battery exhibited excellent cycle stability (the capacity retention rate reached 85%, more than 2500 cycles at 1.0 A g−1).[22] Therefore, it is a significant measure to construct manganese oxide cathode materials with stable ion (Zn2+/H+) migration channels by the electronic state regulation.[46]
Herein, we facilely synthesize a Ni2+-regulated γ-MnO2 (designated as Ni-MnO2) with excellent proton migration kinetics as cathode material for high-performance ZIBs. The introduction of Ni2+ can ameliorate H+ storage activity in the tunnel and accelerate electrochemical reaction kinetics. Meanwhile, Ni2+ doping lowers the diffusion barrier of H+ and selectively induces the ion intercalation, thus endowing the aqueous battery rapid kinetics. First principle calculations further verify that the Ni-MnO2 allows the one-dimensional H+ migrate rapidly along the tunnel due to reduction of the activation energy caused by Ni2+ regulating. Compared to pristine γ-MnO2, the Ni-MnO2 electrode material delivers ultra-high rate performance (56 mAh g−1 at 10 A g−1) and ultra-long-cycle life (the capacity retention rate exceeds 100% after 11 000 cycles at 3.0 A g−1). The Ni2+ doping significantly improves the electrochemical performance of γ-MnO2, which provides a new route for the development of superb aqueous Zn-MnO2 batteries.
2 Results and Discussion
To understand the feasibility that Ni2+ doping can selectively induce ion intercalation, the H+ intercalation barrier energies in the MnO2 and Ni-MnO2 model were calculated by density functional theory (DFT) (Figure 1a). Compared with the pristine MnO2, the introduction of Ni2+ can effectively reduce H+ diffusion barrier in the {2 × 1} tunnel, thereby accelerating the proton reaction kinetics. Although it has a lower barrier energy in the {1 × 1} tunnel, it is not the most stable diffusion position. Ni-doped γ-MnO2 spike-like nanoarrays (Ni-MnO2) are prepared by galvanostatic electrodeposition and finally uniformly coated on carbon cloth.[47] Figure 1b shows a simple synthesis process of Ni-MnO2 electrode. Figure 1c and Figure S1, Supporting Information show the doping type Ni-MnO2 formed by Ni2+ replacing part of the Mn4+ lattice position in γ-MnO2. The smaller layer spacing structure (2.3 Å × 2.3 Å + 4.6 Å × 2.3 Å) of γ-MnO2 is considered to be a random intergrowth of {1 × 1} tunnels of pyrolusite and {2 × 1} tunnels of ramsdellite composed of [MnO6] octahedral units with edge or corner sharing, so the volume expansion rate of the crystal is low after doping.[48, 49] As a result, the overall crystal form of Ni-MnO2 is not easy to transform. The scanning electron microscopy (SEM) of Ni-MnO2 shows that the nanoarrays are densely and uniformly coated on the surface of the carbon fiber, and the deposition thickness is about 1.5 μm. Furthermore, it can see that the spike-like nanotopography by magnifying a certain part under high magnification (Figure 1d). For intuitive comparison, undoped γ-MnO2 is prepared by electrodeposition, as shown in Figure S2, Supporting Information. Transmission electron microscopy (TEM) is used to analyze the microstructure of Ni-MnO2 (Figure 1e). High-resolution transmission electron microscope (HR-TEM) shows lattice fringes with a pitch of 0.242 nm, which can be assigned to the (131) crystal plane of γ-MnO2 (Figure 1f). In addition, the interpolated selected area electron diffraction (SAED) pattern shows three fuzzy and bright diffraction rings, corresponding to the (131), (300), and (421) crystal planes of γ-MnO2. According to energy dispersive X-ray spectroscopy (EDX) element detection, Mn, Ni, and O elements are uniformly distributed on a single nanosheet, and the atomic ratio of Ni:Mn is close to 1:6 (Figure 1g and Figure S3, Supporting Information). Furthermore, the amount of Ni doping in Ni-MnO2 is quantitatively analyzed by the inductively coupled plasma optical emission spectroscopy (ICP-OES), and the results are shown in Table S1. The proportion of Ni content is in line with the characteristics of metal ion doping. To prove that the crystal structure of γ-MnO2 does not be changed after Ni doping, X-ray diffraction (XRD) analysis is carried out on the crystal and phase information (Figure 1h). In comparison with pristine γ-MnO2, the diffraction peaks corresponding to the three main crystal planes have neither obvious shift nor other new impurity peaks after Ni doping, but the peak intensity is slightly weakened (JCPDS No. 14-0644).[25] This confirms that Ni doping will reduce the crystallinity of the material.
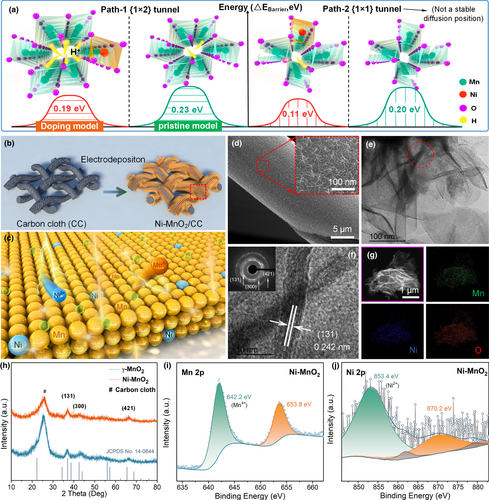
Ni-MnO2 was further analyzed by X-ray photoelectron spectroscopy (XPS) for the valence state (Figure 1i,j). The target elements Ni, Mn, and O were detected, respectively, which confirmed the successful doping of Ni. The high-resolution Mn 2p spectrum is shown in Figure 1i, and its high spin–orbit resolution peak is resolved as Mn4+ (2p3/2, 642.2 eV; 2p1/2, 653.8 eV).[21, 50-52] Compared with the Mn 2p spectrum of pristine γ-MnO2 (Figure S4, Supporting Information), the spin–orbit peak of Ni-MnO2 shifts to the left. It shows that the hybridization of foreign ions will change the bonding state of the crystal structure. In Ni 2p spectrum (Figure 1j), the spin–orbit resolution peak is resolved as Ni2+ (2p3/2, 853.4 eV; 2p1/2, 870.2 eV), which indicates that Ni is doped into γ-MnO2 with +2 valence.[22, 53-56] The XPS results are consistent with the above analysis, and Ni-MnO2 meets the experimental requirements in the overall structure design.
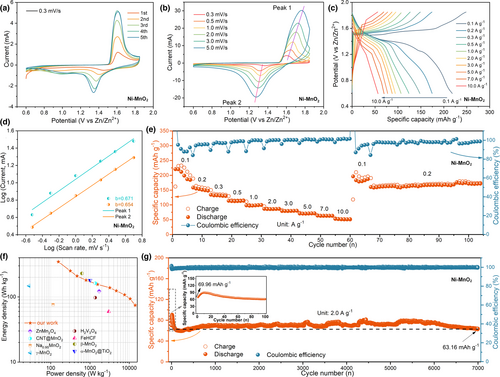
The electrochemical performance of Ni-MnO2 cathode material is carried out in the coin cell, which utilized zinc foil as the anode and 2 M ZnSO4 + 0.2 M MnSO4 as the electrolyte.[1, 38] Cyclic voltammetry (CV) curves of Ni-MnO2 are obtained at the scan rate of 0.3 mV/s under 0.6–1.85 V (Figure 2a). During the initial cathode cycle, the contact surface area between electrolyte and active site of electrode material is small, and only a small amount of H+ is intercalated into the host for energy storage. As the number of scanning cycles increases, the winding area of CV curve gradually increases, and the shape of the curve tends to overlap after the fifth cycle. In particular, there is only a pair of obvious reduction/oxidation peaks in the entire cathodic scanning process, corresponding to 1.32 V/1.58 V, respectively, which is related to the intercalation of H+. With the scan rate increasing from 0.3 to 5 mV/s, the reduction peak/oxidation peak of CV curve shifts to lower or higher potentials, resulting in a deeper polarization (Figure 2b). According to the typical method (log i = log a + blog v),[44] the b values of Ni-MnO2 are calculated to be 0.671 (peak 1) and 0.654 (peak 2), respectively, indicating that the electrochemical kinetics of electrode is related to the diffusion control process and the capacitance effect, but the diffusion control behavior is the main process (Figure 2d). Further fitting calculation (i(V) = k1ν + k2ν1/2)[57] reveals that the capacitance contribution of the electrode material is only 44.58% (Figure S5, Supporting Information). Figure 2c shows galvanostatic charge–discharge (GCD) curves of Ni-MnO2 at different current densities. The specific capacity reaches 224 mAh g−1 at 0.1 A g−1. In addition, with the increase of current density, even increasing to 10 A g−1, the capacity remains as high as 56 mAh g−1, thus exhibiting excellent rate performance. When returning to 0.1 and 0.2 A g−1 again, the capacity retention rate of the electrode still exceeds 95% (Figure 2e). Furthermore, we perform long-cycle performance tests. It can cycle more than 180 cycles at 0.1 A g−1, and the capacity has not decayed significantly (Figure S6a, Supporting Information). In addition, after 7000 cycles at 2.0 A g−1, the capacity retention rate of Ni-MnO2 was close to or exceeded 100% (Figure 2g). Compared with reported cathode materials for zinc-based batteries (Figure 2f), such as ZnMn2O4,[28] CNT@MnO2,[52] Na0.95MnO2,[58] γ-MnO2,[49] H2V3O8,[59] FeHCF,[15] β-MnO2,[26] α-MnO2@TiO2,[38] etc., Ni-MnO2 delivers high energy density of 346.4 Wh kg−1 and outstanding power density of 14.11 kW kg−1 (based on the active mass of the cathode load, about 2.0 mg).
Based on γ-MnO2 and Ni-MnO2, various electrochemical measures were used to explore the performance differences caused by Ni2+ doping. Figure 3a is the rate performance comparison of γ-MnO2 and Ni-MnO2. Specifically, with the current density increases stepwise from 0.1 to 3.0 A g−1, the Ni-MnO2 shows excellent rate performance, indicating its improved electrical conductivity. When it returns to 0.1, 0.2 A g-1 cycles, the capacity retention rate exceeds 100%, which further reflects the outstanding stability of the electrode structure. Conversely, the γ-MnO2 exhibits extremely poor reversibility, which eventually leads to a rapid decline in electrochemical performance. To better explain the reaction kinetic mechanism, the galvanostatic intermittent titration technique (GITT) and electrochemical impedance spectroscopy (EIS) were used for rigorous experimental research. Figure 3b is the GITT of γ-MnO2 and Ni-MnO2 during the first cycling, respectively. Correspondingly, the diffusion coefficient D is calculated according to Fick's second law ()[33] and shown in Figure 3c. The diffusion coefficient of Ni-MnO2 is one order of magnitude higher than that of γ-MnO2 at the discharge stage, which demonstrates that Ni2+ doping can promote H+ intercalation. Besides obtaining electrochemical impedance spectroscopy (EIS) to learn more about resistance and conductivity (Figure 3d), by fitting the EIS data of Ni-MnO2, RS (0.35 Ω), R1 (71.27 Ω), and R2 (84.86 Ω) are calculated. In contrast, γ-MnO2 has higher RS (0.56 Ω), R1 (266.1 Ω), and R2 (172.9 Ω). Furthermore, Ni-MnO2 electrode exhibits the greater linear slope in the low-frequency region, which reflects the faster transfer/diffusion kinetics at the electrode–electrolyte interface.

Figure 3e shows the curves of γ-MnO2 and Ni-MnO2, which could indicate the difference in ion (de)intercalation mechanism between them. The CV curve of γ-MnO2 has two obvious reduction peaks (1.24 and 1.37 V), corresponding to the intercalation process of Zn2+ and H+, respectively (Mn4+ → Mn3+). For Ni-MnO2, there is only a strong reduction peak at 1.35 V, that is, the intercalation reaction of H+. The charge–discharge curves of first 6 cycles are shown in Figure 3f. As the current density is constant in the discharge process, H+ intercalation in Ni-MnO2 may make the voltage change approximately linearly, resulting in discharge platform tilt or not obvious inflection point. However, γ-MnO2 will undergo the conversion reaction (phase transformation). When Zn2+/H+ enters the host, a new fixed phase will be produced (such as spinel ZnMn2O4, layered ZnxMnO2, and MnOOH), and the potential corresponding to this new phase is fixed. As the discharge process goes on, the content of this new phase is continuously accumulated, thus presenting an obvious discharge platform in the discharge process.[43] Combined with Figure S7, Supporting Information, the γ-MnO2 electrode exhibits two obvious discharge platforms, which correspond to the intercalation process of Zn2+ and H+, respectively. Besides, γ-MnO2 has an obvious side reaction process in the low potential range (0.6–0.8 V), which is unfavorable for the reversibility of rechargeable batteries. But for Ni-MnO2, the discharge platform corresponding to Zn2+ intercalation is shorter and not clear, and the whole process is mainly the long discharge platform corresponding to the H+ intercalation. Besides, 2 M ZnSO4/dimethyl sulphoxide (DMSO), 0.2 M MnSO4/H2O, and (2 M ZnSO4 + 0.2 M MnSO4)/H2O are used to explore the capacity contribution of Zn2+ and H+ intercalation. It can be seen from Figures S8a,b (Supporting Information) that the discharge platform corresponding to H+ intercalation is between 1.35–1.37 V, and the discharge platform corresponding to Zn2+ intercalation is around 1.24 V, which corresponds well to the information feedback in Figure 3e. Meanwhile, the capacity contribution brought by H+ intercalation accounted for the main part (the capacity exceeds 130 mAh g−1) in Ni-MnO2. Figure S8c,d, Supporting Information again confirm that the introduction of Ni selectively promotes H+ intercalation and improves structural stability. During the charging and discharging process, the pH value of the electrolyte where Ni-MnO2 is located changes more than that of γ-MnO2, implying that the H+ intercalation process is more prominent and highly reversible (Figure S9, Supporting Information). This reveals that H+ storage behavior would be favorably regulated by doped Ni2+. Importantly, we analyzed the dissolved Mn and Ni concentrations in the 2 M ZnSO4 electrolyte by ICP-OES based on the three-electrode tank test system. After 100 cycles, the dissolution of Mn in Ni-MnO2 can be effectively alleviated, while Ni is basically insoluble (Figure 3g). To intuitively understand the improvement of structural stability by Ni doping, we performed ex situ SEM characterization of MnO2 and Ni-MnO2 (Figure S10, Supporting Information). Ni-MnO2 nanomorphology coated on the carbon cloth did not dissolve after 100 charge–discharge cycling, while the dissolution of MnO2 nanoarrays was extremely serious (Figures S6a and S11, Supporting Information). As a result, the capacity retention rate of γ-MnO2 electrode was only 43.5% after 100 cycles at 0.1 A g−1, suggesting its extremely poor stability. The γ-MnO2 and Ni-MnO2 were then tested for long-life performance. Excitingly, compared with γ-MnO2 (Figure 3h), Ni-MnO2 exhibits excellent cycle stability (the specific capacity maintains 63.90 mAh g−1 after 11 000 cycles at 3.0 A g−1). Therefore, Ni2+ doping can promote rapid proton migration and improve structural stability.
Ex situ SEM, XRD, and XPS were used to analyze the energy storage mechanism of Ni-MnO2 electrodes. Figure 4a shows the schematic diagram of Ni-MnO2 as the cathode and assembled into coin cell. Figure 4b shows the energy storage mechanism of Ni-MnO2. The energy storage contribution of Ni-MnO2 is mainly due to the H+ (de)intercalation during charging and discharging. Meanwhile, this process will also be accompanied by the reversible formation and dissolution of the byproduct zinc hydroxy sulphate (ZnSO4·3[Zn(OH)2]) on the surface of electrode.[44, 46] Next, we use ex situ XPS to characterize and analyze the valence states of Ni-MnO2 at different states. According to Figure 4c, with the discharge from the initial state to 0.6 V, H+ gradually intercalated into the host, the spin–orbit peak of Mn shifted to the left, and the Mn4+ in Ni-MnO2 was reduced to Mn3+ (641.9 eV).[51] When charged to 1.85 V, H+ is deintercalated from the host, and Mn3+ is oxidized to Mn4+ (642.3 eV), returning to the original Ni-MnO2 crystal structure. More importantly, the spin–orbit peak corresponding to Ni2+ in Ni-MnO2 did not shift, and the +2 valence is always maintained during the cycle (Figure 4d). Combined with the analysis about the reversible valence transition of Mn4+ ↔ Mn3+ and the ICP-OES of dissolved Ni (Figure 3g), which show that Ni plays a role of "structural pillar" to a certain extent. The reason for weakening of the Ni spin–orbit peak is related to the interference caused by ZnSO4·3[Zn(OH)2] coated on the electrode surface (Figure 4e–h). For comparison, we also performed ex situ XPS tests on γ-MnO2 (Figure S12b, Supporting Information). During the entire charge and discharge, the spin–orbit peak of Mn 2p in γ-MnO2 has an irreversible shift, implying its poor cyclic reversibility.
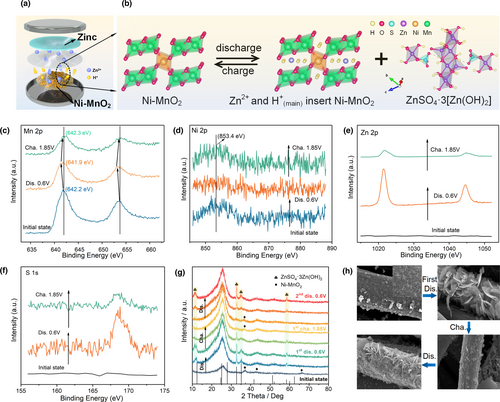
Furthermore, the structure of Ni-MnO2 and γ-MnO2 was characterized by ex situ XRD (Figure 4g and Figure S12a, Supporting Information). From the initial state to the first discharge to 0.6 V, the strong diffraction peak of ZnSO4·3[Zn(OH)2] (JCPDS No. 44-0675) was detected. In addition, combined with the corresponding EDX mapping of Ni-MnO2 and ZnSO4·3[Zn(OH)2] in Figure S13, Supporting Information, it was proved that there was a large amount of H+ insertion.[27] After charging to 1.85 V, the obvious intrinsic diffraction peaks were detected. This is due to the deintercalation of H+ from the Ni-MnO2 host, the ZnSO4·3[Zn(OH)2] coated on the surface begins to be dissolved, and the pH value in the electrolyte is reduced to the original level, and the inner layer Ni-MnO2 nanoarray is exposed again. The reversible dissolution/generation of large-size flaky ZnSO4·3[Zn(OH)2] or the appearance/disappearance of the intrinsic diffraction peaks of Ni-MnO2 during the cycle strongly indicates its high structural stability and cycle reversibility. To reduce the test interference of the discharge product ZnSO4·3[Zn(OH)2], Ni-MnO2 is characterized by the XRD based on the three-electrolyte tank at the discharge state. Figure S14, Supporting Information shows that multiple diffraction peak signals were detected during the discharge phase, including ZnSO4·3[Zn(OH)2] (The diffraction peak signal is weakened, illustrating that the pH value fluctuates less in large-volume electrolyte environment), MnOOH,[7, 25] and a very small amount of ZnMn2O4.[28, 60, 61] This indicates that the doped Ni2+ has an excellent promotion effect on the intercalation of H+ and strongly confirms the existence of H+ storage regulation mechanism.
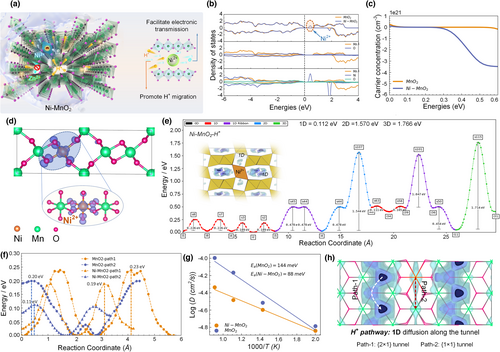
First principle calculation was used to further verify the optimization of Ni2+ doping on the energy storage mechanism. H+/electrons can quickly migrate and conduct in the Ni-MnO2 (Figure 5a). The band gap of Ni-MnO2 electrode is basically unchanged after the introduction of Ni2+, but the impurity level produced will increase the carrier concentration (Figure 5b,c). The electron distribution of the corresponding impurity level (Figure 5d) intuitively shows that the octahedrons around Ni2+ have higher density of electron distribution. Therefore, the introduction of Ni2+ will improve the surrounding electron concentration. Figure 5e shows the proton migration pathways derived by applying the soft BV bond valence parameter approach to the Ni-MnO2 crystal structure.[62] The model predicts the one-dimensional H+ paths that are strictly separated along the tunnel. Figure 5f is the comparison of H+ self-diffusion paths of γ-MnO2 and Ni-MnO2 calculated by soft BV. Lower activation energy and favorable doping sites can promote proton migration. In addition, in this process, for protons, the adsorption of path 1 is more stable, and the barrier is slightly higher; the diffusion barrier of path 2 is lower, but it is not the most stable position. Combined with the information of Figures S15 and S16, Supporting Information, Ni2+ doping can effectively lower the activation energy (0.23 eV → 0.19 eV), thereby facilitating the one-dimensional H+ diffusion along the tunnel. Moreover, Ab initio molecular dynamics (AIMD) calculation further illustrates that Ni2+ doping will reduce the absorption energy (144 meV → 88 meV) of H+ diffusion to overcome the barrier (Figure 5g), which is consistent with the diffusion barrier results by soft BV. Figure 5h is the contour map of soft BV. Two paths of H+ diffusion in the Ni-MnO2 lattice: path1 {1 × 2} tunnel and path 2 {1 × 1} tunnel, but path1 {1 × 2} tunnel adsorption will be more stable.
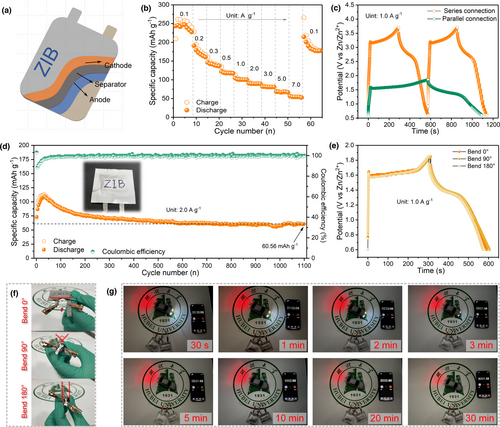
Zn//Ni-MnO2 battery is assembled into the flexible package to illustrate the feasibility of its practical application (Figure 6a). Combined with Figure 6b and Figure S17, Supporting Information, Zn//Ni-MnO2 soft-pack battery exhibits excellent rate performance. The battery delivers a discharge capacity of up to 238.7 mAh g−1 at 0.1 A g−1, and as the current density increases to 7.0 A g−1, the capacity still exceeds 50 mAh g−1. The soft-pack battery tested in Figure 6b is then cycled to 4000 cycles at 1.0 A g−1 and still has ideal capacity retention (Figure S18, Supporting Information). Furthermore, it can be seen from Figure S19, Supporting Information and Figure 6c that the open circuit potential of single soft-packed battery is 1.85 V, and two batteries in series can obtain an output potential close to 3.7 V. In addition, the capacity contribution obtained by two soft-pack batteries in parallel is nearly twice that provided by single battery. To avoid the difference in performance test caused by the activation of electrode materials, we conducted a long-life test on the initialized Zn//Ni-MnO2 soft-pack battery. After 1100 cycles at 2.0 A g−1, the capacity retention rate still reaches 81.8% (Figure 6d). This indicates that the soft-pack battery has a good electrochemical stability in the energy storage of large-scale devices. After bending at various angles (0°, 90°, and 180°), the electrochemical performance of the battery has not attenuated and it works normally (Figure 6e,f). Especially, the soft-packaged battery is bent 180°, the indicator light (1.85 V) can still be normally lit. Two batteries in series can also light up the indicator light of the model car (more than 3 V). After more than 30 min, the car lights are still bright (Figure 6g).
3 Conclusion
In summary, Ni2+-doped MnO2 was successfully synthesized for aqueous ZIBs. The introduction of Ni2+ can effectively regulate the H+ storage behavior and endow the Ni-MnO2 electrode material with excellent proton migration kinetics. Meanwhile, Ni2+ could lower the diffusion barrier of H+ and selectively induce the ion intercalation. Density functional theory clearly reveals that Ni2+ doping significantly ameliorates structural stability and enhances conductivity of electrons. The resultant Zn//Ni-MnO2 cell delivers excellent rate performance and ultra-long-cycle stability (After 11 000 cycles at 3.0 A g−1, the capacity retention rate exceeds 100%). In addition, the flexible soft-packaged battery also displays superior electrochemical performance. The revealed feasibility of proton transmission along a one-dimensional path has greatly stimulated the further development of Zn-MnO2 batteries and nanofluidic ionic devices.
4 Experimental Section
Structural Characterization
The scanning electron microscope (SEM, JEOL JSM-7100F) was used to study the morphology and size of the samples. X-ray diffraction (XRD) is a diffractometer obtained by Bruker D8 Advance using 40 kV, 40 mA CuKα radiation. Using a cold-field emission electron source and an image Cs corrector (CEOS GmbH), A JEOL ARM 200F microscope operating at 200 kV was tested on a transmission electron microscope (TEM) and energy-dispersive X-ray spectrometer (EDX). X-ray photoelectron spectrometer (XPS) was performed using a Thermo Fisher Scientific Escalab 250Xi spectrometer with AlKα radiation.
ZIB Performance Test
This experimental test was based on the form of coin cell and flexible soft-pack battery. The cathode material was Ni-MnO2 coated on the surface of the carbon cloth, the anode material was commercial zinc foil with high purity, the electrolyte was 2 M ZnSO4 + 0.2 M MnSO4, and the electrode ware separated by a glass fiber diaphragm. Cyclic voltammetry (CV) and galvanostatic charge–discharge (GCD) wared performed on the ChenHua electrochemical workstation (CHI760E) to test the electrochemical performance, and the eight-channel battery test equipment (NEWARE) was used to test rate performance and long-cycle life. Besides, Pt was used as the counter electrode, Ag/AgCl (saturated KCl as the electrolyte) as the reference electrode, and finally, the Ni-MnO2 to be tested was clamped on the working electrode for a three-electrode test.
Acknowledgements
J.J., J.Y. and Y.X. contributed equally to this work. This work was supported by the National Natural Science Foundation of China (No. 52002122), the Science and Technology Department of Hubei Province (No. 2019AAA038), the Project funded by China Postdoctoral Science Foundation (No. 2021M690947), and the Wuhan Yellow Crane Talent Program (No. 2017-02).
Conflict of interest
The authors declare no competing financial interest.


