Li+ Solvation Mediated Interfacial Kinetic of Alloying Matrix for Stable Li Anodes
Correction added on 30th April 2022, after first online publication: Haiyong He email id has been updated.
Abstract
Severe lithium (Li) dendrite growth caused by the uneven overpotential deposition is a formidable challenge for high energy density Li metal batteries (LMBs). Herein, we investigate a synergetic interfacial kinetic to regulate Li deposition behavior and stabilize Li metal anode. Through constructing Li alloying matrix with a bi-functional silver (Ag)-Li3N blended interface, fast Li+ conductivity and high Li affinity can be achieved simultaneously, resulting in both decreased Li nucleation and mass transfer-controlled overpotentials. Beyond these properties, a more important feature is demonstrated herein; that is, the inward diffusion depth of the Li adatoms inside of the Ag site can be restricted by the Li+ solvation structure in a highly coordinating environment. The latter feature can ensure the durability of the operational Ag sites, thereby elongating the Li protection ability of the Ag-Li3N interface greatly. This work provides a deep insight into the synergetic effect of functional alloying structure and Li+ solvation mediated interfacial kinetic on Li metal protection.
1 Introduction
The energy densities of the state-of-the-art lithium (Li)-ion batteries (LIBs) are approaching their theoretical limits and will not meet the rising demand for high energy density storage applications.[1] To reach a considerable increase in energy density at cell level, Li metal batteries (LMBs) have emerged during the last developments of battery technology, thanks to the ultrahigh theoretical specific capacity (3862 mAh g−1) and one of the lowest electrochemical potentials (−3.040 V vs standard hydrogen electrode, SHE) of Li metal anode.[2] Calculation points out that LMBs using Li metal as anode and Ni-rich layered oxides (LiNixMnyCozO2, NMC) as cathode can reach 400–500 Wh kg−1 at cell level.[2]
Despite the inherent advantages, the adoption of Li metal in secondary batteries is still inhibited due to the chaotic electrode/electrolyte interface, where the thermo- and electro-dynamical instabilities remain a great challenge.[3] The high Fermi level makes Li reactive with all the currently used electrolytes, forming the solid electrolyte interphase (SEI) layers that are thickened upon cycling through the secondary side reactions between the electrolyte and fresh Li exposed at the SEI cracks.[3, 4] Meanwhile, the SEI cracks can be easily triggered by Li dendrite growth, which is resulted from the uneven Li nucleation and sluggish mass transfer.[3, 4] The Li dendrites can penetrate through the separator and short circuit the batteries, or crack to form the electrically disconnected Li branches (“dead Li”).[3, 4] In real conditions, the amounts of Li metal and electrolyte are limited to match the high energy density at cell level.[2] Hence, the thickened SEI layers, the abused electrolyte and the accumulated “dead Li” that engender high interfacial impedance, low ionic conductivity and battery capacity loss, respectively, are devastating to the LMB performances.[3, 4]
To advance the practical application of LMBs, both the Li plating kinetic and interfacial stability need to be improved. The actually available methods mainly include using 3D matrix/current collectors to alleviate the mismatch between the local mass transfer and electrochemical reaction rates,[5-7] building robust artificial SEI to withstand the large volume expansion of Li deposition,[8-10] optimizing electrolyte constituents to achieve better SEI layers, higher chemical stability and/or dynamic performance and so on.[11-13] In particular, as one of the most important parameters involved during the last development of Li protection techniques, Li affinity has shown great importance for the design of Li plating substrates, with aims of lowering the Li nucleation overpotential and improving the uniformity of Li deposition. The effectiveness of this concept has been demonstrated by using metal oxides that can generate the lithiophilic Li2O network during the initial lithiation process,[14-16] or using the metal materials that can alloy with Li.[17-19] However, the use of Li alloys is thought more profitable than the metal oxides, since it avoids the supplementary Li loss rooted in the Li2O conversion that decreases the initial CEs and energy density of LMBs.
Since the solid soluble phase of the binary alloy is a direct indicator of the affinity between the involved metal substances, silver (Ag) has caught tremendous attentions due to the very high solid solubility with Li.[17] Consequently, the Ag-coated or Li-Ag composite anodes can afford much improved CE than the bare Li anodes.[17, 20] In this work, a more advanced bi-functional Ag-Li3N blended interface was proposed to not only achieve the quasi-zero Li nucleation overpotential by forming an alloyed electrode interface with close thermodynamic equilibrium potential to that of bulk Li but also guide dendrite-free Li deposition by maintaining a low mass transfer-controlled overpotential due to the high Li+ conductivity of Li3N. Furthermore, it was found that the Li+ solvation structure of the electrolyte affected the inward diffusion depth of the Li adatoms inside of the Ag site, and the durability of the operational Ag sites can be much improved by restricting the Li-Ag alloying depth in the more coordinated high concentration electrolyte. Inspired by the latter issue, an Ag-Li3N decorated Cu matrix was fabricated via a scalable ionic exchange method and then coupled with a high concentration carbonate electrolyte to undergo a promising Li protection in LMBs.
2 Results and Discussion
Before investigating the Ag-Li3N decorated Cu matrix that contains Cu + Ag + Li3N on the surface, the properties of the Ag-Li3N interface were studied properly on a model structure of electrochemically inert silica (SiO2) net obtained by electrospinning (Figure 1a). The obtained SiO2 net is composed of 2-µm large skeletons (Figure 1b) and has a total thickness of 50 µm (Figure 1c). As shown in Figure S1, Supporting information, typical Si-O bonds are observed on the FTIR spectrum of the obtained SiO2 net,[21] which can be hydrolyzed into Si-OH bonds when the SiO2 net is immersed in AgNO3 aqueous solution, boosting the adsorption of Ag+ ions on the skeletons of the SiO2 net. Also, the SiO2 net is electrochemically stable in the battery environment, which can be illustrated by the similar Li plating/stripping profiles on the bare Cu and Cu/SiO2 (Cu covered by the SiO2 net) electrodes (Figure S2, Supporting information). The X-ray diffraction (XRD) pattern of the SiO2 net immersed in 1 M AgNO3 aqueous solution (denoted as AgNO3@SiO2) is shown in Figure S3, Supporting information. Compared with the bare SiO2 net, the typical peaks of AgNO3 appearing on the XRD pattern of AgNO3@SiO2 demonstrate the successful AgNO3 coating. The latter can also be illustrated by the Ag and N signals from the energy dispersive spectrometer (EDS) mapping of AgNO3@SiO2 (Figure S4b, Supporting information), compared with the bare SiO2 net (Figure S4a, Supporting information).
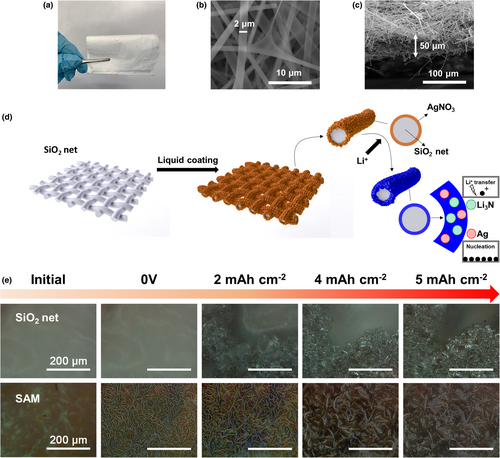
The AgNO3 coating on the SiO2 net can be converted into Ag and Li3N following the lithiation process to 0 V versus Li/Li+, forming an advanced interphase in addition to other SEI components. Since the Li3N is an exceptionally fast Li+ conductor (with a high conductivity of approximately 10−3 S cm−1),[22] and the solid solution-based Li-Ag alloy interface is a great alleviator of the Li nucleation overpotential,[17] the dual Ag-Li3N decoration is expected to address two critical challenges at the Li anode interphase, that is, the sluggish Li+ transfer causing Li+ concentration depletion and the high Li nucleation overpotential causing uneven Li deposition (Figure 1d). As shown in Figure S4c, Supporting information, a cross-linked surface was obtained by the lithiation of AgNO3@SiO2 to 0 V versus Li/Li+, whereas the uniform distribution of Ag and N elements depicts the overall wrapping of SiO2-based alloying matrix (SAM) by the dual Ag-Li3N decoration.
It should be mentioned that in a preliminary study, we have assessed the impact of the AgNO3 aqueous solution concentration on the quality of the Ag-Li3N decoration. As shown in Figure S5a, Supporting information, only for the AgNO3@SiO2 samples obtained from 1 and 2 M AgNO3 aqueous solution, there is a voltage plateau ˜3.4 V versus Li/Li+ during the 1st discharge process, which corresponds to the conversion reaction of AgNO3 + 9Li → Li3N + 3Li2O + Ag, then followed by the progressive voltage drop to 0 V versus Li/Li+ representing the SEI formation and Li-Ag alloying process (there is no well-defined voltage plateau corresponding to the Li-Ag alloying process due to the high solid solubility[23]). It can be seen that the AgNO3 coating is not well achieved in the 0.5 M solution. According to the long-term cycling coulombic efficiency (CE) of Li plating/stripping on the investigated AgNO3@SiO2 samples (Figure S5b, Supporting information), the best performance belongs to the AgNO3@SiO2 sample obtained in 1 M solution, indicating the highest quality of AgNO3 coating. Thus, the 1 M AgNO3 aqueous solution was used as the routine for the preparation of AgNO3@SiO2 samples. Besides, a LiNO3@SiO2 sample obtained from 1 M LiNO3 aqueous solution was also compared, while the related Li plating/stripping stability is poorer than that on the AgNO3@SiO2 sample (Figure S5c, Supporting information), demonstrating the critical role of Ag sites for improving Li nucleation process.
The ability of the dual Ag-Li3N decoration to uniformize Li deposition on SAM is demonstrated by in situ optical study. As shown in Figure 1e, for an initial Li deposition of 2 mAh cm−2, fibrous deposits are formed along the skeletons of SAM, reflecting the lithiophilic Ag sites guided Li deposition. In contrast, gathered dendrite growth appears on the bare SiO2 net at the same state of Li deposition. With increasing Li plating amount up to a practical amount of 5 mAh cm−2, vertical growth of flake-like deposits occurs on SAM, however, still keeps a dendrite-free feature. At the same Li plating amount, massive dendrites are formed on the bare SiO2 net. The improved interfacial kinetic enabled by the Ag-Li3N interface can also be demonstrated by electrochemical impedance spectroscopy (EIS) study. As shown in Figure S6a, Supporting information, a typical blocking electrode feature is observed on the Nyquist plot of the SiO2 net before cycling due to the absence of SEI layer. However, a well-defined semi-circle can be observed for SAM even before cycling, indicating the Li+ conducting ability of the Ag-Li3N interface. After five cycles of Li plating/stripping (0.5 mA cm−2–1 mAh cm−2), the SAM electrode exhibits significantly lower interfacial impedance than that of the SiO2 net (Figure S6b, Supporting information), further confirming the high Li affinity of Ag sites and fast Li transfer through the Li3N enriched interface compared with the conventional SEI layer. These results demonstrate the superiority of the Ag-Li3N decorated interphase for uniform Li deposition. Despite these achievements, the long-term cycling stability of Li plating/stripping on SAM still needs to be improved for a sustainable Li metal protection (Figure S5b, Supporting information). A critical reason for the reduced Li protection ability of SAM should be the loss of Li alloying ability of Ag sites caused by their pulverization during prolonged cycling, knowing that the other component Li3N is quite stable on the electrode surface. If a control of the Li-Ag alloying/de-alloying degree of the Ag sites can be achieved, the Li protection ability of the Ag-Li3N interface should be elongated significantly.
Since the degree of the Li-Ag solid solution reaction is determined by the inward diffusion depth of the Li adatoms inside of the Ag site, manipulating the interfacial diffusion process should impact greatly on the Li-Ag alloying depth.[24] Based on this thought, we have proposed the Li+ solvation structure regulation to mediate the interfacial kinetic of the Li-Ag solid solution reaction. The latter was carried out by changing the electrolyte concentration, and higher electrolyte concentration undergoes more Li+ solvent coordinations due to the increased salt/solvent ratio. Consequently, more salt anions can be drawn into the inner solvation sheath with increased electrostatic attractions, reducing the diffusivity of the solvated Li+ in high concentration electrolytes.[25] Herein, we employed the most conventional carbonate electrolytes, by dissolving various amounts of lithium hexafluorophosphate (LiPF6) in a carbonate mixture of ethylene carbonate (EC): diethyl carbonate (DEC): fluoroethylene carbonate (FEC) with a volume ratio of 1:1:1.
In this work, the symbol of M depicts the electrolyte concentration in mol L−1, specifically. The 7Li nuclear magnetic resonance (NMR) spectra of 1, 2, and 3 M Ely (LiPF6 in EC:DEC:FEC 1:1:1 by vol.) are shown in Figure 2a, whereas the 7Li NMR peak progressively shifts toward lower ppm value with increasing electrolyte concentration. Since the shielding ability of the Li+-PF6− pair is stronger than that of the Li+-solvent complexes, the downshift of the 7Li NMR peak from 1 to 3 M Ely clearly shows the strengthened coordination environment by increasing the electrolyte concentration. The latter can also be illustrated by the Raman spectra (Figure 2b), where the δC = O bending (at 714 cm−1) and νC-O stretching (at 893 cm−1) vibration bands of free EC molecules gradually diminished from 1 to 3 M Ely to form Li+-coordinated EC.[13] It is worth noting that the higher proportion of Li+ coordinated solvent molecules also improves the reductive stability of the high concentration electrolyte, as shown by the smaller reductive peak areas of the linear sweep voltammetry (LSV) curve of the 3 M Ely than those of 1 and 2 M Ely (Figure 2c).
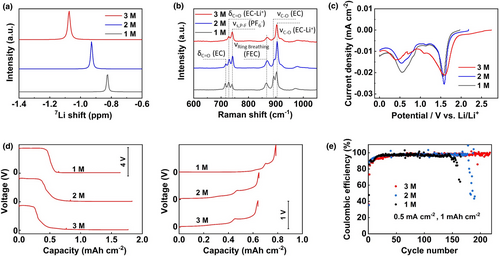
When the various electrolytes are introduced to the Li||SAM cells, the initial voltage profiles are altered significantly. As shown in Figure 2d, during the 1st discharge process, the plateau ˜3.4 V versus Li/Li+ related to the AgNO3 conversion is clearly shortened with increasing electrolyte concentration. However, during the 1st charge process, the plateau ˜0.35 V versus Li/Li+ related to the Li-Ag de-alloying is elongated with increasing electrolyte concentration. These results indicate that the high concentration electrolyte can mitigate excessive AgNO3 conversion reactions during the initial cycling while raising the reversibility of Li-Ag alloying/de-alloying processes in the following cycling. Since the ionic conductivity decreases with increasing electrolyte concentration (Figure S7a, Supporting information), the overpotential of Li plating (the voltage plateau during the discharge) becomes larger on SAM in 3 M Ely compared with those in 1 and 2 M Ely (Figure S7b, Supporting information), however, still maintains lower than those on bare Cu and SiO2 net in 1 M Ely, demonstrating the fast Li+ conductivity enabled by Li3N. Furthermore, the Li nucleation overpotential (difference between the voltage dip and plateau during the discharge) is maintained quasi-zero for Li deposition on SAM in 3 M Ely (Figure S7b, Supporting information), demonstrating the high Li affinity of the Ag substrates. As well, the best cycling stability of Li plating/stripping on the SAM electrode is also obtained in 3 M Ely (Figure 2e). It should be mentioned that the increase in electrolyte concentration has no effect on the cycling stability of Li plating/stripping on the bare Cu and SiO2 electrodes (Figure S8, Supporting information), indicating that the change of Li+ solvation structure mainly affects the interfacial kinetic of Ag alloying sites.
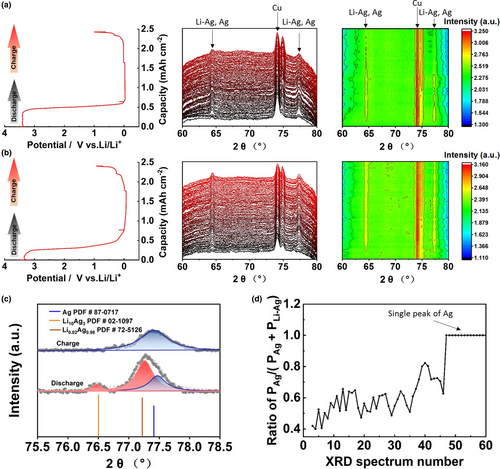
To achieve a comprehensive understanding on the above-obtained electrochemical behaviors, in situ XRD study was carried out on the SAM electrodes using 1 and 3 M Ely. The schematic representation of CR2032 coin cell designed for the in situ XRD study is shown in Figure S9, Supporting information, in which a porous Cu net was used as the current collector to provide the X-ray probing on SAM. Consequently, an intense peak of Cu metal is persistent on all the collected XRD patterns (Figure 3a,b). It should be mentioned that the peak positions between Li-Ag and Ag are very close due to the high solid solubility. During the 1st discharge processes, the peaks related to Li-Ag/Ag appear posterior to the initial conversion of AgNO3 for both the SAM electrodes in 1 and 3 M Ely (Figure 3a,b, respectively). A critical difference between the two samples is that the Li-Ag/Ag peaks in 1 M Ely progressively diminished upon cycling, while intense signals of the Li-Ag/Ag peaks are maintained in 3 M Ely. The reason for the much diminished Li-Ag/Ag peaks in 1 M Ely can be follows: 1) All the Ag sites are pulverized in amorphous states and/or 2) all the Ag sites are covered by thick side products. Both of these two issues indicate that the reversibility of Li-Ag alloying/de-alloying processes in 1 M Ely is much poorer than that in 3 M Ely. Furthermore, for the sample in 3 M Ely, the Li-Ag peak at 76.5° that is observed in discharge state disappears in charge state (Figure 3c and Figures S10, Supporting information). As well, the peak fitting shows two sub-peaks corresponding to Li-Ag and Ag between 76.7 and 78.3° in discharge state, while there is only one single peak of Ag in charge state (Figure 3c). Based on the peak fitting between 76.7 and 78.3°, the peak area ratio of PAg/(PAg+PLi-Ag) as a function of XRD spectrum number (corresponding to different states from discharge to charge processes) is shown in Figure 3d, whereas the value of 1 indicates the restored Ag sites in de-alloyed state. These results demonstrate the high reversibility of Li-Ag alloying/de-alloying processes on SAM in 3 M Ely.
The reversibility of Li-Ag alloying/de-alloying was also studied by electrochemical methods. As shown in Figure 4a, repeated cyclic voltammetry (CV) curves were carried out on the SAM electrodes in 1, 2, and 3 M Ely. On the range of 0–1 V versus Li/Li+, typical cathodic and anodic peaks of alloying and de-alloying reactions can be observed for all the samples.[17] However, much smaller redox areas are observed for 3 M Ely, indicating a restricted electrochemical dynamic. It should be mentioned that CV scanning on the SiO2 net without Ag coating has also been performed. As shown in Figure S11, Supporting information, all the curves exhibit typical electrical double-layer feature due to the Li+ adsorption on the SiO2 net without any faradaic reactions. However, the redox areas are slightly lower in the higher concentration electrolyte due to the restricted electrochemical dynamic. Based on these results, it can be seen that the redox peak evolutions observed in Figure 4a arise from the different Li-Ag alloying/de-alloying processes in various electrolyte concentrations effectively. After the CV tests, the cycled SAMs were subject to X-ray photoelectron spectroscopy (XPS) analysis. As shown in Figure S12a, Supporting information, the typical interpeak distance Δmetal (6.0 eV) of metallic Ag is observed between Ag 3d3/2 and Ag 3d5/2 doublet for all the samples. However, the signals of 1 M Ely are much weaker than those of 3 M Ely, indicating the least metallic Ag retained on the cycled SAM surface in 1 M Ely. Besides, the highest C 1s signals related to the carbonate solvent (EC, DEC and FEC) decomposition products mainly containing C–H, C–O, C=O and C–Fx bonds are observed on the C 1s spectrum of 1 M Ely (Figure S12b, Supporting information).[20] Based on these results and the observed phenomena in the in situ XRD study, it can be seem that cycling in 3 M Ely leads to the most restored metallic Ag and the least solvent decomposition products.
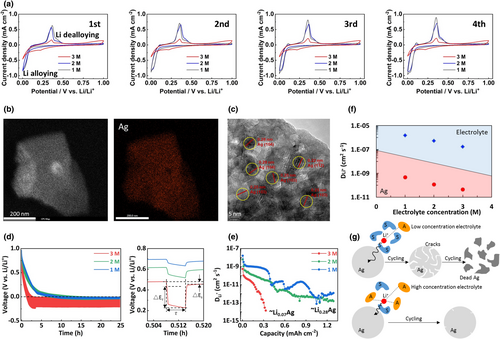
In the high salt concentration electrolyte, due to the anion enrichment in the solvation sheath, higher contents of inorganic species derived from the anion decompositions are generally achieved, instead of free solvent decompositions in the low salt concentration electrolyte.[25] The latter can be illustrated by the higher content of LiF derived from the PF6− decomposition in 3 M Ely, than those of 1 and 2 M Ely (F 1s and Li 1s spectra; Figure S12c,d, Supporting information). LiF is an important component to improve the robustness of the SEI layer,[26] which might be useful to slow down the pulverization rate of the Ag sites. However, we think an effect of the Li+ solvation structure-mediated interfacial kinetic on the inward diffusion depth of the Li adatoms inside of the Ag site, that is linked to the restricted electrochemical dynamic as observed in CV study (Figure 4a), should be responsible for the improved reversibility of Li-Ag alloying/de-alloying processes.
The calculated in the electrolytes are shown in Figure 4f (in blue region), while the average in the Ag substances (based on the data in Figure 4e) are also compared (in red region, Figure 4f). It can be seen that for all the electrolytes, the value of is much lower in the Ag substance than in the electrolyte. Besides, the lowest in the electrolyte and Ag substance are achieved in the case of 3 M Ely. Based on these results, it is clear that the electrochemical kinetic is very sluggish in the system of 3 M Ely, due to the highly coordinated Li+ solvation structure with limited free solvent molecules and strong anion–cation electrostatic attractions. The latter feature can induce a high energy costing sequence of Li+ desolvation transfer adsorption to the Ag sites, significantly shortening the diffusion depth of Li in the bulk Ag. However, these behaviors can in turn avoid over-lithiation and slow down the pulverization rate of the Ag particles in the high concentration electrolyte. In contrast, in the low concentration electrolyte, the pulverization of Ag particles is accelerated due to the deep Li diffusion, and the highly pulverized Ag particles immersed in the thick SEI layer with other solvent decomposition products can cause highly impeding interface and electrode failure (Figure 4g). It should be mentioned that this strategy is also applicable for other Ag-based interfaces including an Ag-LiF-based SAM (Figure S13, Supporting information). Furthermore, the cycling stability of the Ag-LiF-based SAM in 3 M Ely is better than that of the Ag-Li3N-based SAM (Figure 2e). Thus, it is expected to explore an optimal Li protection structure based on the synergism between the electrolyte solvation structure and Ag-based interfaces. For the latter, a more systematic study is needed.
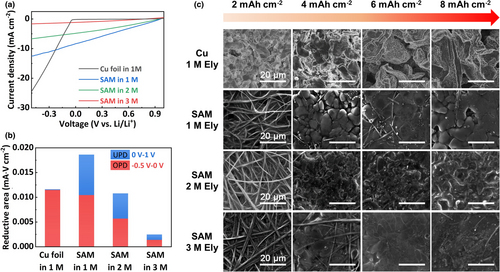
Besides the altered Li diffusion behavior in the bulk Ag, the impact of the Li+ solvation structure-mediated interfacial kinetic on the Li plating morphology was also studied. As shown by the LSV measurements from 1 to −0.5 V versus Li/Li+, the curves on SAM are sharply different from that on the bare Cu foil (Figure 5a). Generally, there are two cases when a metal is deposited on a hetero-substrate: under-potential deposition (UPD) and overpotential deposition (OPD). When the deposited metal elements are easy to adsorb on the base material (strong affinity), they tend to UPD. When the deposited metal elements are difficult to adsorb on the base material (poor affinity), they need to be compensated with more electric work to form the bulk phase of the deposited metal element itself at more negative thermodynamic equilibrium potential, that is, OPD. For the bare Cu foil, all the reductive areas are gathered below 0 V versus Li/Li+, corresponding to typical OPD since Cu is a lithiophobic material.[14] Consistently, progressively enlarged Li dendrites are observed on the Cu foil with increased Li plating capacity (Figure 5c). Delocalizing the Li deposition toward a more positive potential range by UPD can be an effective approach to improve the Li deposition uniformity. In our previous work, the uniformity of Li deposition has been greatly improved by UPD of Li adatoms on manganese-based substrate occurring above 0 V versus Li/Li+.[28] Herein, thanks to the close thermodynamic equilibrium potentials between Li and Li-Ag alloy, UPD can occur through Li-Ag alloying above 0 V versus Li/Li+, as shown by the LSV curve on SAM in 1 M Ely (Figure 5a). The reductive redox areas are calculated, and shown in Figure 5b, it can be seem that a large portion of charges related to UPD above 0 V versus Li/Li+ exists for SAM in 1 M Ely, compared with the bare Cu in 1 M Ely. Consequently, the Li-Ag alloying guided Li deposition is much more compact with dendrite-free feature (SAM in 1 M Ely; Figure 5c). With increasing the electrolyte concentration, the electrochemical dynamics on SAM are restricted not only for UPD (1 to 0 V vs Li/Li+) but also for OPD (0 to −0.5 V vs Li/Li+), as shown in Figure 5b. However, the restricted electrochemical dynamics do not affect the Li deposition uniformity. In contrast, the Li deposition becomes even more compact with the increased electrolyte concentration (SAM in 3 M Ely; Figure 5c).
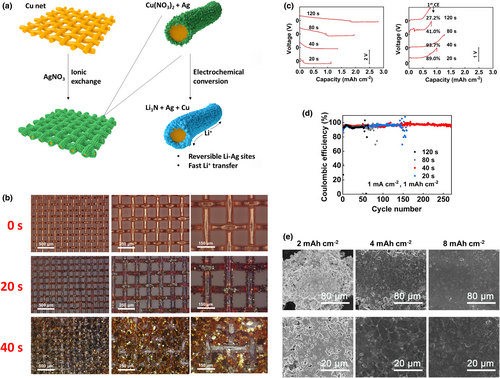
The above results demonstrate the long-lasting Li protection ability of the stabilized bulk Ag structure in high concentration electrolyte. To further advancing the application of the investigated method in LMBs, we have prepared an improved alloying matrix by replacing the model SiO2 net by a commercially available Cu net. Different from the adsorption of Ag+ ions on the skeletons of the SiO2 net, metallic Ag can be directly obtained on the Cu net via ionic exchange reactions, as illustrated in Figure 6a. The ionic exchange reactions between Ag+ and Cu are fast, as shown by the optical observation shown in Figure 6b. Leaf-like Ag already appeared on the skeletons of Cu net at a reaction time of 20 s (Figure S14, Supporting information), providing a low-time costing method to produce the Cu-based alloying matrix (CAM). By increasing the reaction time up to 40 s, the Cu net is entirely covered by the Ag layer, however, still maintaining void spaces for three-dimensional Li deposition (Figure 6b and Figure S15, Supporting information). Beyond the reaction time of 40 s, the produced Ag structure becomes very thick and begins to block the pores of the Cu net (Figures S15 and S16, Supporting information). The latter abuses the void spaces for three-dimensional Li deposition, decreases the initial CE of Li plating/stripping (Figure 6c) and increases the fragility of CAM by scavenging the Cu skeletons. A global view of the structural evolution of CAMs with different reaction times can be represented by the profilometry images (Figure S17, Supporting information). Consistently, the best Li metal cycling stability was achieved on the CAM electrode obtained at an optimal reaction time of 40 s (Figure 6d), which was fixed for the preparation of CAM in the rest of this work. The Li plating morphology on CAM is shown in Figure 6e; compact Li deposits can be maintained up to a practical capacity of 8 mAh cm−2, confirming the great ability to suppress dendrite growth.
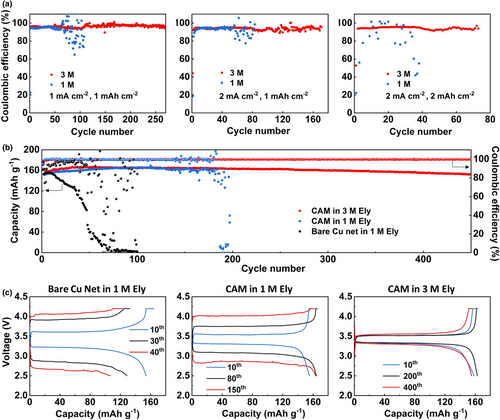
Finally, the CAM electrode was subject to Li metal protection in LMBs. Similar to the case of SAM, better Li cycling stability is achieved on CAM in 3 M Ely than in 1 M Ely. Under 1 mA cm−2–1 mAh cm−2, a long-term cycling over 275 cycles with a high CE of 98% can be obtained for CAM in 3 M Ely, while the cycling fails after 75 cycles for CAM in 1 M Ely (Figure 7a). For more practical conditions of 2 mA cm−2–1 mAh cm−2 and 2 mA cm−2–2 mAh cm−2, significantly improved cycling performances can still be obtained for CAM in 3 M Ely compared with those in 1 M Ely. The application of CAM in full cell was also studied. By merging Li foil and CAM via gently rolling with alumina ceramic rods, the composite anode was then pared with LiFePO4 (LFP) cathode (˜1 mAh cm−2) to construct the Li||LFP full cells. As shown in Figure 7b, for the cell using CAM in 3 M Ely, a high average CE of 99.7% can be achieved over 450 cycles, with a capacity retention >90%. As comparison, the average CEs are 78.7% over 100 cycles and 95.0% over 200 cycles for the cells using bare Cu net and CAM in 1 M, respectively. As shown by the charge–discharge curves of the full cells upon cycling (Figure 7c), despite the lower ionic conductivity of the electrolyte, the polarization of the cell using CAM in 3 M Ely is still lower than the two counterparts during prolonged cycling, indicating that more resistive side products are accumulated on the bare Cu net and CAM in 1 M Ely. These results demonstrate the greatly stabilized Li metal anode by the alloying matrix with Li+ solvation structure-mediated interfacial kinetic. The Li||LFP full cells with a higher cathode loading of ˜3 mAh cm−2 have also been tested (Figure S18a, Supporting information). Consistently, the Li||LFP full cell using Li anode merged with CAM in 3 M Ely outperforms that in 1 M Ely significantly, with a capacity retention of 78.5% at the 150th cycle during the long-term cycling at 0.5C/0.5C, while it is only 47.1% for the cell in 1 M Ely (Figure S18b,c, Supporting information). However, a capacity fading is observed when shifting from the pre-cycling (0.1C, 0.3 mA cm−2) to the long-term cycling (0.5C, 1.5 mA cm−2) for these full cells with higher cathode loading. The latter issue still needs to be resolved by using other advanced electrolytes such as the localized high concentration electrolytes.[29]
3 Conclusion
In this work, we have disclosed a Li+ solvation structure-mediated interfacial kinetic for deeply improving the Li protection ability of Li alloying matrix. Based on a bi-functional Ag-Li3N model interface that can enable fast Li+ conductivity and high Li affinity for dendrite-free Li deposition with both decreased Li nucleation and mass transfer-controlled overpotentials, it was demonstrated that the control of the Li+ solvation structure can influence the durability of the operational Ag sites significantly. Through the wide investigation of ex-/in situ characterizations, it was demonstrated that the diffusivity of Li adatoms inside of the Ag site can be much restricted in the high concentration electrolyte, due to the high energy costing sequence of Li+ desolvation transfer adsorption to the Ag sites in the Li+ mobility-reduced environment. The latter feature can in turn enhance the Li-Ag alloying/de-alloying reversibility and elongate the Li protection ability of the Ag-Li3N interface greatly. By fabricating a Ag-Li3N decorated Cu matrix via a scalable ionic exchange method, then coupling with the high concentration electrolyte, the as-protected Li||LFP full cell (1 mAh cm−2) can reach 450 cycles with a high average CE of 99.7%, in comparison with the average CEs of 78.7% over 100 cycles or 95.0% over 200 cycles for the unprotected cell or the cell only using low concentration electrolyte. This strategy provides fresh and deep insight into the construction of long-term operational alloying matrix for stable high energy density LMBs. The wide combinations of other alloy elements and highly coordinated electrolytes are also expected to build up a pointed materials genome for the protection of alkali metal electrodes.
4 Experimental Section
Preparation of SiO2 nets
Polyvinyl alcohol (PVA, ACROS) was dissolved in deionized water at 14 wt% and stirred at 80°C for 3 h. Ethylsilicate (TEOS, Sinopharm Chemical Reagent Co., Ltd ), deionized water and HNO3 (Sinopharm Chemical Reagent Co., Ltd) were mixed with a molar ratio of 1:4:0.0045 and stirred at room temperature for 3 h to form a uniform silica gel. Then, the prepared silica gel was dropped slowly into PVA solutions with a weight ratio of 3:2 and stirred for another 1 h to obtain the spinning precursor. The as-prepared solution was then electrospun into fibers at a flow rate of 0.5 mL h−1, a voltage of 10 kV and a tip-to-collector distance of 17 cm. The SiO2 net was finally obtained after thermal treatment under 600°C for 2 h at the heating rate of 1°C min−1 in air atmosphere.
Materials
AgNO3, LiPF6, EC, DEC and FEC were purchased from Aladdin. For the preparation of aqueous AgNO3 solutions, the needed AgNO3 powders were first weighted in a drying room and then quickly dissolved in deionized water container. The SAM or CAM matrixes were obtained by immersion of the SiO2 or Cu nets in the aqueous AgNO3 solution at selected concentration. For SAM, the immersion time was fixed at 2 h followed by vacuum drying at 120°C for 12 h. For CAM, the immersion time was controlled as mentioned in the main text and then followed by vacuum drying at 120°C for 12 h. The 1, 2, and 3 M Ely were prepared by mixing the LiPF6 salt and the EC, DEC and FEC solvents in specific molar ratios. All electrolytes were prepared in an argon-filled glovebox with moisture and oxygen contents less than 1 ppm.
Characterizations
Scanning electron microscope (SEM) images and EDS analysis were carried out using a SEM (FEI, QUANTA 250 FEG). The high-resolution microstructures were recorded using a transmission electron microscope (TEM, Tecnai F20, 200 kV). The optical and profilometry images were recorded using a Leica DVM6 microscope. The Raman spectrum was obtained with a Renishaw in Via reflex Raman spectrometer at excitation wavelength of 532 nm from an Nd:YAG (neodymium-doped yttrium aluminum garnet) laser operating at 120 mW. The FTIR spectrum was recorded with a NICOLET 6700 spectrometer. The 7Li NMR spectra were obtained by an AVANCE III 400MHz spectrometer. Surface analysis was carried out with an X-ray photoelectron spectrometer (XPS, Axis Ultra DLD), which was excited by Mg Kα radiation source at a constant power of 100 W (15 kV, 6.67 mA). The ex-situ XRD measurements were conducted using a Bruker D8 advanced diffractometer with a Cu Kα (k = 1.5406 Å) X-ray source. The in situ XRD measurement was carried out on a Bruker D8 Discover two-dimensional X-ray diffractometer coupled with a battery testing system (LandCT2001 from LAND electronics Co, Ltd). The in situ XRD cell was fabricated by punching a 3-mm-diameter window on the positive case of a CR2032 coin cell (Figure S9, Supporting information). Ionic conductivities were measured by using a DDS-307A conductivity meter (LEICI, Shanghai INESA Co.) in a glovebox (MBRAUN, H2O ≤ 0.1 ppm, O2 ≤ 0.1 ppm).
Electrochemical measurements
CR2032 coin cells were used for cell assembly inside an argon-filled glove box. Celgard film 2320 was used as the separator, and 50 µL of electrolyte was added to each cell. The half cells, using SAM as the working electrode and Li foil as both counter and reference electrodes, were assembled for LSV, CV and GITT tests carried out on a potentiostat/galvanostat 1470E from Solartron. The scanning rates for LSV and CV tests were 10 and 0.1 mV s−1, respectively. The EIS measurements were performed under potentiostatic mode, from 1 × 10⁶ to 1 × 10⁻² Hz with a voltage perturbation of 10 mV. For GITT tests, the pulse current of a single GITT titration is 0.5 mA cm−2 and each GITT titration corresponds to a discharge capacity of 0.003 mAh cm−2. For long-term cycling test of Li plating/stripping, desired Li amount was plated on the working electrodes with selected current density, followed by a stripping process up to a cutoff potential of 1 V versus Li/Li+. The Li CEs were calculated as the charge ratio of Listripped/Liplated. The LFP electrode laminates (˜1 and 3 mAh cm−2) were prepared by casting a well-mixed slurry of LFP:Super-P:PVDF (8:1:1) in NMP on aluminum foils followed by vacuum drying at 120°C for 12 h. For Li||LFP full cells, all the cells were pre-cycled for two cycles at charge/discharge rates of 0.1C/0.1C in the voltage window of 2.5–4.2 V versus Li/Li+, followed by cycling at 0.5C/0.5C. All the electrochemical cycling tests were performed using Land BT2000 battery testers.
Acknowledgements
X.W. and K.L. contributed equally to this work. This work was supported by the 21C Innovation Laboratory, Contemporary Amperex Technology Ltd by project No. 21C-OP-202004, the Ningbo S&T Innovation 2025 Major Special Program (Grant No. 2018B10061, 2018B10087, 2019B10044, and 2020Z101), and the National Key R&D Program of China (Grant No. 2018YFB0905400).
Conflict of Interest
The authors declare no conflict of interest.


