Slope effects on the spatial variations in duff moisture
ABSTRACT
Investigations were made on the influence of slope on the spatial variations in duff moisture, the decomposing organic matter of the forest floor. Relationships between duff and soil moisture along hillslopes were identified from field measurements over various moisture conditions. Results indicated that duff moisture is not related to soil moisture, nor is it controlled by a hydraulic gradient. The spatial pattern of duff moisture over a 2 week period was established along two 2 m by 60 m hillslope transects that were sampled every 3 m. Because of interception, tree proximity was found to be the primary factor that significantly influenced the spatial variation in duff moisture. As the duff dried, the influence of tree proximity decreased. The distance from the top of the hillslope was not found to be an important factor in duff moisture variability. The spatial variation in duff moisture is more prominent during periods of wetness because of the exponential nature of the duff drying curve. Copyright © 2011 John Wiley & Sons, Ltd.
INTRODUCTION
The moisture content of decomposing organic matter (duff) on forest floors is an important factor in the forest recruitment process. Duff consumption during forest fires exposes mineral soil that is essential to tree regrowth for certain forest species (Dyrness and Norum, 1983; Zasada et al., 1983, Weber et al., 1987; Charron and Greene, 2002), and the degree and location of that consumption is directly influenced by the spatial variation in moisture content (Frandsen, 1987; Miyanishi and Johnson, 2002). Therefore, understanding the factors that influence the spatial variation in duff moisture can provide insight into the spatial distribution of duff consumption and, therefore, on the forest regeneration process.
Duff water-balance results from precipitation inputs, evapotranspiration losses and moisture fluxes from both the adjacent soil and duff. The largest influence on the duff wetting process is from net precipitation resulting from the interception process. Duff at the tree crown edge or in the gap between tree crowns receives more precipitation than duff under a tree crown (Crampton, 1982; Johnson, 1990; Bouten et al., 1992) resulting in significantly drier duff closer to trees than in the gap between trees (Miyanishi and Johnson, 2002; Hille and Stephens, 2005). Duff has been found to be significantly drier within 40 cm of a tree for a pine/spruce canopy, suggesting that interception affects the spatial variability of duff at the centimetre scale (Raaflaub and Valeo, 2008). In addition, higher tree densities provide increased canopy closure, which will result in decreased duff moisture inputs when similar canopy types are compared. Structural variations between tree species lead to differences in interception patterns and rates. Consequently, duff moisture is also influenced by the tree species present, with considerable differences observed between coniferous and broadleaf canopies (Raaflaub and Valeo, 2008).
Duff drying and moisture loss is also affected by evapotranspiration, and, therefore, primarily determined by meteorological conditions, both above and below the canopy. Thus, tree species, tree density and canopy closure also influence the duff drying process.
Hillslope gradients may also have an effect on duff moisture by redistributing duff moisture spatially. Horizontal movement of water in level duff is normally considered negligible because of the high porosity (Tiktak and Bouten, 1992); however, it is recognised that water will move laterally down a hillslope and collect in depressions making downslope areas wetter than upslope areas (Potts et al., 1983). Duff moisture has been observed to be greater at the bottom of a hillslope than the top (Potts et al., 1983; Samran et al., 1995). Preferential flow paths on hillslopes corresponding to a precipitation event have also been observed for duff, but with short connective distances (McDonnell et al., 1991; Brown et al., 1999; Noguchi et al., 1999; Kim et al., 2005). These preferential flow paths have been attributed to a hydrophobicity of the mineral soil at the base of the duff during dry conditions, inhibiting infiltration (Sevink et al., 1989). Because these preferential flow paths are short, questions arise as to their applicability along an entire hillslope, and accordingly, to a duff hillslope moisture gradient.
Variability in duff moisture might also be influenced by the moisture content of the mineral soil directly underneath, although studies on this interaction have been limited. Mineral soil moisture is influenced by many factors including topography and soil type. Western et al. (1999), Liu and Zhang (2007), Bi et al. (2008) and Ali et al. (2010) found that topography could explain some of the observed soil moisture variability, but only in wet conditions and only at certain scales. Soil type dominated over topographic influences in several studies including Wang et al. (2003) and Western et al. (2004). Penn et al. (2009) found terrain indices to be relatively poor predictors of soil moisture and found other factors such as soil type and land use to dominate soil moisture patterns.
In terms of understanding duff moisture for the purposes of duff consumption prediction, the primary interest is on the duff drying process and on the redistribution of moisture. Given the significance of canopy on duff moisture balance, the development of accurate models of duff consumption and, therefore, the development of accurate models of the spatial distribution of duff moisture should occur at the canopy scale. The purpose of this study is to determine whether hillslope hydraulic gradient is a significant factor in the duff drying process relative to canopy influences at the canopy scale. In this study, canopy scales are lengths comparable with one-half of the crown width of a mature white spruce or lodgepole pine tree.
METHODOLOGY
Study area
A field campaign was designed to observe changes in duff moisture relative to position along a hillslope and relative to proximity to a tree. Data for this study was collected between 20 July and 4 August 2006, near the Biogeoscience Institute in the Kananaskis Valley region of Alberta, Canada (51°02′N, 115°03′W, Elevation 1390 m). The study site has a sandy loam soil type and was primarily composed of a mix of lodgepole pine and white spruce trees. Two 60 m hillslope transects were established for observation, Slope 1 and Slope 2. The bottom of Slope 1 coincided with the top of Slope 2, such that the two transects created an angle of 100° when viewed from above. Each transect was 2 m wide with Slope 1 facing 300°N with a 12% slope, and Slope 2 facing 20°N with an 11% slope. The difference in height from the bottom of Slope 2 to the top of Slope 1 was found by levelling, with measurements made every 3 m in the middle of the transects.
Tree locations
The location and diameter at breast height (DBH) of the trees inside and within 2 m of the edges of each transect were manually measured. The Nearest Neighbour Test for complete spatial randomness was applied to see if the trees were randomly distributed or clumped. This was conducted to provide some measure of canopy extent and influence. Quadrants were used to determine the probability of finding a tree along each hillslope. The size of the quadrants was selected to represent the area occupied by a single tree, represented by the average DBH. The probability of a tree being in a quadrant was determined by dividing the number of quadrants with trees by the total number of quadrants.
More trees were within 2 m of Slope 1 than Slope 2, as shown in Table 1. The trees in both hillslopes were randomly distributed based on the Nearest Neighbour Test (α = 0·05) for complete spatial randomness (Table 1). Table 2 shows the average DBH of the two hillslopes independently, as well as the hillslopes divided up based on the top or bottom half. The average DBH of the trees on both hillslopes is 0·6 ± 0·3 m. Therefore, the 384 m2 (6 m × 64 m) hillslopes were divided into 0·6 m2 quadrants. Table 3 presents the probabilities of finding a tree along each hillslope. The resulting probabilities confirm that there is a higher probability of selecting a tree location on Slope 1 than on Slope 2. They also show that there is no difference in the probability of selecting a tree location at the top and bottom half of Slope 1, but there is a slightly higher probability of selecting a tree location at the top half of Slope 2 than the bottom.
| Slope | Number of trees | Mean nearest neighbour distance | Variance | Z statistic | |
|---|---|---|---|---|---|
| Observed (m) | Expected (m) | ||||
| 1 | 67 | 1·376 | 1·208 | 0·007 | 1·947 |
| 2 | 40 | 1·797 | 1·634 | 0·023 | 1·067 |
| Slope | Location | Number of trees | Average DBH (cm) | Quadrants | Probability of tree | ||
|---|---|---|---|---|---|---|---|
| Total | With trees | Without trees | |||||
| 1 | All | 67 | 54 | 2400 | 67 | 2333 | 0·028 |
| Top | 27 | 46 | 1200 | 34 | 1166 | 0·028 | |
| Bottom | 40 | 60 | 1200 | 33 | 1167 | 0·028 | |
| 2 | All | 40 | 74 | 2400 | 40 | 2360 | 0·017 |
| Top | 16 | 75 | 1200 | 23 | 1177 | 0·019 | |
| Bottom | 24 | 74 | 1200 | 17 | 1183 | 0·014 | |
- DBH, diameter at breast height.
| Slope | Location | Number of moisture measurements | Number of tree moisture measurements | p | |
|---|---|---|---|---|---|
| Observed | Percent of total (%) | ||||
| 1 | All | 42 | 5 | 12 | 0·005 |
| Top | 21 | 1 | 5 | 0·335 | |
| Bottom | 21 | 4 | 19 | 0·002 | |
| 2 | All | 42 | 9 | 21 | <<0·001 |
| Top | 21 | 8 | 38 | <<0·001 | |
| Bottom | 21 | 1 | 5 | 0·224 | |
The actual number of tree measurement locations along both hillslopes contradicts the established probability. There are more tree measurement locations on Slope 2 than Slope 1, there are more tree locations on the bottom of Slope 1 than the top, and there are a lot more tree locations on the top of Slope 2 than the bottom. Table 3 shows the tree location counts for the two hillslopes, along with the probability of getting these tree location counts based on the probabilities calculated in Table 2. The probabilities in Table 3 reveal that slightly more tree locations than expected were found on Slope 1, with more being observed on the bottom half of the hillslope. More importantly, the probabilities show a lot more tree locations were found on Slope 2 than would be expected, particularly on the top half of the hillslope.
Moisture measurements
Profile probe measurements were made to determine the trend in soil moisture both with depth and along the two hillslopes. Profile probe access tubes were installed 3 m from both transects' edges at the top, middle and bottom of the two transects. Because of the orientation of the two transects, three access tubes were installed at the bottom of Slope 1 and the top of Slope 2, resulting in a total of 11 tubes. Profile probe moisture contents were measured at depths of 10, 20, 30, 60 and 100 cm. The exception to this was two locations on Slope 1, Top Right and Middle Left, where difficulty in installing the access tubes did not allow for the full insertion to the 1 m depth. In these cases, measurements were taken at 10, 20, 50 and 90 cm. Profile probe measurements of soil moisture were made daily over the 16 days. For analysis purposes, the readings on either side of the transect at each hillslope location at the same depth were averaged, resulting in a single daily moisture value for the top, middle and bottom of each hillslope at the different depths. These daily values were then averaged to provide single 16 day average moisture content at each depth and hillslope location.
Daily point measurements of duff moisture were made using a Delta-T ThetaProbe (Delta-T Devices Ltd, Cambridge, UK) every 3 m along each edge of the two transects, representing a moisture grid along the transects. In addition, daily noon moisture measurements were logged at the top of Slope 1 (Top 1), the bottom of Slope 1 and top of Slope 2 (Middle) and the bottom of Slope 2 (Bottom 2).
At each hillslope location, Delta-T ThetaProbes were also installed horizontally in the soil directly below the duff layer (the soil layer), horizontally in the duff directly above the soil layer (lower duff), horizontally in the duff just below the duff surface (upper duff) and vertically through the top of the duff (vertical duff). This was conducted to assess any relationship between soil moisture and moisture in various duff layers along a hillslope. The number of sensors installed at each location is given in Table 4. All sensors at a given slope location were installed within 20 cm of each other, with sensors at the same depth inserted next to each other. The depth of the duff at Top 1, Middle and Bottom 2 was 10, 8 and 13 cm, respectively. Duff is very heterogeneous even over small areas, which can result in considerable differences in moisture measurements even when samples are taken next to each other. Because the objective of the daily noon day values was to investigate the differences along the hillslope and not the differences within 20 cm, average moisture values were used at locations where there were multiple sensors at the same location. In all cases, duff specific calibration was applied (Raaflaub and Valeo, 2009a).
| Sensor location | Number of ThetaProbes | ||
|---|---|---|---|
| Top 1 | Middle | Bottom 2 | |
| Vertical duff | 1 | 3 | 1 |
| Upper duff | 2 | 2 | 2 |
| Lower duff | 2 | 2 | 2 |
| Soil | 1 | 2 | 1 |
Meteorological measurements
Hourly precipitation was obtained from the meteorological station at the University of Calgary Biogeoscience Institute (referred to henceforth as the Field Station). Meteorological conditions measured at this institute are used to represent above canopy conditions. In addition to this, throughfall was also monitored using tipping bucket rain gauges at the top and bottom of both Slope 1 and Slope 2. In all cases, the rain gauges were installed at least 1 m away from the closest tree and were provided to give a relative indication of the amount of throughfall experienced by the duff. Because the number of rain gauges was limited, exact throughfall values could not be extracted.
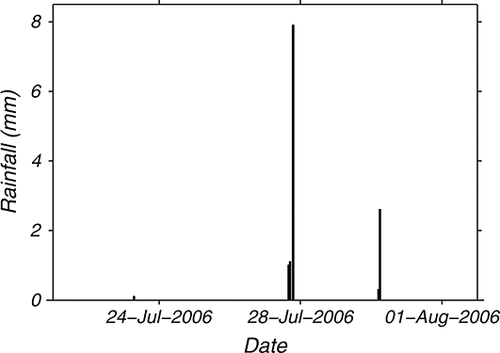
Figure 1 shows the two rainfall events that occurred during the field campaign, one on 28 July with 10 mm in 3 h, and one on 30 July with 2·9 mm in 2 h. Throughfall measured at Top 1, Middle and Bottom 2 ranged from 20% to 90% for these two events. Interception was greater for the second rainfall event at all locations because of the lower intensity of rainfall. Interception was found to be greater at Middle, followed by Top 1 and lastly by Bottom 2. This is reflected in an increased tree density at Middle as compared with Bottom 2.
RESULTS
Continuous moisture measurements
The results of the continuous noon measurements of duff and soil moisture content are shown in Figure 2. The absence of data for Bottom 2 before 24 July was a result of the sensors being pulled out of the ground by an animal and subsequently being replaced. Because the sensors could not be placed in exactly the same location, only the data after the reinstallation are included. The continuous noon measurements show that all layers and locations responded immediately to the first rainfall event on 28 July with an increase in moisture content, but only the vertical duff showed an increase in moisture content following the second rainfall event on 30 July. The soil layer consistently had moisture values that were lower than any of the duff layers, whereas the lower duff layer tended to have higher moisture content than its corresponding upper layer. However, the moisture content of the upper and lower layers overlapped when the two sample sites were compared. There was no consistency when vertical duff moisture was compared with the upper and lower duff moisture. These observations reflect the variability in duff moisture, and also the presence of a vertical moisture gradient within the duff layer.
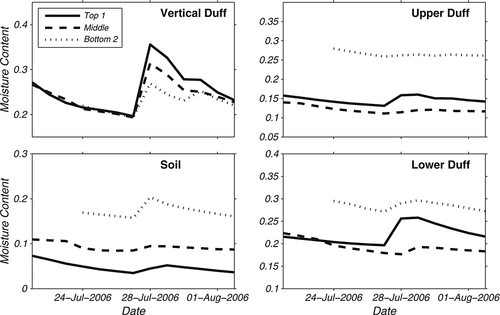
When comparing along the hillslope, the soil is the only layer to exhibit a pattern consistent with a hydraulic gradient; that is, the bottom of the hillslope is the wettest and the top of the hilllslope is the driest. Both the upper and lower duff layers were wettest at the bottom of the hillslope, but the middle of the hillslope was the driest, not the top. The vertical duff showed the opposite trend as the soil at the top of the hillslope was the wettest and the bottom the driest. The discrepancies in the moisture trends along the hillslope between the soil and duff layers indicate that the soil moisture does not have a predominant influence on duff moisture.
Profile probe moisture measurements
The averages of the moisture measurements made over the study period, along with their standard deviations, are shown in Figure 3. For both slopes at all locations, there is an increase in moisture content with depth, which is an expected trend. What is not clearly observed at any depth for either hillslope is a moisture gradient with the top of the hillslope being drier than the bottom. In some instances, the middle of the hillslope is the wettest, whereas in others it is the driest. Averaging is not the cause of the differences, because no pattern was found when daily values were compared with each other, and with the rainfall events. Therefore, it is unlikely that a topographic wetness index (Beven and Kirkby, 1979) representation of slope would be applicable for modelling soil moisture in this area.
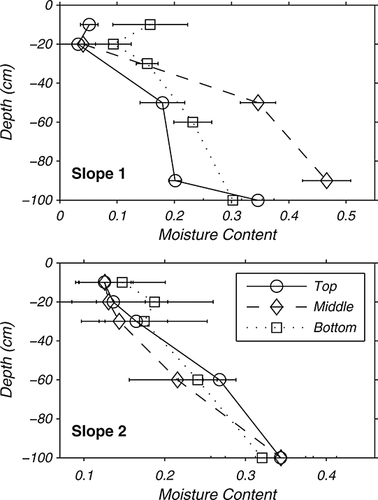
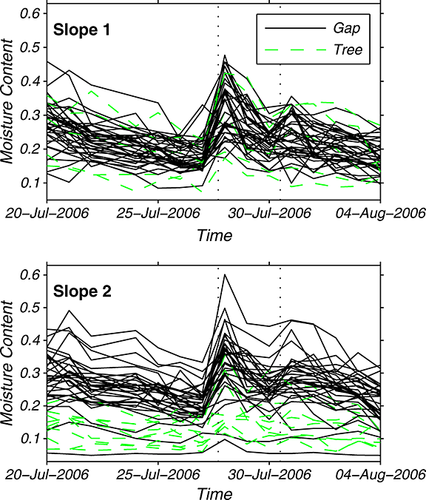
Figure 4 traces the moisture content of each measurement location over time for Slope 1 and 2. This figure depicts large variations in moisture content with the goal of illuminating any specific patterns or trends that may exist. Specifically delineated in this figure are the gap and tree measurement locations. Tree locations are those sites that are within 40 cm of a tree [as defined in Raaflaub and Valeo (2008)], whereas gap locations represent all other sites. Slope 2 clearly exhibits a moisture pattern based on tree proximity, tree locations tend to be drier than gap locations. The same pattern is not clearly defined in Slope 1; however, this could be related to the limited number of tree locations. For Slope 1, there were only five tree locations, whereas Slope 2 had nine.
When the average moisture contents of the two hillslopes for each day of measurement are compared, there is no significant difference, indicating that these two hillslopes are hydrologically similar. However, when the moisture content is traced along the transects for each day of measurement (Figure 5), a difference is observed between the two hillslopes. Slope 1 does not show a moisture trend with hillslope position, whereas Slope 2 does. For Slope 2, there appears to be a general increase in moisture content downslope, indicating a duff moisture gradient.
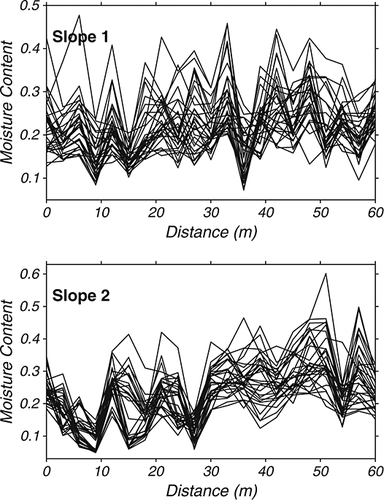
Because tree proximity had been previously shown to significantly influence duff moisture, it was also thought to be a possible cause for the gradient difference between the two slopes. As stated above, Slope 2 had more tree locations than Slope 1, and Slope 2 showed a clear moisture trend with tree proximity, whereas Slope 1 did not. In addition, more tree measurement locations were found on Slope 2 than would be expected, especially at the top half of the hillslope. It is possible, therefore, that the tree locations are preventing moisture from reaching the duff along Slope 2.
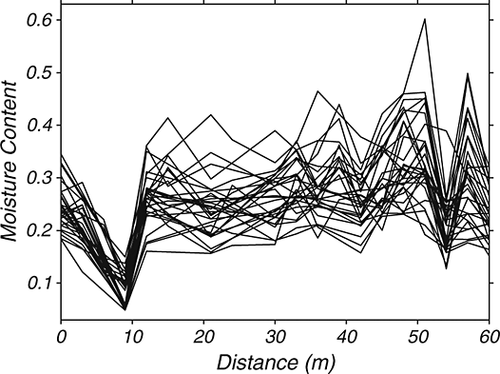
Figure 6 is the same plot as Figure 5 for Slope 2, showing the moisture content traced along the transects of Slope 2 for each day of measurement. However, in Figure 6, the tree measurement locations have been removed. Once the tree measurement locations are removed, the apparent moisture trend with hillslope position disappears. The moisture hillslope gradient was simply an artefact of a higher than expected number of tree measurement locations. Tree locations are shown to have lower duff moisture than gap locations and are also shown to be the most influential factor on duff moisture, even along hillslopes.
DISCUSSION AND CONCLUSIONS
Duff moisture measurements were conducted to determine if there was a relationship between the moisture content of the duff and the mineral soil. Numerous models and research have been applied to the estimation of mineral soil moisture content. Therefore, if a simple and direct relationship between duff and mineral soil moisture could be established, then it might be possible to use mineral soil moisture models to determine duff moisture. Conflicting patterns of both the duff moisture along the hillslopes studied and the relationships with mineral soil moisture do not suggest that a simple relationship between duff and mineral soil moisture along a hillslope is workable. Duff moisture does not appear to be influenced by a hillslope hydraulic gradient, which is normally expected along hillslopes. However, the data also questions the applicability of a hilllslope hydraulic gradient in the mineral soil in this study. From the study's observation that wetter mineral soil does not always result in wetter duff, it appears that the mineral soil does not directly influence duff moisture.
 (1)
(1) (2)
(2)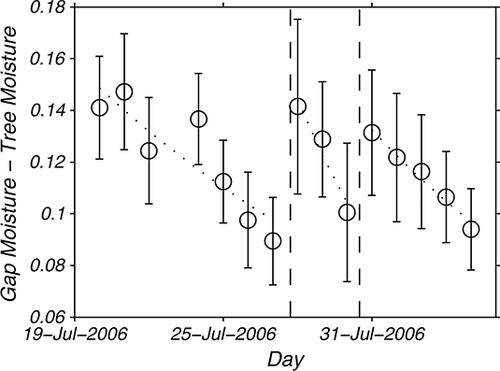
Applying Equation 1 to the three drying events and resetting the time to zero after each rainfall event, results in an average drying rate, k, of 0·10 ± 0·08 day−1. The average drying rate to the gap-tree difference for drying events 1, 2 and 3 using Equation 2 is, 0·08 ± 0·12 day−1, 0·17 ± 0·11 day−1 and 0·08 ± 0·03 day−1. The drying rates found by applying Equation 1 and 2 are the same within the uncertainty. Therefore, Equation 2 does describe the decrease in the gap-tree moisture difference as duff dries, confirming that the decrease in duff moisture variability as duff dries is a result of the exponential form of the duff drying curve. This indicates that the spatial variability in duff moisture is only a concern when the duff is wet.
Tree proximity, a factor that describes the impact of interception, should be used when spatial models of duff moisture are desired. The influence of tree proximity decreases as duff dries, and as a consequence, the spatial variation in duff moisture decreases as duff dries and increases after precipitation events. Because fires tend to occur during periods of dryness, this may imply that highly, spatially distributed modelling of duff moisture may not be warranted when researching the forest regeneration processes.
Tree proximity does not explain all the spatial variation observed in duff moisture, as demonstrated by the large variation of moisture content along Slope 2 in Figure 6. The heterogeneous nature of duff and the large variation in duff hydraulic properties (Raaflaub and Valeo, 2009b) can account for moisture variations, but there may be other unconsidered factors. Of particular interest is the influence of microtopography. A forest floor is not a smooth surface, but a surface with great variability in microtopography that includes many little valleys and peaks. Although duff moisture was not found to be influenced by long hillslopes, it may be influenced by microtopography. Because of the high hydraulic conductivity of the duff (Raaflaub and Valeo, 2009b) as compared with the mineral soil, water could infiltrate through the duff to the surface of the mineral soil, travel along the duff-mineral soil boundary and collect in the microtopographic valleys. Duff moisture content in these microtopographic valleys would be higher than in the microtopographic peaks, resulting in centimetre scale variation that is not directly related to tree proximity. The direct influence of microtopography on duff moisture requires further study.


