Water conservation potential of modified turf grass irrigation in urban parks of Phoenix, Arizona
Funding information: Metropolitan Water District of Southern California; City of Phoenix; Central Arizona Project
Abstract
Large amounts of water are consumed by urban parks in arid regions such that efficient irrigation practices are needed. In Phoenix, Arizona, extensive turf grass areas are supported using flood or sprinkler irrigation that also require fertilizers. Residential green waste compost has the potential to serve an alternative fertilizer if its higher costs can be offset through water conservation. In this study, we conducted an ecohydrological monitoring and modelling effort for a compost experiment in two urban parks with either flood or sprinkler irrigation. Soil moisture, evapotranspiration and turf greenness data along with a soil water balance model were used to determine if compost treated plots were different from control plots in each park. After building confidence in the model through comparisons to data, we created long-term scenarios to explore differences between flood and sprinkler irrigation practices and analyse the effect of changes in irrigation scheduling. Multiple lines of evidence indicated that green waste compost applications did not appreciably change soil moisture or vegetation conditions in either urban park. Major differences, however, were noted between the two irrigation practices in terms of the seasonality of the soil water balance, plant water stress and the sensitivity to interannual fluctuations in precipitation. Model scenarios showed that significant irrigation reductions from 15% to 30% could be achieved, in particular with small changes in watering depths. As a result, irrigation management in urban parks can meet water conservation targets that potentially offset green waste compost costs while also benefitting the soil water balance through reductions in water losses.
1 INTRODUCTION
The Southwestern United States is a hot and arid region with a population that is expected to grow by ~70% by mid-21st century, which could potentially lead to additional water stress (Garfin et al., 2014; McDonald, 2010). While most of the water in the region is used by agriculture, a considerable and growing amount is consumed by green infrastructure in urban areas (Gleick, 2010; Pataki et al., 2011) such that efficient outdoor water use practices are needed. Prior studies suggest that urban irrigation approaches that account for climate, soil conditions and vegetation requirements could potentially lead to water conservation (Quesnel et al., 2019; Volo et al., 2014; Volo et al., 2015). However, water conservation might also negatively impact a multitude of beneficial ecosystem services provided by green areas, including heat amelioration, aesthetics, recreational use and property values (e.g., Beard & Green, 1994; Gober et al., 2010; Larson & Perrings, 2013; Vivoni et al., 2020; Yabiku et al., 2008). As a result, reductions in outdoor water use need to be considered in light of other constraints on residents, community organizations and municipal agencies that manage urban irrigation (e.g., Grimm et al., 2008; Wang, Turner, et al., 2021).
In the City of Phoenix, Arizona, 40% to 88% of residential water use may be applied towards outdoor landscaping (Balling et al., 2008), with a large proportion used for maintaining non-native plants such as turf grasses that are typically arranged with a few trees (e.g., Hirt et al., 2008; Larson et al., 2009; Templeton et al., 2018). While per capita water use in Phoenix has been reduced by ~15% from 1980 to 2005 through conservation programmes, outdoor use remains high (Balling & Gober, 2007), partly since irrigation is rarely adjusted in response to weather conditions (Martin, 2008). In Phoenix, warm season turfs composed of perennial grasses, such as bermudagrass (Cynodon dactylon), are maintained through either flood or sprinkler irrigation practices (Brown et al., 2001). The selection of irrigation type depends on a number of factors, including historical legacies, infrastructure and resident choices (Larson et al., 2017), and have been shown through modelling to have a strong influence on the components of the soil water balance (Volo et al., 2014). In particular, changes to irrigation amounts or frequency have the potential for conserving outdoor water use, while minimizing impacts to turf grass health.
In addition to substantial watering, warm season turf grasses require the use of fertilizers that are often sourced from manufactured chemicals (e.g., Milesi et al., 2005; Robbins & Sharp, 2003). More recently, there has been a growing interest in using residential green waste compost as an alternative. This is attractive in Phoenix due to the substantial amounts of plant trimmings generated in residential yards, common areas, and parks (Martin, 2008). In response, the City of Phoenix invested in composting facilities (Coker, 2017) whose products are a potential fertilizer source for urban parks and for other markets within a circular economy paradigm (Buch et al., 2018). In addition to a lower use of traditional fertilizers, the application of green waste compost in turf grass areas might provide the additional benefit of conserving soil water, as prior studies have identified this potential under certain conditions (Weindorf et al., 2006; Zemánek, 2011). Nevertheless, the efficacy of this alternative fertilization strategy in urban park settings has yet to be established for different types of irrigation practices.
In this study, we conducted an ecohydrological monitoring and modelling effort in the context of a compost experiment in two urban parks with representative flood and sprinkler irrigation practices in Phoenix, Arizona. Soil moisture and turf grass observations along with a physically based soil water balance model were used to determine if compost treated plots were different from control plots. After calibrating and testing the model against soil moisture and evapotranspiration data, we analysed a series of long-term scenarios to determine the water conservation potential of modified irrigation schedules. Alternative scenarios were designed based on a water reduction target linked to the economic viability of green waste compost and subsequently assessed based on the simulated water balance components and turf grass stress. Throughout the effort, a close coordination with the City of Phoenix Parks and Recreation Department allowed for placing the data analyses and modelling scenarios in a real-world management context and providing solutions tailored to the challenges faced by practitioners to promote their adoption. We expect this study will yield insights on the utility of green waste compost and alternative irrigation scheduling for urban water conservation and thereby inform other circular economy efforts. This work also illustrates how observational and modelling approaches can be integrated with experimental manipulations in urban settings to study ecohydrological processes that are driven by management decisions.
2 STUDY SITES
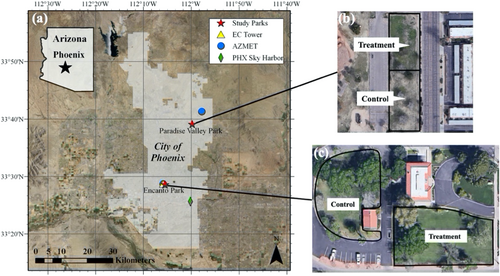
Two urban parks were selected based on their varying types of irrigation and the prior establishment of control and treatment plots for compost additions. Paradise Valley Park (PV) in north Phoenix has a large turf grass area that receives sprinkler irrigation, while Encanto Park (EN) in central Phoenix receives flood irrigation within turf grass areas next to the historical Norton House (Figure 1). Table 1 provides the general characteristics of each study park. Both sites contain a few shade trees but are primarily covered by bermudagrass maintained by the Parks and Recreation Department of the City of Phoenix. At both parks, control (C) plots with no compost additions were situated near compost treatment (T) plots that received green waste compost twice per year in the fall and spring from 2015 to 2019. For each date, ~0.6-cm-depth compost was applied as a topdressing and incorporated into the turf grass surface with a drag mat. Turf grass at the study parks experienced two main seasons: (1) an active growing period (or ‘Warm Season’, defined here as 1 April to 30 September) with warm temperatures, frequent irrigation and high lawn maintenance and (2) a dormant period (or ‘Cool Season’, 1 October to 31 March) with cooler temperatures, less frequent irrigation and lower mowing requirements.
| Study park | Latitude (dd) | Longitude (dd) | Elevation (m) | Area (km2) | Soil texture | Irrigation type | Duration (days) | Start and end dates |
|---|---|---|---|---|---|---|---|---|
| Paradise Valley Park | 33.6522° | −111.9966° | 456 | 0.17 | Loam | Sprinkler | 615 | 12/04/18–08/10/20 |
| Encanto Park | 33.4771° | −112.0920° | 334 | 0.11 | Loam | Flood | 679 | 09/28/18–08/07/20 |
Both study parks have relatively flat topography due to their locations on an alluvial fan surface (0 to 3% slope at PV) and an alluvial plain (0 to 1% slope at EN), with well-drained soils of loamy texture (Table 1, Gilman and Mohall series at PV and EN, respectively). Initial construction and several decades of soil and water treatments have modified conditions at both sites, in particular at EN where plots are below-grade to allow for flood inundation. Climate at the parks is classified as hot desert (Köppen BWh) with a low average annual precipitation (P) of 190 mm/year, as measured at Phoenix Sky Harbor Airport (1950–2018, Templeton et al., 2018). As shown in Table 2, a bimodal regime leads to higher amounts of precipitation in the cool season as compared to the warm season, though interannual variability in seasonal precipitation is large (Mascaro, 2017). Weather data at each park were monitored through nearby stations from the Arizona Meteorological Network (AZMET, Desert Ridge and Phoenix Encanto sites, Figure 1). Over the period 2003 to 2018, the two weather stations had small differences in precipitation (Table 2), which are attributed to an elevation gradient of 122 m over a distance of 27 km (Kindler, 2021). Similarly, modest differences are present in reference evapotranspiration (ETo) which measures atmospheric demand (1648 and 1513 mm/year at PV and EN, respectively), as estimated by AZMET (https://cals.arizona.edu/AZMET/). The low P and high ETo at the study parks necessitate the use of irrigation for supporting turf grasses.
| Phoenix Sky Harbor Airport | Desert Ridge AZMET | Phoenix Encanto AZMET | |||||
|---|---|---|---|---|---|---|---|
| Season | Month | Average P (1950–2018) (mm) | % Annual | Average P (2003–2018) (mm) | % Annual | Average P (2003–2018) (mm) | % Annual |
| Cool | Oct. | 14.00 | 7.47% | 11.51 | 5.28% | 8.76 | 4.67% |
| Nov. | 14.85 | 7.93% | 16.18 | 7.43% | 15.16 | 8.08% | |
| Dec. | 20.94 | 11.18% | 28.43 | 13.05% | 17.95 | 9.56% | |
| Jan. | 20.27 | 10.82% | 31.43 | 14.42% | 21.57 | 11.49% | |
| Feb. | 17.90 | 9.56% | 28.40 | 13.03% | 22.83 | 12.16% | |
| Mar. | 21.12 | 11.27% | 20.49 | 9.40% | 12.56 | 6.69% | |
| Subtotal | 109.80 | 58.23% | 136.44 | 62.62% | 98.83 | 52.64% | |
| Warm | Apr. | 6.49 | 3.46% | 7.79 | 3.58% | 5.90 | 3.14% |
| May | 3.33 | 1.78% | 3.98 | 1.83% | 3.25 | 1.73% | |
| Jun. | 2.24 | 1.20% | 0.63 | 0.29% | 3.97 | 2.11% | |
| Jul. | 22.98 | 12.27% | 24.49 | 11.24% | 23.32 | 12.42% | |
| Aug. | 25.88 | 13.82% | 29.03 | 13.32% | 37.35 | 19.90% | |
| Sep. | 17.32 | 9.25% | 15.54 | 7.13% | 15.11 | 8.05% | |
| Subtotal | 78.24 | 41.77% | 81.46 | 37.38% | 88.90 | 47.36% | |
| Total | 187.32 | 100.00% | 217.90 | 100.00% | 187.73 | 100.00% | |
3 METHODS
3.1 Soil moisture and evapotranspiration measurements
We deployed soil moisture and precipitation sensors at the control and treatment plots in each park during two warm and two cool seasons from 2018 to 2020 (Table 1). Each station included four soil dielectric impedance sensors (HydraProbe, Stevens, Portland, OR), buried at depths of 5, 15, 30 and 50 cm capturing the turf grass root zone depth over 60 cm, and a tipping bucket rain gauge (TE525-L, Texas Electronics, Dallas, TX) installed at 2 m height, connected to a datalogger (CR800, Campbell Scientific, Logan, UT) powered by a solar panel and battery. Siting of each station involved interactions with the Parks and Recreation Department to ensure minimum disturbance of park activities and the replacement of turf grass after installation. Where needed, a fence was placed around a station to protect equipment. Volumetric soil moisture (θ in m3/m3) was obtained from continuous voltage readings at 30-min resolution after applying a calibration relation derived for each park (Kindler, 2021). Daily aggregations of θ (averaged) and P (total) were conducted to match the temporal resolution of the soil water balance model. In addition, a depth average of daily θ over the soil profile (0 to 60 cm) was obtained using a weighting scheme (weights of 0.15 at 5 and 15 cm and 0.30 for the 30- and 50-cm sensors), following Templeton et al. (2014). Daily, profile-averaged θ at the control and treatment plots of PV and EN parks were used to test the model. We also tested θ differences between C and T plots using the Wilcoxon signed-rank test at a 5% significance.
For model forcing, we used daily P and ETo from the two AZMET stations due their long-term records. ETo was estimated following the procedure outlined by Brown et al. (2001) based on the Penman–Monteith equation applied to well-watered turf grass. The method requires daily net radiation, atmospheric and vapour pressure, wind speed, and air temperature which were estimated at the AZMET stations. Actual evapotranspiration (ETt) at each park was obtained as ETt = KcETo and used to verify the soil water balance model. This followed the monthly crop coefficients (Kc) of Brown and Kopec (2014) that include considerations of turf type and quality, with values ranging from 0.60 to 0.89. To corroborate ETt, we deployed an eddy covariance (EC) tower next to the Phoenix Encanto AZMET station, as documented by Vivoni et al. (2020). Similar EC studies in Phoenix by Chow et al. (2014), Templeton et al. (2018) and Pérez-Ruiz et al. (2020) have illustrated the value of the approach for studying the impact of irrigation. Daily values of evapotranspiration obtained from the EC tower were available over the period 16 March 2019 to 15 July 2020. Due to the shorter record as well as differences in turf grass management at the AZMET station, the EC measurements are only used to corroborate ETt.
3.2 Vegetation and irrigation data sets
We monitored turf grass conditions using photographs at control and treatment plots taken at similar viewing angles during monthly intervals (Kindler, 2021). We also processed high spatiotemporal resolution data on the Normalized Difference Vegetation Index (NDVI) from Planet Labs, a commercial satellite operator (Planet Team, 2017) to quantify turf grass conditions. The Planet surface reflectance product (3 m, daily resolution, Level 3B Ortho Scene Product) in four spectral bands (Red, Green, Blue and Near Infrared) were obtained from a constellation of >130 active Cubesats deployed in a sun synchronous orbit at the height of 475 km and with an overpass time from 9:30 to 11:30 AM in Phoenix. NDVI was obtained as (Red − NIR)/(Red + NIR), where Red and NIR are the Red and Near Infrared bands. Bias correction was used to adjust NDVI to match coincident values from Landsat 8 which have been used often in Phoenix (e.g., Buyantuyev et al., 2007). Available scenes during the study period were then linearly interpolated using the approach of Chen et al. (2004) to produce a smoothened daily time series averaged for selected pixels in the control and treatment plots. We tested differences in daily NDVI at the C and T plots in each park using the non-parametric Wilcoxon signed-rank test at 5% significance level.
Irrigation practices varied at the two study parks necessitating a different approach for estimating daily irrigation (I) as a model input (Volo et al., 2014). An automated sprinkler system at PV delivered frequent and small irrigation amounts to the control and treatment plots, while EN was periodically inundated with large watering depths at C and T plots. Both sprinkler and flood irrigation techniques were adjusted during the warm and cool seasons, with monthly irrigation volumes reported by the Parks and Recreation Department. Monthly totals at each park were converted to watering depths using the area of turf grasses under irrigation (Table 1) and subsequently distributed into daily values using the following information: (1) flood irrigation dates, (2) recorded changes in shallow soil moisture and (3) unintended measurement of sprinkler water by rain gauges at the plots. The latter required use of the AZMET stations for P. As noted by Volo et al. (2014) and Wang, Vivoni, et al. (2021), obtaining reliable irrigation information is one of the principal challenges for modelling urban areas with differing landscaping designs.
3.3 Soil water balance model
3.4 Model parameterization, calibration and validation
To model s at the control and treatment plots of each study park, estimates of daily P, ETo and I were provided as model forcings. For model calibration and validation purposes, the profile-averaged volumetric soil moisture (θ) data over the root zone Zr = 60 cm were converted to s using specific values of porosity at each park: (1) at PV, n = 0.43 based on soil laboratory analyses, and (2) at EN, n = 0.66 based on the maximum observed θ during flood irrigation (Kindler, 2021). Similarly, simulated ET was compared to daily ETt estimates from the AZMET stations. Comparisons of simulated and observed s and ET were carried out visually as daily time series and frequency distributions as well as through the use of goodness of fit measures, root mean squared error (RMSE), correlation coefficient (CC) and bias ratio (B), with the latter defined as the ratio of the average of the simulated values divided by the average of the observed values. Model calibration was conducted at the C plots for a full year (4 November 2018 to 3 November 2019 at PV; 28 September 2018 to 30 September 2019 at EN) to capture one cool season and one warm season. Initial values of s for the calibration period were obtained from the observed records on the first day. The remainder of the periods (4 November 2019 to 10 August 2020 at PV; 1 October 2019 to 7 August 2020) were reserved for model validation at the control plots (e.g., one cool and one warm season). Simulations at the T plots were performed with the calibrated parameters to test the model transferability under the presence of the compost treatment. We postulated that if parameters were transferable through visual and statistical comparisons of simulated and observed s at T plots, then the soil water balance model worked equally well at both plot types and the effect of compost on simulated s was limited.
Following Volo et al. (2014), we applied the Shuffled Complex Evolution algorithm of Duan et al. (1993) to calibrate the soil and vegetation parameters at the control plots (e.g., sh, sw, s*, sfc, b, Ks and Ew). n and Zr were fixed based on soil properties and the rooting depth for bermudagrass (Fuentealba et al., 2015) which matched well with the sampling depth interval of θ. The automated method searched for globally optimal parameter values in a multidimensional space through clustering, shuffled complexes and competitive evolution strategies. We applied the minimization of RMSE between observed and simulated s over the calibration period at each control plot as the objective function. Up to 100 independent calibrations were performed for each C plot, with each calibration consisting of 10,000 model runs. The initial parameter bounds were chosen based on relevant literature values (Laio et al., 2001; Manfreda et al., 2010; Porporato et al., 2003; Vico & Porporato, 2010; Volo et al., 2014) and adjusted to avoid retrieving a parameter value equal to a limit of its range or overlapping with another parameter range. Since convergence was achieved during the optimization, we obtained averages of each parameter across the calibration runs (Table 3) and used these in the subsequent modelling activities. Model validation at the C plots utilized the s at the end of the calibration period as an initial state, while the validation at the T plots relied on the observed records of s for the initial day.
| Paradise Valley Park | Encanto Park | |||||||
|---|---|---|---|---|---|---|---|---|
| Parameter | Units | Symbol | Min. | Average | Max. | Min. | Average | Max. |
| Hygroscopic point | (−) | sh | 0.04 | 0.10 | 0.16 | 0.10 | 0.10 | 0.10 |
| Wilting point | (−) | sw | 0.20 | 0.20 | 0.20 | 0.66 | 0.67 | 0.68 |
| Stress threshold | (−) | s* | 0.42 | 0.42 | 0.42 | 0.71 | 0.73 | 0.73 |
| Field capacity | (−) | sfc | 0.43 | 0.61 | 0.82 | 0.74 | 0.74 | 0.74 |
| Pore size distribution index | (−) | b | 5.80 | 7.48 | 8.98 | 10.85 | 10.85 | 11.05 |
| Saturated hydraulic conductivity | (mm/day) | Ks | 171.68 | 255.18 | 320.77 | 289.42 | 289.42 | 295.54 |
| Wilting point evaporation | (mm/day) | Ew | 0.17 | 0.17 | 0.17 | 1.50 | 1.50 | 1.50 |
3.5 Numerical simulations and scenarios
To explore a wider range of climatic conditions, we conducted long-term simulations at the C plots using meteorological forcings from AZMET stations (2003–2018, 15 water years, 1 October to 30 September). This period corresponds to the availability of ETo from the approach of Brown et al. (2001). For a subset of analyses, we selected the driest (2017–2018), an average (2012–2013) and the wettest (2004–2005) years with respect to mean annual precipitation (Table 4). Due to limited irrigation data for the 15-year period, we repeated the daily irrigation records from 2018 to 2019, such that interannual variations in forcing were driven only by changes in P and ETo. The 15-year periods at the study parks were then used to conduct two sets of irrigation scenarios: (1) variation of annual irrigation totals using the temporal distribution of the first cool and warm seasons and (2) variation of the irrigation depth or frequency corresponding to cases of interest to the Parks and Recreation Department as identified through stakeholder meetings. While more complex irrigation scenarios are possible (e.g., Vico & Porporato, 2011a, 2011b; Volo et al., 2015), we were guided by practitioner feedback on operationally feasible approaches. Four cases were tested: (1) the current schedule and magnitude of events, (2) an 18% reduction in irrigation magnitude, (3) a reduction in irrigation by changing the warm season frequency and (4) a 30% reduction in irrigation magnitude. Irrigation reductions were based on a water savings potential that could offset the additional cost of compost treatments, as compared to traditional fertilizers. For the scenarios, we quantified monthly soil moisture dynamics (s), water balance components (P, I, ET, L and Q), and the dynamic water stress ( ) for cool and warm seasons.
| Year | Desert Ridge AZMET | Phoenix Encanto AZMET | ||||
|---|---|---|---|---|---|---|
| Cool season (mm) | Warm season (mm) | Annual total (mm) | Cool season (mm) | Warm season (mm) | Annual total (mm) | |
| Dry: 2017–2018 | 77.96 | 36.82 | 114.78 | 52.31 | 59.70 | 112.01 |
| Average: 2012–2013 | 72.90 | 143.48 | 216.38 | 67.55 | 90.66 | 158.21 |
| Wet: 2004–2005 | 104.15 | 291.07 | 395.22 | 106.43 | 233.41 | 339.84 |
4 RESULTS
4.1 Soil moisture, evapotranspiration and vegetation observations
Figure 2 illustrates the daily variations in P, θ and ETo during the study periods at the control and treatment plots at PV and EN. Note that most of the precipitation was concentrated during the cool seasons (95% of annual total), which were anomalously wet (187% of 2003–2018 values), whereas the warm seasons exhibited lower-than-average P (14% of 2003–2018). While profile-averaged θ reacted to storms in the cool seasons, the primary response was to irrigation events in each park. Based on water use records, irrigation accounted for 81% and 85% of water input (P + I) at the PV and EN study parks, respectively. At PV, frequent warm season sprinkler use resulted in small, daily increases in θ, whereas flood irrigation at EN led to larger pulses in θ spaced about 2 weeks apart. Reductions in θ after each irrigation were driven by high values of ETo during the warm season (average of 6.2 mm/day across both parks), while cool season ETo was more modest (2.3 mm/day) and resulted in slower recessions after each irrigation (Kindler, 2021). Clearly, soil moisture varied substantially between the two parks. For instance, the range of θ at PV was between 0.09 and 0.22 m3/m3 for the control plot (average and standard deviation of 0.14 ± 0.02 m3/m3), while the C plot at EN exhibited higher values of θ from 0.36 to 0.61 m3/m3, resulting in 0.48 ± 0.05 m3/m3. Furthermore, the warm seasons had similar values of θ (0.14 ± 0.02 and 0.48 ± 0.05 m3/m3 at PV and EN) as compared to the cool seasons (0.14 ± 0.02 and 0.48 ± 0.04 m3/m3 at PV and EN) at the C plots, as a compensating effect occurred between the higher irrigation input in the warm seasons and the higher precipitation during the cool seasons.
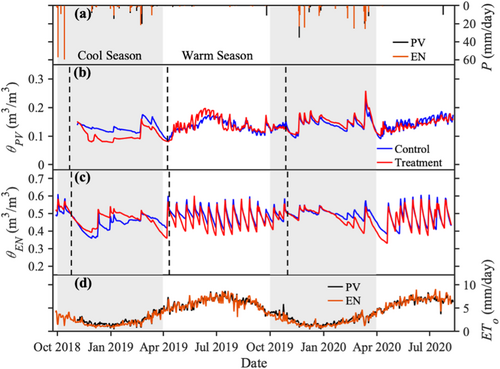
We compared the daily ETo at the Phoenix Encanto AZMET station to the co-located EC measurements to ensure the model forcing was sound (Figure 3). As noted by Vivoni et al. (2020), the seasonality in actual ET measured by the EC system was captured well by ETo, with similar average seasonal values (e.g., 5.7 and 6.2 mm/day for warm, and 2.1 and 2.2 mm/day for cool seasons). As expected, monthly ETo was typically larger than actual ET. For some days (33% of period), ET exhibited higher values than ETo due to: (1) the effects of advected energy from surrounding urban areas during the warm season on the local energy balance (see Vivoni et al., 2020) and (2) inaccuracies in the estimation of Rn in the Penman–Monteith approach of Brown et al. (2001). This is further illustrated in the comparison of ET and ETt (Figure 3, inset). During the cool season, ETt slightly underestimated ET (low standard error of estimates, SEE = 0.57 mm/day, measuring average distance to 1:1 line), whereas a higher underestimation of ET by the AZMET methodology was present during the warm season (SEE = 1.28 mm/day). Despite these small inaccuracies, the seasonal variations in evapotranspiration in the turf grass site were appropriately represented. For instance, the difference between the warm and cool season average values of ETt (3.7 mm/day) was similar to the seasonal difference in ET (3.7 mm/day). This indicated that seasonality in the soil water balance model can be captured through changes in ETo. A similar approach was adopted by Caylor et al. (2005) and Volo et al. (2014).
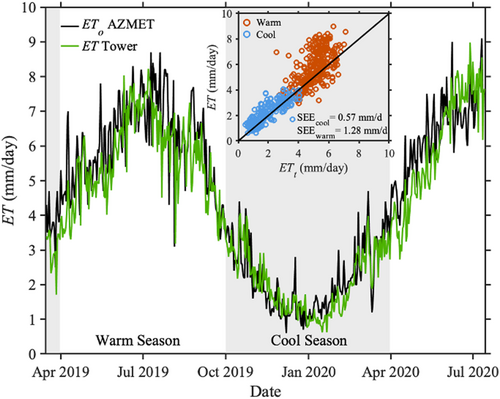
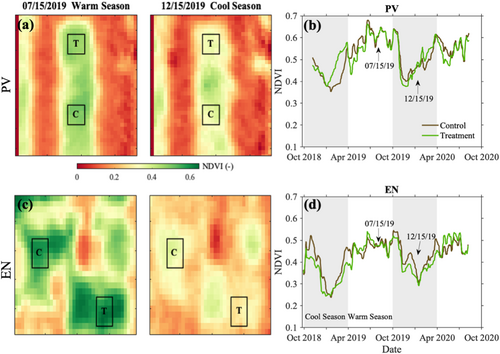
Figure 4 displays the temporal variation in turf grass greenness as captured by NDVI values averaged over C and T plots in each study park. As expected, warm seasons exhibited a higher daily average NDVI (0.57 and 0.47 at PV and EN, respectively) than the cool seasons (0.49 and 0.39). Absolute differences between the study parks are attributed to variations among Cubesat reflectance values. As such, the relative values of NDVI between the C and T plots within each park are emphasized. Note that abrupt transitions in NDVI occurred between seasons in response to changes in irrigation and turf grass phenology. This is shown in Figure 4 through a spatial comparison of 2 days (15 July 2019 and 15 December 2019) representing warm and cool seasons. Note that the outlines of the irrigated areas in each park are clearly visible and that contrasts between the turf grass areas and the surrounding roads and buildings are enhanced in the warm season. As observed for the profile-averaged θ (Figure 2), NDVI within the control and treatment plots have visually similar behaviour, with some exceptions when irrigation might have varied or the impact of precipitation events differentially influenced the turf grass areas.
4.2 Comparisons of control and treatment observations
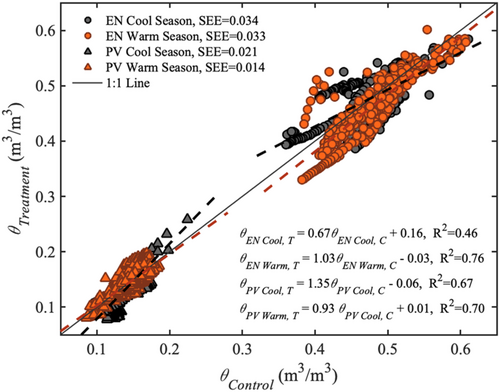
We compared soil moisture and vegetation conditions at control and treatment plots to determine if the green waste compost applications yielded a measurable impact. Figure 5 presents scatterplots of daily, profile-averaged θ for cool and warm seasons between C and T plots at the two study parks. No consistent bias is found in the comparison, with some periods having larger θ alternatively at the control and treatment plots. In addition, low values were found for SEE. The Wilcoxon signed-rank test showed significant differences for the total period at EN but not at PV, with several seasons exhibiting values of p < 0.05 despite the small absolute differences (Table 5). These small differences are attributed to (1) the effects of initial sensor installation for the cool season of 2018–2019 (i.e., soil settling around sensors) and (2) small variations in irrigation, in particular for the warm season of 2020 at PV and for the warm season of 2019 at EN. Similarities between control and treatment plots were also found in NDVI (Table 5), with no consistently greater values at the T plots as would be anticipated if compost treatments enhanced turf grass health. While certain seasons had statistically significant differences, these were explained by variations in θ linked to the causes described above. Where discrepancies in the relative values of θ and NDVI were present between control and treatment plots (i.e., cool season of 2018–2019), these were due to the initial installation leading to non-representative soil moisture as compared to the vegetation conditions captured within the plot through NDVI. Overall, the comparisons of C and T plots suggest that the green waste compost applied twice per year did not have a consistent impact on soil moisture dynamics or vegetation greenness.
| Study park | Variable and period | C average | C Std | T average | T Std | p value |
|---|---|---|---|---|---|---|
| PV | NDVI (−) | |||||
| Total period | 0.53 | 0.08 | 0.52 | 0.07 | 0.15 | |
| Cool season 2018–2019 | 0.43 | 0.06 | 0.47 | 0.06 | 7.3 × 10⁻⁶* | |
| Warm season 2019 | 0.59 | 0.05 | 0.57 | 0.06 | 4.7 × 10⁻⁵* | |
| Cool season 2019–2020 | 0.51 | 0.07 | 0.51 | 0.08 | 0.63 | |
| Warm season 2020 | 0.56 | 0.03 | 0.54 | 0.04 | 1.9 × 10⁻⁴* | |
| Profile-average θ (m3/m3) | ||||||
| Total period | 0.14 | 0.02 | 0.13 | 0.03 | 0.54 | |
| Cool season 2018–2019 | 0.13 | 0.02 | 0.10 | 0.02 | 2.8 × 10⁻²¹* | |
| Warm season 2019 | 0.13 | 0.02 | 0.14 | 0.03 | 0.28 | |
| Cool season 2019–2020 | 0.14 | 0.02 | 0.15 | 0.02 | 1.5 × 10⁻²* | |
| Warm season 2020 | 0.14 | 0.02 | 0.14 | 0.02 | 0.02* | |
| EN | NDVI (−) | |||||
| Total period | 0.44 | 0.07 | 0.43 | 0.08 | 0.04* | |
| Cool season 2018–2019 | 0.38 | 0.09 | 0.34 | 0.07 | 3.2 × 10⁻⁵* | |
| Warm season 2019 | 0.47 | 0.03 | 0.47 | 0.04 | 0.55 | |
| Cool season 2019–2020 | 0.43 | 0.07 | 0.40 | 0.06 | 1.5 × 10⁻⁵* | |
| Warm season 2020 | 0.47 | 0.03 | 0.49 | 0.04 | 3.3 × 10⁻⁹* | |
| Profile-average θ (m3/m3) | ||||||
| Total period | 0.48 | 0.05 | 0.47 | 0.05 | 7.0 × 10⁻³* | |
| Cool season 2018–2019 | 0.45 | 0.05 | 0.47 | 0.05 | 1.3 × 10⁻⁵* | |
| Warm season 2019 | 0.49 | 0.04 | 0.47 | 0.05 | 2.3 × 10⁻⁵* | |
| Cool season 2019–2020 | 0.50 | 0.02 | 0.48 | 0.04 | 3.4 × 10⁻⁴* | |
| Warm season 2020 | 0.47 | 0.06 | 0.46 | 0.07 | 0.78 | |
- Note: Statistically significant differences from the Wilcoxon signed-rank test (p < 0.05) are shown with asterisks. Bold values indicate when T plots had higher values than C plots that were statistically significant.
4.3 Comparison of observed and simulated soil moisture and evapotranspiration
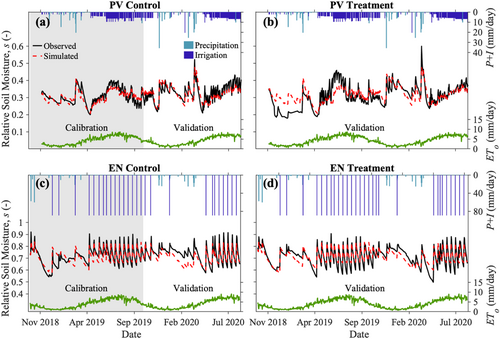
Figure 6 compares the observed and simulated s based on the calibrated parameters reported in Table 3 for C and T plots at both study parks. Calibration periods are shown in grey shading. Validation periods used the same parameter sets, except for the specification of the initial value of s. Daily forcing included the observed P and estimates of ETo and I. At PV, small and frequent irrigation pulses were applied (e.g., <10 mm/day, daily application in the warm season), which led to a total I of 1325 mm over the study period. In contrast, EN was managed with a few large pulses (e.g., >80 mm/day, once every 2 weeks in the warm season), resulting in an estimated I of 2400 mm over the entire period for the C plot with a higher value at the T plot due to two additional irrigation events (Table 6). Irrigation pulses at PV were smaller than P events, whereas the opposite was the case at EN. Furthermore, while most I was applied during the warm seasons, the Parks and Recreation Department carried out a few irrigation events during the cool seasons to sustain large, deeply rooted trees surrounding the turf grass areas.
| Relative soil moisture (s) metric | ||||||
|---|---|---|---|---|---|---|
| Study park | Period and plot | Precipitation (mm) | Irrigation (mm) | RMSE (m3/m3) | CC (−) | B (−) |
| PV | Calibration | |||||
| Controla | 127.50 | 765.57 | 0.025 | 0.83 | 0.99 | |
| Validation | ||||||
| Controlb | 189.95 | 559.86 | 0.026 | 0.83 | 0.98 | |
| Treatmentc | 317.45 | 1325.43 | 0.046 | 0.74 | 1.03 | |
| EN | Calibration | |||||
| Controld | 226.24 | 1422.40 | 0.042 | 0.80 | 1.00 | |
| Validation | ||||||
| Controle | 211.55 | 977.90 | 0.053 | 0.73 | 0.96 | |
| Treatmentf | 437.79 | 2578.10 | 0.043 | 0.83 | 1.00 | |
- a 4 Nov. 2018 to 3 Nov. 2019.
- b 4 Nov. 2019 to 10 Aug. 2020.
- c 4 Nov. 2018 to 10 Aug. 2020.
- d 28 Sep. 2018 to 30 Sep. 2019.
- e 1 Oct. 2019 to 7 Aug. 2020.
- f 28 Sep. 2018 to 7 Aug. 2020.
Model simulations performed well with respect to the observed s during calibration and validation periods at the C plots and for the validation period at the T plots in both parks. For instance, the model distinguished between the slow recession of s during cool seasons and the more abrupt decreases after warm season irrigation. The soil moisture response to irrigation and the range of observed s values were also captured well. Notably, the model reproduced the behaviour of both sprinkler and flood irrigation types through the applied model forcings and parameter values. Table 6 presents statistical comparisons of the observed and simulated s based on the RMSE, CC and B metrics. At PV, the validation performance was nearly equal to that of the calibration at the C plot, while a lower model skill was noted for the validation at the T plot. At EN, the model performance was slightly lower for the validation period at the control plot, but the validation at the treatment plot was comparable to the control calibration. As noted in the statistical comparison of θ between C and T plots, there were only a few differing behaviours in model performance across the plot types at both parks. For instance, simulations did not capture well: (1) the initial cool season at the PV treatment plot when sensor installation effects were notable and (2) periods of time when the irrigation input varied between C and T plots.
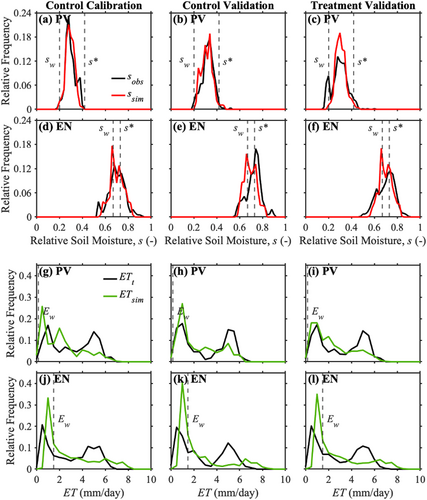
To complement the model evaluation, Figure 7 compares the frequency distributions of s and ET for calibration and validation periods corresponding to each study park. Daily simulated (sim) values of s and ET resulted from the soil water balance model, whereas daily observed (obs) values were obtained from θ and ETt. For reference, model parameter values (sw, s* and Ew) are shown. Simulated frequency distributions corresponded well with the observed s values over the full range of conditions, in particular for the calibration periods. As noted earlier, model skill was lower for the treatment validation at PV and the control validation at EN. Nevertheless, the range of values of s and the peak frequencies at a particular s were generally captured well in the simulations. Values of s at PV were typically within the bounds of sw and s*, indicating that simulated ET was under a stressed condition (ETs, Laio et al., 2001), whereas values of s at EN were often lower than sw or higher than s*, such that simulated ET fluctuated between Eb and ETu. Indeed, ETt showed a bimodal frequency distribution at both study parks. This behaviour was the result of seasonal variations of ETo, with low ETt during cool seasons and high ETt during warm seasons. To some extent, simulations captured the bimodality of ETt, for instance during the validation period at the PV control plot, but also had difficulty in matching high ETt. These discrepancies were attributed to the simplified use of a monthly Kc to determine ETt as opposed to the daily variation of ETsim resulting from precipitation and irrigation events. At EN, warm season values of ETsim from 6 to 8 mm/day were more consistent with EC data than ETt.
4.4 Effect of irrigation amount in long-term scenarios
Given the confidence built on the simulations, we present a set of long-term modelling runs for the C plots of each study park in Figure 8. Monthly s and water balance components (P, I, ET and L) are shown after averaging over the 15-year periods using the AZMET forcing. Q is omitted due to negligible values for the sprinkler and flood irrigation amounts during 2018 to 2019. As expected, precipitation seasonality was similar at the two parks, while I was of higher magnitude (Table 6) and for a longer duration at EN (i.e., flooding applied in all months except January, March and November). The contrast in irrigation type led to variations in the seasonal distributions in s at EN (s from 0.63 to 0.74) as compared to PV (s from 0.25 to 0.37). In addition, interannual variations in s, denoted by ±1 monthly standard deviation, indicated that soil moisture conditions at EN were less dependent on year-to-year precipitation differences. A major difference in leakage (L) beyond the 60 cm root zone was present in the two study parks. While PV had no L for the sprinkler irrigation amounts applied, EN exhibited values of L ranging from 0 to 101 mm/month. At EN, leakage was present during all months with I and showed a maximum value in December as irrigation was applied when ETo was low. Interestingly, the seasonality of ET varied substantially between the study parks. Flood irrigation at EN led to a sustained ET (average of 140 mm/month) during the entire warm season, whereas sprinkler irrigation resulted in a shorter period of high ET values (average of 164 mm/month between June and August).
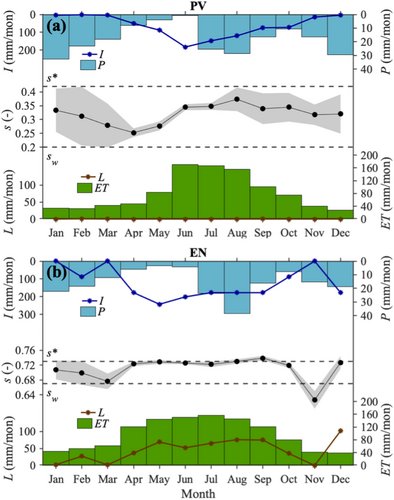
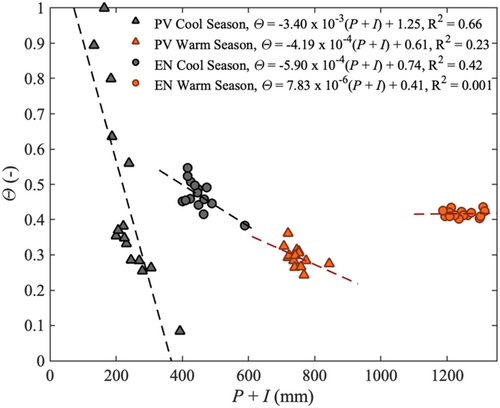
Figure 9 compares the sprinkler and flood irrigation practices in terms of their impact on the dynamic water stress, , calculated for the 15 separate cool and warm seasons. The water input (P + I) for each season was only sensitive to the interannual variability of P, such that linear regressions between and P + I (dashed lines) indicated the role of precipitation. Cool seasons showed a dynamic water stress that was influenced substantially more by P than warm seasons, with a more notable effect at PV. Higher values of I typically buffered the effects of interannual precipitation variations, leading to nearly no sensitivity of P in the warm season at EN where I was estimated as 193 mm/month. Furthermore, irrigated conditions led to relatively low values of (from 0.24 to 0.44) as compared to unirrigated arid systems (Porporato et al., 2001). Values of > 0.55 occurred only during cool seasons with below-average P and mostly at PV where sprinkler irrigation applied in small and infrequent pulses could not sustain turf grasses well.
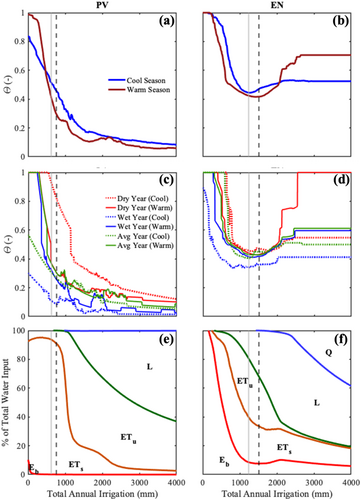
In Figure 10, we show the sensitivity of long-term averaged to the total annual I, which was varied in increments of 13 mm/year using the 2018–2019 distribution. These scenarios are compared to the calibration cases (dashed lines) and scenarios with a reduction of 18% in annual I (solid lines). The sensitivity of is also shown for the Dry, Average and Wet years (Table 4) that depict the interannual variability in P. decreased from values near 1 for the case with no irrigation to values approaching 0.1 at PV and 0.4 at EN. The decrease in was not monotonic since water balance components (Eb, ETs, ETu, L and Q) exhibited thresholds at specific values of annual I. For instance, dynamic water stress increased at EN for I > 1400 mm/year due to the generation of Q, which reduced available s and increased . At the values of I for the calibration period, the cool season has higher than the warm season (0.46 and 0.30 at PV, and 0.47 and 0.42 at EN for cool and warm seasons). As I was reduced, a cross-over point was identified when the turf grasses during the warm season became more stressed, at 467 and 240 mm/year for PV and EN. As expected, the Dry year had a higher , while the Wet year showed a lower . Higher sensitivity of to the annual P was noted at PV as compared to EN. Precipitation also influenced the cross-over point such that had different sensitivities to I across years. At the calibrated I value, the water balance was partitioned into ETs and ETu at PV, and into ETs, ETu, and L at EN, with a smaller amount of Eb. As explored in more detail next, a reduction of 18% of annual I did not appreciably change the water balance components or the dynamic water stress in either park as compared to the current irrigation. Two exceptions were noted in that the 18% reduction led to (1) an increased warm season by 0.12 at PV and (2) a reduced L by 261 mm/year at EN.
4.5 Stakeholder-driven water savings scenarios
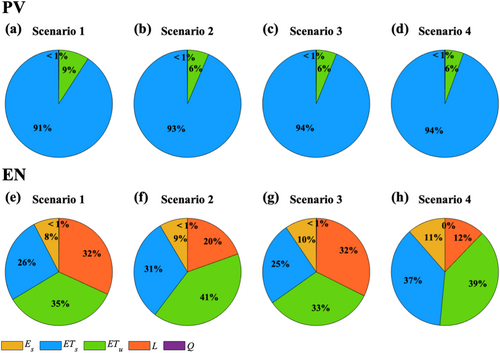
As part of the stakeholder meetings, we conducted scenarios that explored the potential for water conservation through changes in irrigation. The four scenarios (1 to 4) are described in Table 7, including the irrigation amount, the percentage of water conserved, and average and L for cool and warm seasons during the 15-year simulations. An 18% reduction in annual I through a change in magnitude (Scenario 2) led to a small increase in for the warm season at PV and no impact at EN, whereas a large reduction of L of 261 mm/year was achieved at EN. Reaching a similar water savings target (19% at PV and 15% at EN) using a change in irrigation frequency (Scenario 3) increased warm season , relative to Scenario 2, and had a smaller impact on L (65 mm/year reduction). This suggests that changes in irrigation magnitude were more effective. As a result, Scenario 4 tested if a larger 30% reduction in magnitude could be supported, resulting in a slightly higher impact on warm and cool season at PV and no appreciable change at EN, while greatly reducing L at EN (387 mm/year). Results were presented to stakeholders using Figure 11 to show the water balance components for the scenarios. Through these graphs, we communicated that irrigation reductions were possible without adverse effects on turf grasses and with the benefit of reducing ETu at PV and reducing L at EN. We noted that less sprinkler irrigation at PV led to a lower unstressed evapotranspiration that likely would reduce lawn maintenance costs, while less flood irrigation at EN reduced the water lost below the turf grass root zone.
| Study Park | Irrigation scenario | Irrigation (mm/year) | Water conserved (%) | Average (−) | Average L (mm) | ||
|---|---|---|---|---|---|---|---|
| Cool season | Warm season | Cool season | Warm season | ||||
| PV | 1 | 766 | 0 | 0.46 | 0.29 | 0.74 | 0 |
| 2 | 628 | 18 | 0.51 | 0.41 | 0.63 | 0 | |
| 3 | 620 | 19 | 0.46 | 0.45 | 0.74 | 0 | |
| 4 | 536 | 30 | 0.57 | 0.51 | 0.55 | 0 | |
| EN | 1 | 1511 | 0 | 0.47 | 0.42 | 167.3 | 372.0 |
| 2 | 1239 | 18 | 0.44 | 0.42 | 101.8 | 177.0 | |
| 3 | 1286 | 15 | 0.36 | 0.48 | 302.7 | 172.0 | |
| 4 | 1058 | 30 | 0.46 | 0.45 | 62.6 | 89.6 | |
5 DISCUSSION
5.1 Compost effect on soil and vegetation conditions
Differences in profile-averaged θ and NDVI between the control and treatment plots were small and inconsistent (Table 5). Significant variations were attributable to the effects of initial installation or minor disparities in irrigation input. Furthermore, the soil water balance model calibrated at the control plots performed equally well for the compost treatment plots (Figure 6). This parameter transferability indicates that no additional biophysical processes were necessary for simulating soil moisture under a compost treatment. In contrast, Whitney et al. (2017) found that adding a physical representation of a biological crust layer to the soil water balance model was required to properly reproduce soil moisture observations. These multiple lines of evidence indicate that green waste compost applications in these urban parks does not conserve water in such a way as to offset its higher costs as compared to traditional fertilizers. Furthermore, measurable improvements on vegetation conditions were also not identified. These findings are conditioned on the use of a thin layer of compost incorporated into a turf grass surface with a drag mat during fall and spring seasons. It appears that the compost application did not shield the soil surface from evaporative losses or significantly modify the infiltration characteristics of the urban park soils. Nevertheless, no adverse effects of green waste compost were noted such that, under favourable economic conditions, it may serve as an alternative to traditional fertilizers.
5.2 Sensitivity to type of irrigation application
Notable differences were found between sprinkler and flood irrigation practices in terms of the soil moisture conditions (Figures 3 and 7), dynamic water stress (Figures 9 and 10) and water balance partitioning (Figures 8 and 11). As a result, the type of irrigation was the dominant factor influencing the soil water balance model of the urban parks, consistent with the simplified irrigation scenarios of Volo et al. (2014). Sprinkler irrigation consisting of small, frequent events in the warm season result in lower soil moisture values, promote less leakage from the root zone, and contain a shorter period of high ET as compared to flood irrigation, at about half of the total outdoor water use (Table 6). However, sprinkler irrigation is more susceptible to the interannual variability of P such that dry conditions during warm and cool seasons can lead to high that can impact turf grasses. Sprinkler irrigation also leads to very low amounts of leakage in the cool season to support deep-rooted trees, whereas flood irrigation with its large, infrequent pulses can benefit surrounding trees during both seasons. A further consideration is that sprinkler irrigation will likely lead to lower heat reduction given the lower amounts of evaporative cooling.
5.3 Water savings through irrigation scheduling
Long-term modelling scenarios showed the feasibility of reducing water use for both sprinkler and flood irrigation types. Since the model was tested with local observations of θ and ET and accounted for the interannual variability in P and ETo, the scenarios are the best current representation of the fate of outdoor water within the upper soil profile of the study parks. While more advanced ecohydrological models are available for urban areas (e.g., Cristiano et al., 2020; Fatichi et al., 2016; Meili et al., 2020), the soil water balance approach of Laio et al. (2001) and Porporato et al. (2001) represented well the dominant role of the irrigation type and provided insights on the effects of changes in irrigation. Sprinkler and flood irrigation scenarios showed that the stakeholder target of an 18% reduction in water use could be achieved with low impacts on the soil water balance or plant stress, with further reductions of 30% also being feasible. The reduction of event size or magnitude for daily sprinkler or bi-weekly flood pulses had improved outcomes as compared to changes in the event frequency. This suggests that small changes in watering depth, while keeping the current timing, can have measurable benefits for urban parks in Phoenix, including lower biomass production and less leakage below the root zone.
6 CONCLUDING REMARKS
This study utilized ecohydrological monitoring and modelling efforts in the context of an experimental manipulation in two urban parks. As such, it is considered an integrated study in ecohydrology that King and Caylor (2011) highlighted as needed for advancing the field, in particular for urban areas where less attention has been paid to date. By quantifying the effect of compost treatments in a real-world setting, we identified that water conservation targets could not be met unless irrigation scheduling was also altered. Small changes in watering depth under the current irrigation timing offer several benefits for urban park management, while minimizing the potential impacts to turf grass conditions. These outcomes were developed with the City of Phoenix Parks and Recreation Department and summarized in ways that highlighted the co-benefits for green waste compost applications with changes in irrigation management. Additional observations in urban areas (e.g., Alizadehtazi et al., 2020; Gomez-Navarro et al., 2019; Vivoni et al., 2020) would certainly help elucidate further the fate of irrigation and other water sources. Furthermore, the incorporation of these findings in regional simulations (e.g., Reyes et al., 2018; Bohn et al., 2018; Wang, Vivoni, et al., 2021) would allow an assessment of the water savings potential at the city or metropolitan area scale. Similarly, it would be useful to determine the sensitivity of these outcomes to a broader set of rainfall scenarios, including changes to frequency and amount. As monitoring efforts of green infrastructure improve, urban ecohydrology models can offer the means to quantify spatiotemporal conditions and elucidate the underlying mechanisms driving the response to management decisions. The sensitivity of the study outcomes to the two forms of irrigation suggests that these results can be of broad utility for the management of urban parks.
ACKNOWLEDGEMENTS
We thank the City of Phoenix Parks and Recreation Department, in particular Larry Polk, Joel Carbajal and Rick Templeton, for their help in obtaining site permits and irrigation data, field support and for numerous discussions of the modelling outcomes in Encanto and Paradise Valley Parks. Project funding was provided by the Central Arizona Project, the City of Phoenix, and the Innovative Conservation Program of the Metropolitan Water District of Southern California. Planet imagery was made available through the Planet Incubator Program at Arizona State University. We are grateful to Bill Campbell and the Arizona State University Rob and Melani Walton Sustainability Solutions Service for their support. We thank Giuseppe Mascaro and Margaret Garcia for their comments on earlier versions of this work. We also thank the Arizona Meteorological Network (http://cals.arizona.edu/AZMET/) for providing weather station data. The data sets collected as part of this study at the two parks (Kindler & Vivoni, 2021) and the eddy covariance observations (Kindler et al., 2020) are available through Zenodo.


