Hydrogeologic setting overrides any influence of wildfire on pore water dissolved organic carbon concentration and quality at a boreal fen
Abstract
Western Boreal Canada could experience drier hydrometeorological conditions under future climatic changes, and the drying of nonpermafrost peatlands can lead to higher frequency and extent of wildfires. Despite increasing pressures, our understanding of the impact of fire on dissolved organic carbon (DOC) concentration and quality across boreal peatlands is not consistent. This study capitalizes on the rare opportunity of having 3 years of prefire and 3 years of postfire DOC data at a treed, moderate-rich fen in the Western Boreal Plain, northern Alberta, to investigate wildfire effects on peatland DOC dynamics. We investigated whether a wildfire facilitated any changes in the pore water DOC concentration and quality. There was very little impact of the fire directly, with no significant changes in DOC concentrations postfire. We highlight that DOC patterns are more likely to be controlled by local hydrogeological factors than any effect of fire. Fall hydrological conditions and subsequent winter storage processes impose a strong control on DOC concentrations the following year. We suggest that the presence or absence of concrete ground frost in the fen (determined by fall water table position) influences overwinter storage changes, controlling the effect that DOC-poor snowmelt may have on pore water concentrations. However, an increase in SUVA254 was found 2 years postfire, indicating an increase in aromaticity. These results highlight the need for careful consideration of the local hydrogeologic setting and hydrological regime when predicting and analysing trends in DOC concentrations and quality.
1 INTRODUCTION
Northern peatlands cover approximately 365,000 km2 of land and store ~5.5 × 10¹⁵ g of carbon (C; Yu, Loisel, Brosseau, Beilman, & Hunt, 2010). Western Boreal Canada, in particular, contains a mosaic of peatlands, typically classified into bogs and fens, with fens being most predominant (64% of peatland area [35% treed fens and 29% open fens]; Vitt, Halsey, Bauer, & Campbell, 2000; Yu, Vitt, Campbell, & Apps, 2003). Bogs are ombrotrophic peatlands (precipitation fed) that are characterized by low pH and nutrient-poor pore waters and low species diversity (typically dominated by Sphagnum species; Vitt & Chee, 1990; Graham, Hartsock, Vitt, Wieder, & Gibson, 2016). Conversely, fens are minerotrophic (groundwater fed) peatlands that are characterized by relatively higher pH and electrical conductivity. Fens are typically more species rich (dominated by graminoid species and brown mosses) and have water tables that are typically closer to the surface than those measured in bogs in similar climatic settings (Chee and Vitt, 1989; Vitt & Chee, 1990; Graham et al., 2016). The terrestrial carbon stored within these peatlands are vulnerable to degradation and subsequent release through a number of anthropogenic and natural disturbances that can be exacerbated by climate change (Turetsky, Wieder, Halsey, & Vitt, 2002; Wilkinson, Moore, Flannigan, Wotton, & Waddington, 2018).
Peatlands serve an important function within the global C cycle, in influencing atmospheric carbon dioxide (CO2) and methane (CH4) concentrations (Vitt et al., 2000), and acting as important sources for the export of dissolved organic carbon (DOC) to downstream ecosystems. DOC is typically defined as organic matter that passes through a filter, normally 0.45 μm (Thurman, 1985). DOC is produced from the decomposition of organic matter (Billett et al., 2004) or from plant exudates (Fenner, Ostle, Freeman, Sleep, & Reynolds, 2004; Trinder, Artz, & Johnson, 2008). DOC accounts for a substantial portion of C export from peatlands (Pastor et al., 2003), not only due to the large amount of soil organic matter present but also due to their hydrologic function as conveyors of subsurface water to down-gradient stream networks (Burd et al., 2018; Quinton, Hayashi, Pietroniro, & Simpson, 2003). The impact of hydrological conditions on DOC concentrations and export can be complex (Jager, Wilmking, & Kukkonen, 2009), and there can often be opposing results with regards to how DOC concentrations, quality, and export are affected by “dry” versus “wet” conditions. Drier, “drought-like” conditions can lead to an increase in DOC concentrations through biological changes in the peat column, resulting in a thicker oxic zone and increased decomposition (Blodau, Basiliko, & Moore, 2004; Jager et al., 2009). However, drought conditions have also been shown to lead to a decrease in DOC concentrations, related to increased sulphate (SO4) concentrations, leading to higher acidity that reduces DOC solubility (Clark, Chapman, Adamson, & Lane, 2005). Yet, it has been shown that after rewetting, DOC concentrations can increase, with many studies showing higher DOC export under high run-off conditions (Blodau et al., 2004; Holden, 2005). DOC originating from peatlands has been found to have greater aromaticity and molecular weights than mineral soil-sourced DOC (Olefeldt, Devito, & Turetsky, 2013), generally reducing its bioavailability. DOC with a relatively high carbohydrate content and low molecular weight organic acids and proteins is more easily biodegradable, whereas aromatic and hydrophobic structures have lower biodegradability due to resistance to microbial enzymes (Khadka, Munir, & Strack, 2015).
Climatic changes could lead to drier conditions across much of the boreal region, and the drying of nonpermafrost peatlands can lead to higher frequency and extent of wildfires (Gorham, 1991; Kettridge et al., 2015; Tarnocai, 2009). For example, in Alberta alone, wildfire impacts an average of ∼208,000 ha every year (2006–2015; Government of Alberta, 2017) with fires liberating large quantities of the C stored in peatlands across the province to the atmosphere (approximately 4.7 × 10⁹ g of C released per year; Turetsky et al., 2002). With fire frequency expected to roughly double by the end of the century, from enhanced warming and longer fire seasons (Wotton & Flannigan, 1993; Flannigan, Stocks, Turetsky, & Wotton, 2008; Flannigan et al., 2013; Kirchmeier-Young, Zwiers, Gillet, & Cannon, 2017; Hanes, Wang, Jain, Parisien, & Little, 2018), as well as an increase in the number of large high-intensity wildfires (Tymstra et al., 2007), boreal peatlands may be vulnerable to changes in wildfire regime under a rapidly changing climate. Despite these increasing pressures, the impact of fire on DOC concentration, quality, and export across boreal peatlands is not always consistent, with studies showing an increase (McEachern, Prepas, Gibson, & Dinsmore, 2000), no change (Carignan, D'Arcy, & Lamontagne, 2000; Lamontagne, Carignan, D'Arcy, Prairie, & Paré, 2000; Marchand et al., 2009), or decrease (Betts & Jones, 2009) in DOC concentration in surface waters. Therefore, the impacts of fire on pore water DOC dynamics across peatland ecosystems are not fully understood and are likely to be site specific. Wildfire can alter soil organic matter quality in the uppermost soil layers (Neff, Harden, & Gleixner, 2005; Olefeldt et al., 2013) and can directly affect belowground C stored in peatlands. This can cause a loss of peat (Kettridge et al., 2015) and can lead to a decrease in C accumulation, through both combustion and increased postfire decomposition (Robinson & Moore, 2000). Even in ecosystems with predominantly high moisture levels, fire can still impact soil C dynamics, including altering vegetation composition (Mayner et al.,2018) and reducing microbial activity (Artz, 2009). This can be especially true in peatlands located in topographical and surficial geological settings that promote deep burning and smouldering at margins (Ingram et al., 2019; Mayner et al., 2018). There is a strong link between vegetation and DOC concentration and composition (Armstrong, Holden, Luxton, & Quinton, 2012; Wickland, Neff, & Aiken, 2007); therefore, a change in vegetation community or an increase in vegetation regrowth after fire could lead to an increase in labile plant-derived C, potentially increasing DOC concentrations. Wildfires in boreal peatlands can also cause an increase in aromaticity of DOC (Holden, Chapman, Palmer, Kay, & Grayson, 2012; Olefeldt et al., 2013) due to the newly produced, highly aromatic char.
The Horse River wildfire broke out near Fort McMurray, Alberta, Canada, and burned approximately 589,000 ha (MNP, 2017) between May 3 and July 5, 2016. This study takes advantage of the opportunity of having 3 years of prefire and 3 years of postfire DOC data at a boreal fen to investigate wildfire effects on peatland DOC dynamics in this setting. The objectives of our study were to (a) investigate whether a wildfire facilitated any changes in the pore water DOC concentration at a treed, moderate-rich fen and (b) assess any changes in the quality of DOC (SUVA254) after the fire. We hypothesized that DOC concentrations would be lower after fire due to the removal of the upper peat layer and surface vegetation (decrease in primary production), but the aromaticity of the DOC would increase postfire due to the production of char deposits.
2 MATERIALS AND METHODS
2.1 Study site
The study was undertaken in a fen (hereafter referred to as Poplar Fen) near Fort McMurray, Alberta, Canada, which was partially burned in May 2016 as part of the Horse River Wildfire (MNP, 2017; Figure 1). Poplar Fen is a treed, moderate-rich fen located approximately 20 km north of the city of Fort McMurray (56°56N, 111°32.934W; Figure 1). This fen is dominated by Larix laricina, Betula pumila, Equisetum fluviatile, Smilcina trifolia, Carex spp., and brown mosses, largely Tomenthypnum nitens. The average prefire peat depth ranged between 1.3 and 1.5 m. Fen areas experienced a modest and consistent depth of burn (DOB) of 2.0 ± 0.2 cm from the fire, with DOB higher in margins between fen and upland, averaging 13.0 ± 0.1 cm (Elmes, Thompson, Sherwood, & Price, 2018), within a similar range to another peatland also impacted by the Horse River wildfire (between 2.5 ± 3.5 cm and 16.0 ± 10.2 cm; Wilkinson et al., 2018). However, certain fen areas were left virtually unburned where DOB equalled 0 cm.
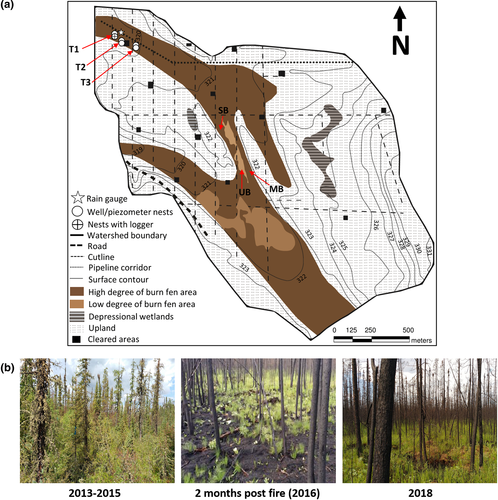
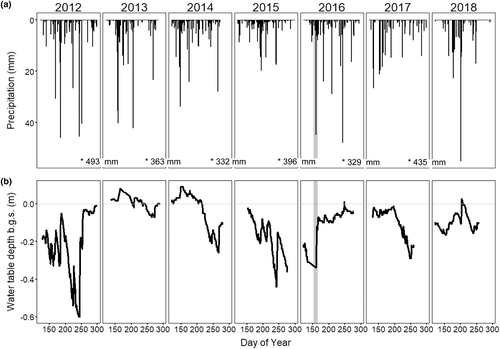
The hydrometeorological conditions preceding the burning of Poplar Fen were summarized by Elmes et al. (2018). In short, the authors confirmed the accumulation of moisture deficits prior to the fire, between summer 2015 and early spring 2016. Moisture deficits were also enhanced due to the hydrogeologic setting of Poplar Fen, as groundwater flow is confined to local flow systems in adjacent uplands that supply groundwater discharge to low-lying fen areas from under the fen ( et al., 2018; Elmes & Price, 2019). Elmes and Price (2019) highlighted the susceptibility of the watershed to groundwater recharge conditions and subsequent drainage over rain-free periods, and Elmes et al. (2018) detected continued water table decline throughout the winter when precipitation is stored primarily as snow. Given the complex flow patterns observed across years of varying hydrometeorological conditions, understanding the hydrogeologic setting and regime is essential for interpreting the DOC dynamics at Poplar Fen, and arguably all catchments (Fraser, Roulet, & Moore, 2001; Holden, 2005).
Two other reference sites were also used in this study as a comparison: a poor fen (hereafter referred to as Pauciflora Fen which was not impacted by the 2016 fire) and a saline fen (hereafter referred to as Saline Fen), which was partially burned during the 2016 fire. Pauciflora Fen is a partially treed, poor fen located 40 km south of Fort McMurray (56°22.610N, 111°14.164W). This fen is surrounded by an upland forest that receives water discharged from surrounding bogs within the peatland complex (Wells, Ketcheson, & Price, 2017). Species dominating the site included Sphagnum spp., Chamaedaphne calyculata, Carex spp., Picea mariana, and Betula pumila (Khadka et al., 2015). The average peat depth is 4 m; however, there is high spatial variability across the fen, with peat depth ranging anywhere from <1 to >10 m (Khadka et al., 2015). Saline Fen is located 10 km south of Fort McMurray (56°56.330N, 111°32.934W). Forested peatlands surround the fen; however, the fen itself contains no trees and is primarily dominated by Juncus balticus, Calamagrostis stricta, and Triglochin maritima (Khadka et al., 2015). The average peat depth ranges between 0.75 and 1.5 m across the site (Khadka et al., 2015). This fen had only been partially burned (i.e., vegetation burned, but little evidence of peat combustion), whereas the adjacent forested areas were heavily burned.
2.2 Methodology
2.2.1 Hydrological instrumentation and sampling
Fen water table (WT) was monitored over the study periods using fully slotted water table wells (well networks outlined in Elmes & Price, 2019) installed into the upper ~80 cm of peat, which were manually measured throughout each field season (2013–2018) on roughly a weekly basis. A continuous record of fen water table was measured at a fen location in the first transect (T1) using a logging pressure transducer (from 2012, 2016 to 2018; Schlumberger Mini-Diver) or a capacitance water level recorder (from 2013 to 2015; Odyssey Dataflow Systems Ltd.). The average manual water table for all fen wells (based on the instrumentation outlined in Elmes & Price, 2019) was then extrapolated into a continuous half hourly record, based on highly correlated values between logged water table and average manual water table. Precipitation was measured in an open area of the fen with a logging Onset RG3-M tipping bucket rain gauge. When daily totals were not available, data were supplemented with daily rainfall values estimated for the Poplar Fen area (township: T092R10W4), using an inverse-distance weighting interpolation procedure (IDW, nearest station [Mildred Lake climate station] ~12 km from Poplar Fen; Alberta Agriculture and Forestry, 2017).
2.2.2 DOC instrumentation and sampling
Three pairs of piezometer nests consisting of a hummock/hollow (total of six nests) at each transect were installed (T1–T3) in the north-west portion of the fen. To account for variation in water flow paths, piezometer paired nests were aligned in a transect running parallel to water flow direction (Khadka, Munir, & Strack, 2016). Water samples were collected at 50 cm below the surface approximately twice a month between May and August across the six years; however, only July–August data are presented in this study due to having no data prior to the fire in 2016 at Poplar Fen (due to forced evacuation of the city of Fort McMurray during much of May and June 2016 in response to the fire). Piezometer locations were burned during the fire and were reinstalled postfire in 2016 as near to the original locations as possible. Similar transects were installed at Pauciflora and Saline fens (see Khadka et al., 2016, for more details). On the day of sampling, the piezometers were purged and left to naturally refill. Samples were extracted from the well using a foot pump flushed with distilled water prior to use into sample bottles. Although piezometers were also installed at 75 and 100 cm depths, only the 50-cm piezometers were used for comparisons across years and sites where applicable as no significant difference in DOC concentration or composition was observed between depths prior to the fire (Khadka et al., 2016). Environmental variables including water table, electrical conductivity (EC), and pH were also recorded at each measurement.
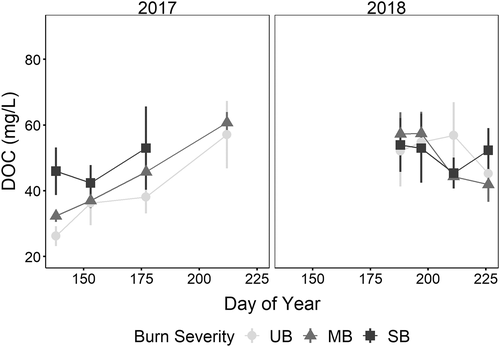
During 2017, an additional site at the Poplar Fen was instrumented along a peat burn severity gradient to monitor C exchange dynamics after the fire. The unburned (UB) site had no wildfire impact, the moderately burned (MB) site had a depth of burn of approximately 9–11 cm, and the severely burned (SB) site had a depth of burn of approximately 14–17 cm. Water samples were collected from fully slotted water table wells (not 50 cm piezometers) approximately six times between May and July in 2017 and July and August in 2018 following a similar methodology as above.
2.2.3 DOC concentration and quality
Total organic carbon analysis was conducted using the Shimadzu total organic carbon analyser under the nonpurgeable organic carbon method to determine DOC concentration. Absorbance at 254 nm was measured for each sample using a PerkinElmer UV/VIS Spectrophotometer Lambda 35 spectrophotometer. DOC quality was characterized by calculating specific ultraviolet absorbance (SUVA254). SUVA254 (L mg1 m−1) is determined by dividing absorbance at 254 nm by DOC concentration multiplied by 100. Higher SUVA254 indicates greater aromaticity (Weishaar et al., 2003). Because there were no DOC concentration data for all three fens in 2017, DOC concentration was determined based on the regression between absorbance at 254 nm and DOC concentration collected in 2016: DOC = 24.604 * ln (absorbance at 254 nm) +11.39), R2 = .81, p < .0001.
2.2.4 Statistical analysis
All statistical analysis was undertaken in R (R Core Team 2013). We found no significant difference between microform type (hummocks and hollows) similar to Khadka et al. (2016); therefore, microform types were merged in the statistical analysis. A linear mixed effects model (LMM) was used to evaluate the effect of year and environmental variables on DOC concentration with pH, EC, and water table depth at the start of the hydrologic year (October 01—HY-WT) included as fixed effects and Plot ID as a random effect to take into account repeated measures, using the nlme package (Pinheiro et al. 2018) with post hoc analysis completed using the multcomp package (Hothorn et al. 2008). We calculated the amount of variance described by the model as R2GLMM (Nakagawa & Schielzeth, 2013), using the package MuMIn (Barton, 2013). A one-way analysis of variance was used to compare differences in SUVA254 among the years 2013 and 2018. A Tukey honestly significant difference post hoc analysis was applied to determine which years were different when the results of the analysis of variance were significant.
3 RESULTS
3.1 Hydrometeorological conditions of Poplar Fen between 2013 and 2018
High WT conditions were observed in the first half (late 2012 to mid-2014) of the prefire record, corresponding to a period of above average precipitation (P). A period of decreasing WT followed in a drying period towards the end of the prefire record (mid-2014 to late 2015) was characterized by below average P. WT in the fen averaged ~30 cm below ground surface (b.g.s.) on May 17 when Poplar Fen began to burn (Elmes et al., 2018). Following the fire in June 2016, the fen experienced a wetting up period (Figure 2b). Standing water or near-surface WT conditions persisted throughout 2016 and into the spring of 2017 and began to decrease over the 2017 summer and into the fall. Spring 2018 began with WTs that were relatively deep. A wet summer followed, with WT receding into the fall. At the beginning of each hydrologic year (HY-WT; October 01), prior to onset of winter, relatively high fen WT were measured in 2012 (0.04 m b.g.s.), 2013 (0.02 m b.g.s.), and 2016 (0.05 m b.g.s.), with lower levels measured in 2014 (0.10 m b.g.s.), 2015 (0.33 m b.g.s.), 2017 (0.20 m b.g.s.), and 2018 (0.11 m b.g.s.; Figure 2b).
3.2 Pore water DOC concentration and quality at Poplar Fen between 2013 and 2018
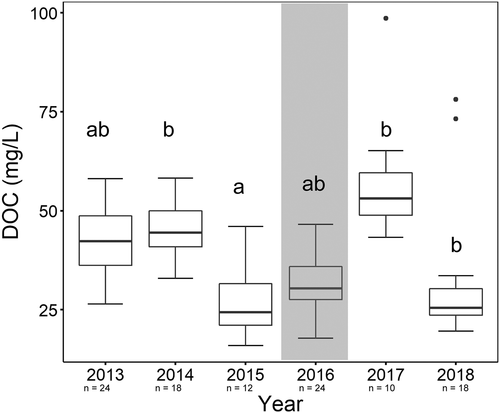
Results of the LMM indicated there was a significant difference in DOC concentration (Table 1) between years and in relation to the HY-WT (Table 1). No significant effect of pH or EC was found (Table 1). DOC concentrations were lower under drier antecedent HY-WT conditions and higher when HY-WT was closer to the ground service. DOC concentrations at 50 cm depth at Poplar Fen followed a similar pattern before and after the fire in 2016 (Figure 3). DOC concentrations were slightly higher in 2016 compared with prefire conditions (2015), 2 months after the fire, increasing further in 2017, but dropping substantially in 2018. The mean (± standard deviation) concentration for July and August was highest in 2014 and 2017 at 46.8 ± 9.2 and 46.4 ± 14.2 mg/L, respectively, whereas 2015 and 2018 had the lowest mean concentration at 23.6 ± 8.4 and 26.8 ± 12.8 mg/L, respectively.
| Effect | F | p | R2GLMMa | |
|---|---|---|---|---|
| Dissolved organic carbon concentration | Year | F(5, 21) = 10.32 | <.0001 | .72 |
| HY water table | F(1, 21) = 32.39 | <.0001 | ||
| Electrical conductivity | F(1, 21) = 9.12 | .065 | ||
| pH | F(1, 21) = 0.004 | .95 | ||
| Intercept | F(1, 21) = 1524.9 | <.0001 |
- Note. The model has a random factor of Plot ID to account for repeated measurements across the 6-year period.
- a We report the marginal R2GLMM accounting for variance explained by fixed factors only.
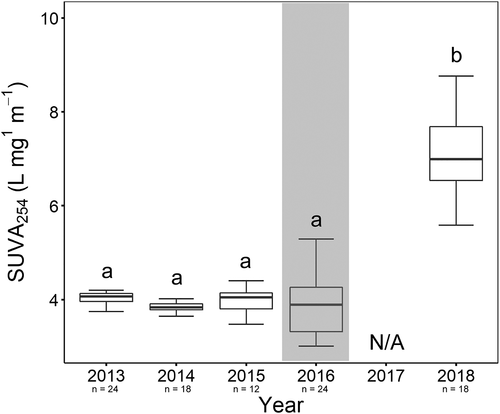
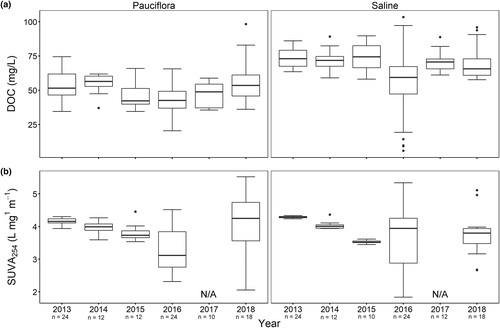
There was no significant difference in SUVA254 between 2013 and 2017; however, there was a significant increase in SUVA254 values in 2018, F(5, 123) = 39.98, p ≤ .001, indicating a much higher aromaticity than previous years (Figure 4). As a comparison, the Pauciflora Fen (unburned) had similar DOC concentrations to Poplar Fen (mean ± standard deviation) ranging from 42.5 ± 10.0 to 52.4 ± 8.2 mg/L between 2013 and 2018, whereas Saline Fen had the highest DOC concentrations over this time period, ranging from 57.0 ± 22.7 to 68.4 ± 13.2 mg/L (Figure 5). Pauciflora Fen also showed a similar increase in SUVA254 in 2018 (from 3.2 ± 03 to 4.6 ± 1.3 L mg1 m−1) as that observed at Poplar Fen.
3.3 DOC concentration across burn severity gradient in 2017/2018
Mean (± standard deviation) DOC concentration at the MB site increased from 32.3 ± 12.03 to 60.7 ± 5.6 mg/L between May 18 and July 31, 2017. The UB site showed a similar increase from 26.2 ± 6.0 to 57.1 ± 20.5 mg/L (Figure 6). Unfortunately, no July data were collected at the SB site due to extremely dry conditions; however, there was an increase from 46.0 ± 14.5 to 53.0 ± 21.9 mg/L between May 18 and June 26, 2017. In 2018, between July 7 and August 14, the MB site showed a decrease in DOC concentration (57.3 ± 13.1 to 41.9 ± 10.5 mg/L). The SB site showed a smaller decrease, from 53.9 ± 16.4 to 52.3 ± 11.7 mg/L (Figure 6). The UB site also showed a decrease in DOC concentrations, from 54.6 ± 17.5 to 45.2 ± 15.5 mg/L.
4 DISCUSSION
No clear effect of fire on DOC concentration was found, which we believe is due to the overriding influence of the hydrogeologic setting of the watershed, namely, the high variability of its groundwater connection. The lack of effect of fire on peat pore water DOC concentration is similar to studies across a range of different peatland sites (Burd et al., 2018; Grau-andrés, Gray, Davies, Scott, & Waldron, 2019; Lamontagne et al., 2000; Olefeldt et al., 2013) and other organic rich (nonpeatland) ecosystems (Jensen, Scanlon, & Riscassi, 2017; Mast & Clow, 2008). Grau-andrés et al. (2019) suggest that the combined fire effects of soil heating, decreased plant activity, and altered soil thermal dynamics were not important controls on DOC concentration. The limited effect of fire on DOC concentration in the present study is further supported by the results from the burn severity gradient in 2017/2018, where we also found little or no impact of the fire. Yet, we understand that DOC may have been flushed from the system in the early days after the fire and we could have missed any effect there. Although we did not directly look at soil temperature or plant productivity in this study, the increase in mean DOC concentration from 2016 (29.5 ± 7.3 mg/L) to 2017 (51.4 ± 13.5 mg/L) could be attributed to an increase in plant-sourced DOC from increasing vascular plant cover 1 year postfire.
The results of the LMM showed that the most significant control on DOC concentration at Poplar Fen was the WT at the beginning of each hydrologic year (i.e., HY-WT). Elmes et al. (2018) discussed the importance of high (near-surface) fall fen WT in promoting development of concrete ground ice and restricting the downward recharge of subsurface water to the underlying sand and gravel aquifer. In years when fall WT were sufficiently high (<20 cm b.g.s.; 2012, 2013, 2016), concrete ground ice was detected the following spring and water had been stored over the winter as ground ice. Conversely, when fall WT were lower (2014, 2015, 2017), concrete ground ice was not detected the following spring and the entire peat column was free to recharge the underlying aquifer. We observed higher DOC concentrations at 50 cm depth in the summers following a high HY-WT and lower DOC concentrations when the HY-WT was lower in the soil column. As ground ice was not present during hydrologic years with low fall WT, snow meltwater was free to infiltrate the fen surface during snowmelt and percolate to lower peat depths, raising the WT (cf. (Price & Fitzgibbon, 1987)). This freshet period would likely have a diluting effect on DOC concentrations from the influx of DOC-poor meltwater while also potentially flushing some of the accumulated DOC stock as discharge out of the watershed through the culvert at the road to the west (Figure 1). Conversely, as ground ice was present in the spring of hydrologic years with high fall WT, meltwater infiltration would therefore have been inhibited by the concrete ice layer, causing meltwater to either pond as standing water, or leave the watershed as surface water through the culvert with minimal soil interaction (Petrone et al., 2008; Petrone, Hinzman, Shibata, & Boone, 2007; Price, 1987). Moreover, as ground ice stores the relatively high DOC concentrated subsurface water over the winter, DOC-poor meltwater that does recharge the unsaturated zone would represent a smaller proportion of water held within the entire peat column, having less of an dilution effect on DOC concentrations in the fen. We also speculate a flushing effect within Poplar Fen, as mid-winter WT decline likely recharges an intermediate groundwater source, which exports water out of the watershed during groundwater recharge conditions (Elmes & Price, 2019). However, it must be noted that pore water shifts in DOC concentrations (as reported here) are not the same as DOC export (not measured in this study). In addition to the potential role of the spring freshet in diluting DOC concentrations, WT draw down or drier conditions in the peat profile could also cause oxidation of sulphur to sulphate, which can act to suppress the DOC solubility, resulting in lower concentration (Clark et al., 2005). Drier conditions under decreasing temperatures can also lead to a decrease in DOC production (Liu et al., 2014).
We observed an increase in SUVA254 values 2 years postfire, similar to Olefeldt et al. (2013), who highlighted that there was no clear effect of fire on pore water DOC from subarctic (permafrost) peatlands other than increase in aromaticity (Burd et al., 2018). This large increase in SUVA254 at Poplar Fen could be a specific response to wildfire through increased ash deposits in the system and/or a large rainfall event during July 2018, which may have caused a “mixing” of the DOC from various soil layers, causing greater aromaticity of the pore water sampled. Conversely, Evans et al. (2017) showed a reduction in SUVA254 in the initial postfire period (although this study is in a mountain catchment and not a peatland), which could indicate a flushing of UV-transparent plant-derived material. However, the authors also showed an increase in SUVA254 to above-background levels 2 years postfire, which could either be mobilization of more aromatic, soil derived organic matter or a reduction in plant-derived DOC. We also observed an increase in SUVA254 values at Pauciflora Fen in 2018 (Figure 5), a fen that was not impacted by the fire in 2016 and typically has a high water table. Although the magnitude of this increase is on a different scale to the increase at Poplar Fen, this indicates that there is still potentially a wider regional control on DOC dynamics, likely linked to meteorological conditions (Khadka et al., 2016). We did see an increase in electricial conductivity (EC) at Poplar Fen 1 year postfire (Table S1), which is to be expected given the large amount of ash/char in the system (Alauzis, Mazzarino, Raffaele, & Roselli, 2004; Hernández, Garcia, & Reinhardt, 1997; Heydari, Rostamy, Najafi, & Dey, 2017; Petrone et al., 2007). Therefore, although there was no clear effect of fire on DOC concentration at this site, we do see an impact on other environmental characteristics.
5 CONCLUSIONS
The results of this study highlight that DOC dynamics at this treed, moderate-rich fen are more likely be controlled by wider, regional hydrogeologic factors than by wildfire. We found no measurable effect of the fire directly, with no significant changes in pore water DOC concentrations at 50-cm depth postfire. This was supported by little difference in DOC concentration along a burn severity gradient within the same study site. We believe the antecedent hydrological conditions prior to freeze-up have an overall stronger effect on DOC concentrations, potentially overriding any affect the fire may have had. DOC concentrations were lower when the water table in the previous fall was low in the peat column and, conversely, higher when the water table was closer to the peat surface. However, we did find an increase in SUVA254 values 2 years postfire, which could be attributed to the fire due to increased DOC aromaticity linked to increased char deposits. Future research must take into account careful consideration of the local hydrogeologic setting and hydrological regime when predicting and analysing trends in DOC concentration and quality. To fully understand the impact of wildfire on fen DOC concentration, additional studies at other sites covering a range of topographic positions and geologic setting parameters would be key. Ultimately, although loss of ecosystem C from peatlands to the atmosphere as CO2 can be high after fire, we indicate the changes in the potential loss as DOC from this type of fen is not as substantial.
ACKNOWLEDGEMENTS
Funding for this project was provided by a Natural Sciences and Engineering Research Council of Canada (NSERC) Collaborative Research and Development (CRD) grant to J. S. P., R. P., and M. S. co-funded by Suncor Energy Inc., Imperial Oil Resources Limited, Teck and Shell Canada Energy and an NSERC Discovery Grant awarded to M. S.. The authors would like to acknowledge Canada's Oil Sands Innovation Alliance (COSIA) for its support of this project. We thank for M. Larsen for statistical analyses advice, M. Peacock for useful discussions in the early stages of the manuscript and the two anonymous reviewers for their constructive comments. Finally, we'd like to thank all the field assistants and students who have helped collect data over the years.
CONFLICT OF INTEREST
There are no conflicts of interest.
DATA AVAILABILITY STATEMENT
The data that support the findings of this study are available from the corresponding author upon reasonable request.


