Shrub patch configuration in relation to precipitation and soil properties in Northwest China
Abstract
Shrub patch configuration is a long-term evolutionary response to several environmental drivers and an equilibrium state in species competition. However, the variance in configuration along the precipitation gradient and its association with climate, soil, and adjacent vegetation remains unclear. Our study aimed to assess the variation of shrub patch configuration along a climatic gradient and the factors that affect shrub patch configuration, on the Inner Mongolia Plateau of Northwest China. Results showed that climate, soil, and vegetation contributed to 72.9% of the variance in shrub patch configuration. Interestingly, interspace/shrub radius ratio showed a decreasing trend with increasing precipitation transect. Patch size was positively correlated with aboveground biomass of interspace grass. Shrubs generally aggregated in high patches with low density on coarse soil texture, and vice versa. Moreover, shrub patches tended to occupy a larger percentage of landscape with increasing rainfall. To our knowledge, our study provides the first quantification of the effects of climate, soil, and vegetation on shrub patch configuration along a precipitation gradient in Northwest China and may contribute to a better understanding of the structure and functions of shrub ecosystems with a broader ecological application in arid and semiarid regions.
1 INTRODUCTION
Worldwide, shrub land has a wide distribution of 8.5 × 10⁶ km2 with a mosaic landscape of shrub patches interspersed with grass patches (Bonan, 2005; D'Odorico, Laio, & Ridolfi, 2006; Klausmeier, 1999). These shrub patches are important self-organized systems and serve as an “indicator” of ecosystem's response to climate change or human activities (Kéfi et al., 2007; Rietkerk, Dekker, Ruiter, & Koppel, 2004; Scheffer et al., 2009). They have distinctive and recurrent features of xeric regions but are different in scale and shape (Aguiar & Sala, 1999; House, 2003; Lefever & Lejeune, 1997; Rietkerk et al., 2004). These various configurations may correspond to various strategies of adaptation or optimization. Therefore, to determine the patterns of shrub patches and to recognize and quantify, the key influencing factors on patch scale will improve our understanding of plant ecological strategies and may help to predict some consequences of environmental change (Cleland et al., 2004; Moles et al., 2009). Many studies have investigated the shrub pattern characteristics and mechanisms underlying the patterns, revealing that the spots, labyrinths, gaps, and strips traits (among others) resulted from soil water redistribution and competition for limiting nutrients (Klausmeier, 1999; Rietkerk et al., 2004; Valentin & D'Herbès, 1999). However, interactions between shrub configuration and climate, soil, and vegetation at a large scale in Northwest China remain unclear.
Shrub patch configuration can be defined as spatial plant traits of cover, size, density, height, shape, and biomass allocation and distribution relationships with adjacent bare ground or grass patches (Ravolainen, Bråthen, Ims, Yoccoz, & Soininen, 2013). Previous studies indicated that these community structure and ecological attributes could be shaped by climatic factors, such as precipitation and temperature (Bai et al., 2008; Lawes & Piper, 1999; Mckenzie, Peterson, Peterson, & Thornton, 2003; Pyke, Condit, Aguilar, & Lao, 2001; Zhu, Ma, Yan, & Hu, 2007). For example, aboveground and belowground biomass is positively correlated with precipitation amount in temperate grassland, and vertical root distribution is also significantly affected by precipitation (Ma, Yang, He, Zeng, & Fang, 2008). Shrub density, height, and cover significantly increase along with increasing rainfalls in savannah systems (Shackleton & Scholes, 2011). In Patagonian rangelands, climatic variables explain 60%, 52%, and 12% of the variation in grass cover, shrub cover, and species richness (Gaitán et al., 2014). Most study regards that water reallocation from bare areas to vegetated bands causes anisotropy of resources, leading to banded systems (Couteron & Lejeune, 2001; Greig-Smith, 1979; White, 1971). Whereas patch shape changes from banded to spotted when the dominant driver of material redistribution changes from water to wind which facilitates homogenous distributions of soil resources (Aguiar & Sala, 1999; Okin & Gillette, 2001). The mechanisms underlying vegetation pattern formation are intrinsically dynamic (Borgogno, D'Odorico, Laio, & Ridolfi, 2009; Greig-Smith, 1979).
Moreover, the development of self-organized random configurations is the result of spatial interactions between plants during short-term and long-term competitions (Cipriotti & Aguiar, 2015; Lefever & Lejeune, 1997; Turnbull, Wainwright, Brazier, & Bol, 2010; Valentin, D'Herbès, & Poesen, 1999). For instance, the spacing between plants is due to root competition for water in xeric regions (King & Woodell, 1973). Previous research also showed that shrub patch configuration was related to species diversity of adjacent herbaceous vegetation (Ravolainen et al., 2013). In addition, shrub patch configuration can also be affected by the characteristics of plant species, such as plant age, drought tolerance, and sensitivity to climate change (Engelbrecht et al., 2007; Peter, Pugnaire, Clark, & Incoll, 1996; Retuerto & Carballeira, 2004).
Apart from climatic factors, patch configuration also largely depends on edaphic conditions, such as soil fertility, texture, and moisture (Bilyeu, Cooper, & Hobbs, 2008; Ravolainen et al., 2013; Schickhoff, Walker, & Walker, 2002). Soil is the main site where biological, physical, and chemical processes occur and it provides water and nutrients necessary for the growth and development of vegetation (Li, 2011). For instance, shrub patch size and cover increase with soil nutrient (Chen et al., 2015) and shrub early establishment rate also increases with soil moisture and nutrient availability (Cipriotti, Aguiar, Wiegand, & Paruelo, 2012).
The shrub patch configuration observed is considered a long-term evolutionary response to environmental factors and an equilibrium state during interspecific competition for space. Different configurations might correspond to different strategies of adaptation or optimization (Manfreda, Caylor, & Good, 2017). However, the configuration variance across a large scale and its integrated interactions with climate, soil, and vegetation remain largely unknown. The Inner Mongolian Plateau has a wide distribution of shrub species with attributes of high drought resistance and sand stabilization, providing ecological benefits to the fragile local environment. We considered the self-organized system of shrub patch and the interspace as shrub patch configuration in our study and regarded it as a single unit, to explore its variation and relationships with climatic, soil, and vegetation factors across a precipitation gradient on the basis of a dataset of 18 plots sampled at six sites in the Inner Mongolian Plateau of Northwest China. Specifically, we aimed to ascertain the following issues: (a) the characteristics of shrub patch configuration in each site and their differences along the precipitation gradient and (b) the mechanisms underlying the variation in shrub patch configuration with climatic factors, soil properties, and vegetation traits.
2 MATERIALS AND METHODS
2.1 Study area
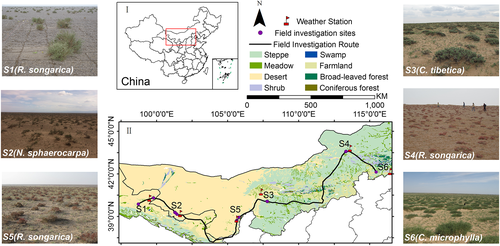
The Inner Mongolia Plateau is located in Northwest China and is characterized by a continental temperate climate (Figure 1). From the northeast to southwest, it is characterized by an increase in solar radiation and air temperature, and a decrease in precipitation, resulting in a strong climatic drought gradient (Xie, Guo, Gabler, Li, & Ma, 2015). This climatic gradient provides an ideal transect for studying the changes in shrub patch configuration. An east–west transect was established along the climatic gradient in the study area (Figure 1). Six sample sites (S1–S6) were selected from the precipitation gradient in sequence. This transect covers semiarid, arid, and extremely arid areas associated with landscapes of typical steppe, desert steppe, and Gobi Desert, respectively. All sites have a long history of grazing except S1 which located in Gobi desert with extremely arid environment. Mean annual precipitation (MAP) of the six study sites ranged from 54 to 322 mm, whereas mean annual temperature (MAT) ranged from 2.7 to 12.9 °C (Table 1). All meteorological data from the weather stations were obtained from the China Meteorological Data Sharing Service System. The altitudes varied from 995 to 1521 m. The main shrub and grass species found at each site are listed in Table 1. The dominant shrubs were Reaumuria songarica, Nitraria sphaerocarpa, Caragana tibetica, and Caragana microphylla, whereas the associated dominant grasses were Cleistogenes squarrosa and Stipa capillata. Soil types included Hapli-Orthic Aridisols, Sali-Orthic Aridisols, and Hapli-Ustic Cambisols. Soil texture changed from sand (S1), loamy sand (S2, S3, and S4), and sandy loamy (S5) to sand (S6) again, along the MAP transect.
| S1 | S2 | S3 | S4 | S5 | S6 | |
|---|---|---|---|---|---|---|
| MAP (mm) | 54 | 116 | 145 | 191 | 210 | 322 |
| MAT (°C) | 8.5 | 8.9 | 7.9 | 3.2 | 12.9 | 2.7 |
| Altitude (m) | 1160 | 1449 | 1186 | 995 | 1521 | 1423 |
| AI | 55.5 | 24.4 | 17.2 | 13.7 | 13.2 | 6.6 |
| Vegetation type | Gobi Desert | Desert steppe | Desert steppe | Desert steppe | Typical steppe | Typical steppe |
| Main shrub | Reaumuria songarica | Nitraria sphaerocarpa; Salsola passerina | Caragana tibetica; Atraphaxis frutescens | Reaumuria songarica | Reaumuria songarica; Salsola passerina | Caragana microphylla |
| Main grass | Few | Few | Stipa capillata; Cleistogenes squarrosa | Cleistogenes squarrosa; Stipa capillata | Cleistogenes squarrosa; Stipa capillata | Cleistogenes Squarrosa |
| AGB-s (g/m2) | 30.16 | 61.20 | 127.73 | 56.84 | 107.23 | 41.80 |
| BGB-s (g/m2) | 8.95 | 70.13 | 96.75 | 189.37 | 176.41 | 99.97 |
| BGB-s/AGB-s | 0.52 | 1.45 | 0.79 | 3.28 | 1.74 | 2.39 |
| Shrub cover (%) | 3.27 | 8.47 | 7.50 | 6.34 | 17.66 | 13.33 |
| Shrub height (cm) | 38.7 | 16.1 | 8.5 | 7.7 | 18.5 | 21.5 |
| Shrub density | 0.08 | 0.61 | 0.54 | 1.04 | 0.93 | 0.32 |
| Patch size (m2) | 0.52 | 0.15 | 0.16 | 0.07 | 0.25 | 3.33 |
| Interspace/shrub radius | 9.89 | 4.37 | 5.31 | 5.51 | 2.72 | 2.91 |
| Grass cover (%) | 0 | 0.5 | 20.7 | 5.4 | 9.1 | 43.0 |
| AGB-g (g/m2) | 0 | 0.29 | 15.2 | 3.5 | 8.2 | 142.7 |
| H′ | 0 | 0.32 | 1.98 | 1.26 | 1.80 | 2.21 |
| TN (%) | 0.010 | 0.016 | 0.051 | 0.064 | 0.043 | 0.114 |
| TP (%) | 0.035 | 0.029 | 0.031 | 0.032 | 0.041 | 0.023 |
| SOM (%) | 0.185 | 0.321 | 0.840 | 1.015 | 0.681 | 1.897 |
| Sand (%) | 95.29 | 81.84 | 83.98 | 83.32 | 77.28 | 90.01 |
| Silt (%) | 3.51 | 10.69 | 6.15 | 7.13 | 13.85 | 4.71 |
| Clay (%) | 1.2 | 7.47 | 9.87 | 9.55 | 8.87 | 5.28 |
| Soil texture | Sand | Loamy sand | Loamy sand | Loamy sand | Sandy loam | Sand |
- Note. MAP = mean annual precipitation, MAT = mean annual temperature, AI = aridity index, AGB-s = aboveground biomass of shrub, BGB-s = belowground biomass of shrub, BGB-s/AGB-s = the ratio of shrub belowground to aboveground biomass, H′ = Shannon–Wiener index, TN = total nitrogen, TP = total phosphorus, SOM = soil organic matter.
2.2 Field survey
The field plant and soil investigations were carried out from 12 to 24 August 2011 across the Gansu province, Ningxia Hui Autonomous Region, and Inner Mongolia Autonomous Region. In the 2000 km route (Figure 1), we investigated the vegetation quadrats, patch patterns, and individual shrubs, and carried out soil sampling at the above six sample sites, separately as S1 (54 mm; 12 to 13 August), S2 (116 mm; 14 to 15 August), S3 (145 mm; 18 to 19, Aug.), S4 (191 mm; 21 August), S5 (210 mm;16 to 17 August), and S6 (322 mm; 23 to 24 August). All these regions are characterized by dry climate, low and erratic precipitation, strong solar radiation, and wind.
 (1)
(1) (2)
(2)Where Ra is the extraterrestrial radiation (MJ m−2 day−1), which can be estimated according to the equations provided by FAO (Food and Agriculture Organization) for each day of the year and for different latitudes (Allan, Pereira, Raes, & Smith, 2005); TC means daily temperature (°C); TR is the daily temperature range (°C).
2.3 Data analysis
Curve fitting and correlation of shrub patch configuration and biomass was conducted using version 19.0 of the SPSS software (SPSS Inc., Chicago, IL). Then we used a forward stepwise regression method to drop non-significant variables before they were included into the general linear models (GLMs) to explore the explanations of climatic, soil, and vegetation factors on shrub patch configuration. Landscape index analysis was conducted using Fragstats 4 (Cover, 1982). Principal component analysis (PCA), redundancy analysis (RDA), and variation partitioning were conducted using Canoco 5.0 (Parkhurst, 2003). PCA constructs two theoretical variables that best fits the data according to a linear model. The theoretical variable is the first and second ordination axis (PC1 and PC2). The case scores are the values that the theoretical variable takes in the cases. The theoretical variable/ordination axis does not need to be related to any observed explanatory variable. The ordination diagram was used to display the result of PCA. RDA is a multiple regression for all responses variables simultaneously (i.e., a multivariate regression) with linear constraints on the regression coefficients. Because of the constraints, RDA uses less parameters than multivariate multiple regression. In summary, RDA is thus both a constrained form of PCA and a constrained form of multivariate multiple regression. In PCA ordination diagram and RDA figures, a positive correlation is expected when the arrows of two variables point to same direction, and the angle between two arrows is inversely proportional to the degree of their correlation. The longer the arrows, the better relationship indicated between variables and the canonical axes. The variation partitioning analyses partition the variation (or variance) in the response variables into parts attributed to sets of explanatory variables. The analysis uses the forward selection of group members to select a set to explain response variables and also perform a permutation test of the joint effect of all the candidate members of each group as recommended (Blanchet, Legendre, & Borcard, 2008). All patch configuration, climate, soil, and vegetation variables were transformed as log (x + 1) for the normalization in ordination diagram, RDA and variation partitioning analysis. All statistical analyses were carried out using the p = .05 confidence level (*p < .05; ** p < .01), coefficient of correlation analysis is represented by r.
3 RESULTS
3.1 Overall climatic, vegetation, and soil characteristics
Meteorological, plant, and soil characteristics are listed in Table 1. AI was negatively correlated with MAP (r = −0.841**). S1 was the driest site and S6 was the wettest in the transect. Main shrub species varied from R. songarica to C. microphylla, showing an increasing trend in coverage with more MAP. Among them, R. songarica was widely distributed (in S1, S4, and S5) and its AGB-s increased with increasing MAP. However, BGB-s of this species was higher in S4 and S5 but extremely low in S1 (8.95 g/m2). BGB-s of other three sites was close to each other. Interestingly, BGB-s/AGB-s ratio also exhibited an increasing trend along rising MAP gradient. Shrub height, density, and size all showed a parabolic relationship with MAP, indicating higher, sparser, and larger shrub patches in S1 and S6 and shorter, denser, and smaller ones in S3 and S4. Interspace developed from bare ground to grassland, grass cover, AGB-g, and H′ increased with MAP except in S3. AGB-g was extremely high (134.6 g/m2) in S6, but much lower in other sites. Remarkably, the interspace/shrub radius exhibited a significant decreasing trend along with precipitation (p = .064). Third, TP remained stable across study sites, but TN and SOM were positively correlated MAP, increasing from west to east in spatial distribution (p = .006). Soil particle size (sand, silt, and clay) did not show obvious variation patterns along the MAP gradient.
3.2 Variation of shrub patch configuration along the climatic gradient
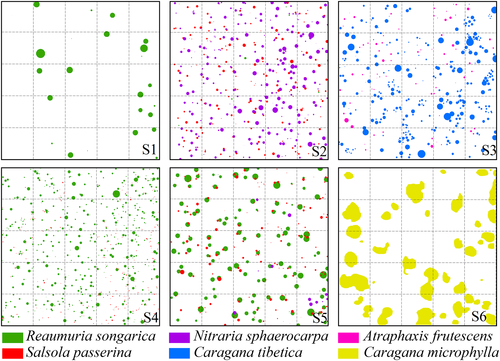
It was observed that the shape of shrub patch tended to change from spot in the site with low precipitation to strip in the site with high precipitation (Figures 1 and 2). In Figure 2, the size of shrub patch was relatively large in S1 (MAP = 54 mm) and S6 (MAP = 322 mm). R. songarica was the only shrub species in the S1 without grass in the interspace and shrub patch, whereas C. microphylla coexisted with grasses. In other sites, two or more shrub species coexisted with the mosaic of shrub patches and interspace grass patches.
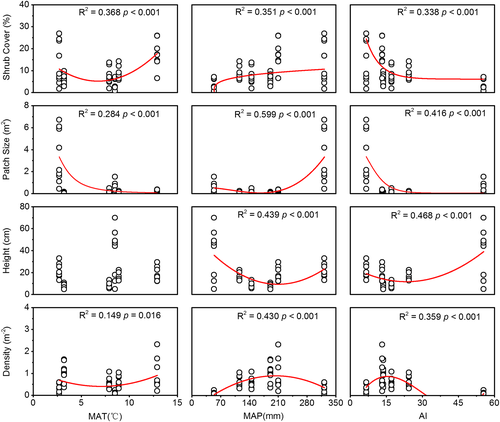
Changes in shrub cover, patch size, height, and density along with increased gradient of MAT, MAP, and AI are presented in Figure 3. MAP had the strongest relationship with these indicators. Shrub cover significantly increased with increasing MAP. Other indicators all showed parabola fitting with precipitation (Figure 3). There were obvious trends in the spatial traits of shrub patches with AI. For instance, shrub cover and patch size decreased with increasing AI at a significant level (p < .001). These trends were consistent with results shown in Table 1. However, temperature showed a weaker effect on these indicators. For example, shrub height had no correlation with MAT; shrub cover increased with MAT after first decreasing significantly.
Interspace/shrub radius decreased with increasing MAP following a linear function (Figure 4a). Shrub patches were distributed more closely (Figure 2e), and patch size increased (Figure 2f) with increasing MAP. Interspace/shrub radius was approximately 10, 5, and 3 under the gradients of 0–100, 100–200, and 200–400 mm, respectively. The index was more than threefold in S1 (MAP = 54 mm) of the S6 (MAP = 322 mm) at a decrease rate of 2.2/100 mm. In contrast, BGB-s/AGB-s showed a linear positive correlation with MAP (Figure 4b). BGB-s/AGB-s of S6 was 4.6-fold that of S1 and increased at the rate of approximately 0.7/100 mm. Generally, shrubs had less interspace among them and allotted more percentage of biomass to belowground (0–1 m) part under more MAP conditions.

Shrub patch configuration (shrub cover, density, height, patch size, BGB-s/AGB-s, and interspace/shrub radius) of 18 plots in six sites were used to do PCA ordination diagrams (Figure 5). Relative distances, relative directions or relative ordering of sample plots, and arrow lines were used to interpret these results. In this figure, configuration dissimilarities between two plots are positively correlated with their relative distances. The arrow points in the direction in which the configuration variable value increases at the largest rate across the PC axis. The rate of change in the orthogonal direction is zero. The arrow can be extended on either side to form a line. By projecting the plot points on the line and ranking the projection points, a ranking can be obtained for that particular configuration variable. Two theoretical variables constructed by PCA are the first and second ordination axis (PC1 and PC2), which does not relate to any observed explanatory variable. The case scores in the brackets are the values that the theoretical variable takes in the cases (40.1% and 29.6%). First, three replicates of each study site showed a close distribution, suggesting its internal similarity. S2, S3, and S4 (Figure 5) overlapped due to some similarities in shrub cover and interspace/shrub radius (Table 1). Second, the distance between the sample points approximated their differences in configurations. Thus, the study sites could be divided into four groups according to their spatial traits as S1 (MAP = 54 mm), S2 to S4 (116–191 mm), S5 (210 mm), and S6 (322 mm). Among them, S1 greatly differed in interspace/shrub radius and shrub cover, thus it was isolated from the other sites. Lastly, some of these variables were correlated. For instance, shrub cover and interspace/shrub radius were negatively correlated (r = −0.797**). Shrub height and density also showed a negative relationship (r = −0.510*), with low shrub patches usually linked with dense distribution. Analysis of the above results showed that shrub patch tended to occupy a larger percentage of landscape and had less interspace under more MAP conditions. Shrub patch varied from larger, higher, and sparser shrub patches in S1 to smaller, shorter, and denser ones from S2 to S4 and then to higher and larger ones in S5, but sparser in S6.
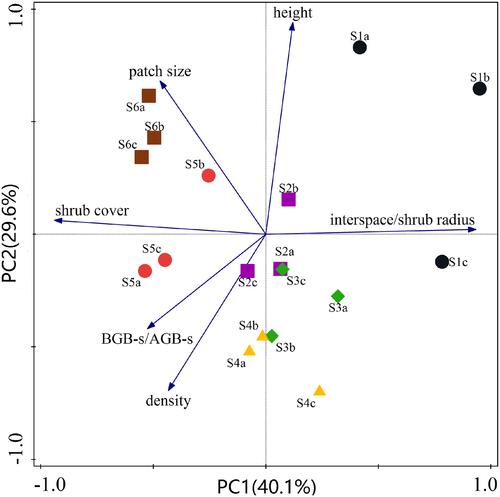
Table 2 shows landscape indexes of the six sites. Number of patches (NP) was used to describe landscape heterogeneity. NP was low in the S1 and S6 (NP = 45, 172; MAP = 54, 322 mm, respectively) sites whereas the maximum values were observed in S4 (NP = 656, MAP = 191 mm), showing the trend of decrease after first increase along with increasing precipitation gradient. In addition, S1 and S6 showed many similarities in other indices that differed from the corresponding values in other sites. The ratio of the largest patch to total patch area (LPI) was significantly larger in S1 (20.9%) and S6 (15.8%) than in the other sites (1.5–3.8%). Contiguity index (CONTIG), which was an important index in landscape pattern, showed the aggregation extent or extending trend. CONTIG was a little higher in the S1 and S6 sites, reflecting more small patches from S2 to S5, whereas the dominant patches in S1 (R. songarica) and S6 (C. microphylla) already formed better connectivity. The results of connectance index (CONNECT) and patch cohesion index (COHESION) also reflected similar trends. Interspersion juxtaposition index was used to determine the overall dispersal and gathering conditions on a landscape scale. IJI was low in all sites, indicating that shrub patches connected few other patch types. In conclusion, S1 and S6 had many similarities in all landscape indices and formed scattered distribution with better connectivity. Other sites were characterized by dense distribution with small shrub patches.
| Sites | NP | LPI % | CONTIG % | CONNECT % | COHESION % | IJI % |
|---|---|---|---|---|---|---|
| S1 | 45 | 20.9 | 59.8 | 1.9 | 99.5 | 0 |
| S2 | 453 | 2.8 | 51.8 | 1.0 | 97.7 | 3.0 |
| S3 | 586 | 3.8 | 51.4 | 0.9 | 97.3 | 0.6 |
| S4 | 656 | 2.6 | 50.6 | 1.0 | 96.1 | 0.5 |
| S5 | 561 | 1.5 | 52.9 | 1.1 | 97.8 | 5.1 |
| S6 | 172 | 15.8 | 58.7 | 1.6 | 99.2 | 1.4 |
- Note. NP = number of patches, LPI = largest patch index, CONTIG = contiguity index, CONNECT = patch connectance index, COHESION = patch cohesion index, IJI = interspersion juxtaposition index.
3.3 Combined effects of climate, vegetation, and soil on shrub patch configuration
Multivariate analysis methods, such as RDA, GLMs, and variation partitioning were applied to analyse the combined effects of climate, vegetation, and soil on shrub patch configuration. In these three analysis, MAT, MAP, and AI were selected to represent climatic factors, H′, and AGB-g to represent vegetation factors and TN, TP, SOM, and sand to represent edaphic conditions, to assess their contribution to the changes in shrub patch configuration, which was represented by shrub height, cover, patch size, density, interspace/shrub radius, and BGB-s/AGB-s (Table 3).
| Category | Indicators | |
|---|---|---|
| Explanatory variables |
Vegetation Climate Soil |
H′, AGB-g MAT, MAP, AI TN, TP, SOM, sand |
| Response variables | Shrub patch configuration | Shrub cover, patch size, height, density, interspace/shrub radius, BGB-s/AGB-s |
- Note. RDA = redundancy analysis, GLMs = general linear models, H′ = Shannon–Wiener index, MAT = mean annual temperature, MAP = mean annual precipitation, AI = aridity index, TN = total nitrogen, TP = total phosphorus, SOM = soil organic matter, BGB-s/AGB-s = the ratio of shrub belowground to aboveground biomass.
Results of the RDA analysis showed a comprehensive relationship between explanatory variables and indicators of shrub patch configuration (Figure 6). As introduced before, the RDA is interpreted by the line length and the angles between two arrows. Red arrow lines represent environmental/explanatory variables, including climate, soil, and vegetation variables, whereas blue arrow lines stand for response variables of shrub patch configuration. Many of these variables or indicators were strongly correlated, such as MAP and shrub cover (r = 0.647**), AGB-g and patch size (r = 0.958**), AI and interspace/shrub radius (r = 0.913**), and sand and density (r = −0.634**). Climate (e.g., MAP and AI), vegetation (e.g., H′ and AGB-g), and soil (e.g., TN, SOM, and sand) all had significant contributions to these two axes. However, there was also strong correlation between the explanatory variables. Therefore, GLMs was used to explore the explanatory variables for each configuration indicator.
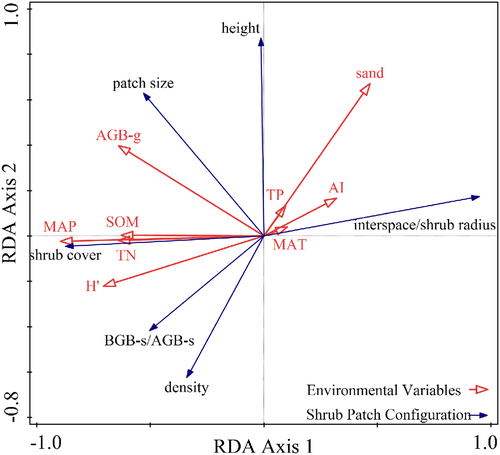
GLMs results revealed that climatic factor could explain 84.2% of the total variance in shrub cover, 55.7% in height, 61.9% in interspace/shrub radius, and 20.0% in BGB-s/AGB-s (Table 4). AGB-g and MAT were the primary factor affecting BGB-s/AGB-s, whereas MAP and MAT combined was the major factors determining shrub cover and interspace/shrub radius. Shrub height was positively correlated with AI. GLMs also revealed that soil texture (sand) was the key factor in determining shrub density (Table 4). Soil could explain 14.0% of the variance in shrub height, 40.2% in density, and 15.9% in interspace/shrub radius. In general, shrub patches showed high aggregation patterns but were separated from each other in space with coarse soil texture, such as S1 and S6. In contrast, shrubs dispersed to low patches but were close to each other in sites with fine soil texture, such as S2 and S4 (Figure 2). The results also showed that vegetation factors (AGB-g) could also improve the explanatory power for patch size and interspace/shrub radius to 91.8% and 19.7%, respectively. AGB-g was the primary factor affecting patch size. According to the stepwise regression, there were significant negative correlations between shrub height and SOM, density and sand, AGB-g, MAP, MAT and interspace/shrub radius, AGB-g MAT, and BGB-s/AGB-s (Table 4, coefficient). Other factors were all positively correlated.
| Configuration indicator | Coefficient | SE | p | SS% | |
|---|---|---|---|---|---|
| Shrub cover | MAP | 0.079 | 0.028 | .014 | 41.8 |
| MAT | 1.150 | 0.200 | <.001 | 42.4 | |
| Patch size | AGB-g | 0.016 | 0.003 | <.001 | 91.8 |
| AI | 0.031 | 0.007 | .001 | 2.9 | |
| Height | AI | 1.038 | 0.200 | <.001 | 48.9 |
| MAP | 0.443 | 0.100 | <.001 | 6.8 | |
| TP | 744.723 | 205.378 | .003 | 8.8 | |
| SOM | −13.907 | 5.987 | .037 | 5.2 | |
| Density | Sand | −0.047 | 0.016 | .008 | 40.2 |
| Interspace/shrub radius | AGB-g | −0.027 | 0.005 | <.001 | 19.7 |
| Sand | 0.347 | 0.028 | <.001 | 15.9 | |
| MAP | −0.021 | 0.006 | .005 | 52.4 | |
| MAT | −0.076 | 0.035 | .048 | 9.5 | |
| BGB-s/AGB-s | AGB-g | −0.014 | 0.005 | .019 | 7.8 |
| MAT | −0.199 | 0.058 | .004 | 20.0 |
- Note. MAP = mean annual precipitation, MAT = mean annual temperature, AGB-g = aboveground biomass of grass, AI = aridity index, TP = total phosphorus, SOM = soil organic matter.
- Estimated regression coefficients (coefficient), standard error of regression coefficients (SE), significant level (p), and percentage of sum of squares explained (%SS) are reported for each variable.
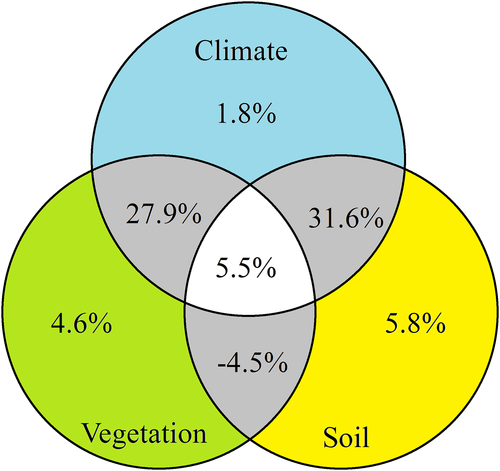
Furthermore, variation partitioning analysis was made to quantitatively analyse the total effects of climate, vegetation, and soil on shrub patch configuration and their combined effects. The variation explained figure (Figure 7) displays the computed explanation of the seven variation fractions and compares them, as percentages, with respect to the total variation in the response data. In total, climate, soil, and vegetation explained 72.9% of shrub patch configuration at a significant level. Edaphic conditions made the largest contribution (5.8%), whereas climate accounted for just 1.8%, but their combined effects explained 31.6% of the shrub patch configuration. Vegetation alone contributed 4.6%, and the combined effects of climate and vegetation were 27.9%. The interaction of climate, soil, and vegetation factors accounted for 5.5% of configuration variations.
4 DISCUSSION
The results of this study suggest that shrub patch configuration was affected by climatic, soil, and vegetation factors together. First, we observed that shrub cover increased with precipitation amount. MAP contributed to the variation in shrub cover by 41.8% (r = 0.647**). This is consistent with previous studies which showed that precipitation was a major factor affecting shrub patch structures (Chen et al., 2015; Gaitán et al., 2014). Woody cover also significantly increased along increased rainfall gradients in Australian and South African savannah systems (Shackleton & Scholes, 2011; Williams, Duff, & Cook, 1996). The positive relationship (coefficient = 0.079) between shrub cover and MAP, observed in the present study, is also consistent with previous studies (Chen et al., 2015; Duniway, Snyder, & Herrick, 2010; Li, Zhang, Peng, Hu, & Ma, 2013; Puigdefábregas, 2005; Yao, Peters, Havstad, Gibbens, & Herrick, 2006), indicating that rainfall was important for the development of shrub patches. Furthermore, the observed coefficient between shrub cover and MAP (0.079) was also in line with previous findings in the MAP gradient (157–362 mm) of Inner Mongolian Plateau (0.07). In general, shrub cover was seemed to be the long-term evolutionary response to precipitation conditions across years.
Second, it is remarkable that interspace/shrub radius decreased with increased MAP, which explained 52.4% of variance in interspace/shrub radius (r = −0.785**). Shrub patches and interspace together form a landscape mosaic of sources and sinks of water and nutrients, with interspace serving as a runoff producing zone and shrub as a water and nutrient concentration zone (Reynolds, Virginia, Kemp, Soyza, & Tremmel, 1999; Wilcox, Breshears, & Allen, 2003). This source-sink relation could concentrate 2–4 fold of rainfall under vegetation patches (Tongway, Valentin, & Seghieri, 2001), due to improved soil aggregation and macroporosity related to biological activity and vegetation roots (Ludwig, Wilcox, Breshears, Tongway, & Imeson, 2005). Therefore, soil moisture accumulates in shrub root zone and affects root growth and aboveground organization (Ursino, 2009). Per unit area of interspace can support more shrub patches under greater MAP; thus, shrub patches require less interspace among them to explore moisture. In response to larger MAP, shrub density increased at first to exploit water from the interspace (Figure 2b–d, MAP = 116–191 mm), and then aggregated to larger clusters with broader interspace with increasing MAP (Figure 2e–f, MAP = 210–322 mm).
However, BGB-s/AGB-s is opposite to most previous studies which prove that it declines with MAP (Schulze et al., 1996; Walter, 1971). This is also reasonable because the shrub species in our study are deep-rooted, but we only collected the roots of 0–1 m, the upper part of whole roots. For example, Zhang et al. found that R. songorica extended to more than 2.4 m, almost no absorbing roots were found in the upper 0–0.4 m of the soil profile and most fine roots clustered below 1.4 m in extremely arid environment (Zhang et al., 2017). Shrubs only develop tap roots in the upper layers in the xeric site and tap roots, lateral roots, and fine root simultaneously in the upper soil profile under better moisture condition (Zerihun, Montagu, Hoffmann, & Bray, 2006). Moreover, other factors may also effect on this ratio. In attempting to reveal generalized shrub patch configurations across a large scale of MAP gradient, an unintended consequence of this approach is that it generates not only are MAP gradients but also a host of other environmental variables and species change that can affect BGB to AGB ratio.
Third, our results showed that AGB-g could explain 91.8% of variance in shrub patch size. Shrubs formed larger patches coupling with higher AGB-g. Interaction between grasses and shrubs might shape shrub patch configuration. For example, native grasses could control the shrub demography by competing with juvenile shrubs for overlapped water resource of upper soil layer (Chen et al., 2015; Cipriotti et al., 2012). Root competition for water in xeric regions might also affect patch size and spacing between them (King & Woodell, 1973). Positive relationship between species diversity of interspace grass (H′) and shrub cover (r = 0.557*) was consistent with previous studies (Chen et al., 2015; Gaitán et al., 2014; Hao et al., 2016; Koyama, Sasaki, Jamsran, & Okuro, 2015; Ravolainen et al., 2013). In tundra, shrubs with highly broken forms are usually accompanied by low grass diversity and richness (Ravolainen et al., 2013). Juvenile shrubs may fail to establish in the interspace grassland with high AGB-g and H′ due to high competition with grasses. In contrast, the juvenile shrubs can easily develop from their original clusters which could provide enough water, nutrients, suitable microhabitat, and nursing (Griffith, 2010; Rango, Tartowski, Laliberte, Wainwright, & Parsons, 2006; Schlesinger & Pilmanis, 1998). Thus, shrubs expanded from inside towards outside, forming large patches across years, such as C. microphylla in S6. Juvenile shrubs may also establish in the interspace with little grass, thus forming denser and smaller patches as observed for R. songarica in S4. Therefore, these self-organized random configurations are an adaptation strategy and equilibrium state in plants competing for space.
Climate, together with both vegetation and soil, largely explained the variance in shrub patch configuration (Figure 7). This might be due to the significant correlation between explanatory variables. For example, MAP and AGB-g (r = 0.810**), H′ (r = 0.787**), TN (r = 0.882**), and SOM (r = 0.875**) were all significantly correlated. MAP might affect the structure of shrub patch by coupling with vegetation and soil, reflecting its large indirect effect on shrub patterns. Vegetation factors and soil properties could affect precipitation redistribution between shrub and grass patches (Hao et al., 2016; Valentin & D'Herbès, 1999; Wilcox et al., 2003). These resource redistributions and spatial interactions among adjacent plants might explain the formation of these patterns (Hardenberg, Meron, Shachak, & Zarmi, 2001; Hillerislambers, Rietkerk, Bosch, Prins, & Kroon, 2001; Klausmeier, 1999; Lefever & Lejeune, 1997).
Our results have important implications for the management and conservation of shrubland in the context of ongoing climate change. Regional models of climate change over Inner Mongolia Plateau reveals that MAP is projected to increase by 30–100 mm in the next 100 years (Ni & Zhang, 2000). Rainfall change could bring the change of AI, soil moisture, and AGB-g (among others) consequently. The direct and indirect effects of precipitation change will probably transform the configuration of shrub patches. Therefore, the result of interaction between above factors and patch configurations could be applied to predict shrub patch appearance in the future, providing government agencies with “early warning” signals (e.g., shrub expansion) under climate change. In addition, the association of BGB-s/AGB-s with climate factors will be very useful to estimate biomass with models; the interaction between shrub height, density, and soil texture might be useful to remote sensing soil properties form vegetation appearance; and those between patch size and grass biomass might help to understand grazing impacts on shrub encroachment into grassland.
5 CONCLUSION
In conclusion, shrub configuration was similar within each site and formed four groups, S1, S2 to S4, S5, and S6, according to their spatial traits. Spatial patterns varied from large, high, and sparse patches in S1 to small, short and dense ones from S2 to S4 and then to high, and large ones in S5 but sparse in S6. Shrub patches tended to occupy a higher coverage with less interspace among them across the increased precipitation transect. Interspace/shrub radius was approximately 10, 5, and 3 under the MAP gradients of 0–100, 100–200, and 200–400 mm, respectively. Interspace developed from bare ground to grassland and grass cover, AGB-g, and H′ increased.
In total, climate, soil, and vegetation explained for 72.9% of variance in shrub patch configuration, of which the combined effects of soil/vegetation and climate were as large as 31.6% and 27.9%, respectively. In particular, 84.2% and 55.7% of variance in shrub cover and height were mainly explained by climatic factors, whereas shrub density was mainly affected by soil texture (40.2%). Patch size was determined by vegetation factors (91.8%), and interspace/shrub radius was controlled by these three factors together.
Our study regarded shrub patches and interspace as a single unit to explore patch configuration variation and provided, to our knowledge, the first quantification of the effects of climate, soil, and vegetation on it across a large scale in Inner Mongolia Plateau. Some of these results could be the basis for further studies and showed application value in shrubland management. They also provide fundamental insights into characterizing and understanding the structures and functions of ecosystems and improve the understanding of shrub adaptation and optimization strategies in such valuable ecosystems and similar regions worldwidely.
ACKNOWLEDGEMENTS
The study was financially supported by the National Natural Science Foundation of China (NSFC 91425301 and 91625101), the PCSIRT (IRT_15R06) and projects supported by the State Key Laboratory of Earth Surface Processes and Resource Ecology, and by Ten Thousand Talent Program for leading young scientist. Special thanks were given to Buli Cui, Xiaona Yu and Siyi Zhang for their assistance in field survey.
CONFLICT OF INTEREST
The authors declare that they have no conflict of interest. This article does not contain any studies with human participants or animals performed by any of the authors.
AUTHOR CONTRIBUTIONS
X. L. and Y. H. conceived the idea and designed the experiments; X. L., Y. H., J. Z., L. L., Z. J., and Q. L. performed the field investigation; and Y. F., X. L. analysed the results and wrote the manuscript.


