Corrigendum to Typha for Paludiculture—Suitable Water Table and Nutrient Conditions for Potential Biomass Utilization Explored in Mesocosm Gradient Experiments
Haldan K, Köhn N, Hornig A, Wichmann S, and Kreyling J. 2022 “Typha for Paludiculture—Suitable Water Table and Nutrient Conditions for Potential Biomass Utilization Explored in Mesocosm Gradient Experiments.” Ecology and Evolution 12:e9191. https://doi.org/10.1002/ece3.9191
When calculating the amount of fertilizer needed to reach the target amounts of N, P, and K in the experiment, a calculation mistake was made. This means that the fertilizer amounts which we added to the experiment resulted in different nutrient target amounts than stated in the original paper. The actual target amount of N addition is about 13.94 times higher than stated in the paper. The actual nutrient addition gradient ranges from addition of 50.2–5576.2 kg N ha−1 a−1. In the water table treatments, plants were fertilized with a nutrient solution equivalent to the middle level (level 8) of the nutrient addition treatment. This nutrient addition was erroneously stated as 37.9 kg N ha−1 a−1 in the original paper, but it actually amounts to 529.0 kg N ha−1 a−1. The target amount of N as well as the amounts of chemicals used for fertilization were specified in Table 2. The amounts of chemicals used for fertilization presented in Table 2 are correct; however, the specified target amount of N is not. Therefore, we have attached a corrected version of Table 2 to this corrigendum. As the nutrient addition was different than originally intended, nutrient ratios are also different than intended. The N/P ratio in our experiment was 5.12, the N/K ratio was 0.51.
For the reader, this essentially means that all amounts of nutrient addition in the original paper, given as kg N ha−1 a−1, have to be multiplied by 13.94 to obtain the actual amounts of N addition. Special attention must be paid whenever the nutrient additions of our experiment are mentioned in the results and discussion. All patterns of the originally presented figures remain, but the x-axis of the nutrient addition gradient changes as shown in the corrected versions of all figures attached to this corrigendum.
The values of low nutrient addition were not as low as we originally intended. Our conclusions that Typha productivity was remarkably tolerant against low nutrient supply and not only Typha latifolia but also Typha angustifolia could tolerate low nutrient levels, making a long-term unfertilized paludiculture possible, must be rebutted. Low nutrient addition in our experiment, about 50–190 kg N ha−1 a−1 in nutrient addition levels 1–5, was actually in a range in which other studies also report good performance of Typha latifolia. For example, > 100 kg N ha−1 from soil and water, without additional fertilization in a field experiment (Geurts et al. 2020) or 37.5 kg N ha−1 a−1 in an experimental setup (Ren et al. 2019) are mentioned as low N availability at which Typha can still grow productively. The results of our study are now in line with these findings.
Several studies added up to 300 kg N ha−1 a−1 and found an increase in performance of different Typha species (Typha latifolia, Typha domingensis) (Deegan, White, and Ganf 2012; Ren et al. 2019; Svengsouk and Mitsch 2001). Geurts and Fritz (2018) state that young Typha plants profit from N-loads that exceed 250 kg ha−1 a−1. Our results for Typha latifolia which had a maximum total biomass productivity at approx. 380 kg N ha−1 a−1 fit in well with the results of these previous studies. The total biomass productivity optimum of Typha angustifolia was much lower in our study, at an addition of approx. 186 kg N ha−1 a−1. In some studies, Typha plants benefitted from even higher nutrient additions (1330 kg N ha−1 a−1 in Wild et al. 2001, 650 kg N ha−1 a−1 in Jordan, Whigham, and Correll 1990). Compared to these two studies, which also involved Typha angustifolia, the nutrient conditions for optimal productivity were much lower in our study.
The decrease in performance (decrease in biomass and plant size) of the Typha plants at high nutrient additions in our study is no longer surprising, since the nutrient additions were considerably higher than initially planned. The NH3 poisoning, which we already suspected in the original paper at high nutrient addition levels, now seems a very likely explanation for the poor performance of the Typha plants at high nutrient additions.
Thereby, our paper still provides conclusive data. These data fill a research gap, as it reveals optima of the performance of Typha species in a nutrient addition gradient and a water level gradient and now turned out to also explore the upper tolerance limits of Typha to nutrient loads.
We sincerely apologize for this error.
References
| Level | Target amount of N as given in the original paper (incorrect) [kg ha−1 a−1] | Target amount of N (corrected) [kg ha−1 a−1] | Total amount of fertilizer per pot [g a−1] | ||
|---|---|---|---|---|---|
| (NH4)2HPO4 | NH4NO3 | K2CO3 | |||
| 1 | 3.6 | 50.2 | 0.131 | 0.371 | 0.545 |
| 2 | 5.0 | 70.2 | 0.184 | 0.519 | 0.763 |
| 3 | 7.1 | 98.3 | 0.257 | 0.727 | 1.069 |
| 4 | 9.9 | 137.7 | 0.360 | 1.018 | 1.496 |
| 5 | 13.8 | 192.8 | 0.504 | 1.425 | 2.094 |
| 6 | 19.4 | 269.9 | 0.706 | 1.995 | 2.932 |
| 7 | 27.1 | 377.9 | 0.988 | 2.793 | 4.105 |
| 8 | 37.9 | 529.0 | 1.383 | 3.910 | 5.747 |
| 9 | 53.1 | 740.6 | 1.936 | 5.474 | 8.046 |
| 10 | 74.4 | 1036.8 | 2.710 | 7.664 | 11.264 |
| 11 | 104.1 | 1451.5 | 3.795 | 10.729 | 15.770 |
| 12 | 145.8 | 2032.1 | 5.312 | 15.021 | 22.078 |
| 13 | 204.1 | 2844.9 | 7.437 | 21.029 | 30.909 |
| 14 | 285.7 | 3982.9 | 10.412 | 29.441 | 43.273 |
| 15 | 400.0 | 5576.2 | 14.577 | 41.218 | 60.582 |
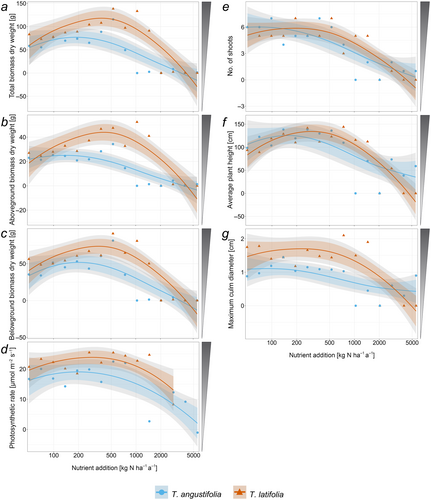
FIGURE 4(corrected): Dry weight [g] of (a) total biomass (span = 1.4), (b) aboveground biomass (span = 1.4), (c) belowground biomass (span = 1.5), (d) photosynthetic rate [μmol m−2 s−1] (span = 2.5), (e) number of shoots (span = 1.4), (f) average shoot height [cm] (span = 1.4), and (g) maximum culm diameter [cm] (span = 2.0) at harvest of Typha angustifolia (blue) and Typha latifolia (red) along the nutrient addition gradient. Dots are original data points, and lines show the smoothed local polynomial regression fitting (loess). 95% Confidence intervals are displayed in gray; 83% confidence intervals are displayed in color. Shaded triangles next to plots indicate preferred (= dark) biomass properties for high-value utilization.
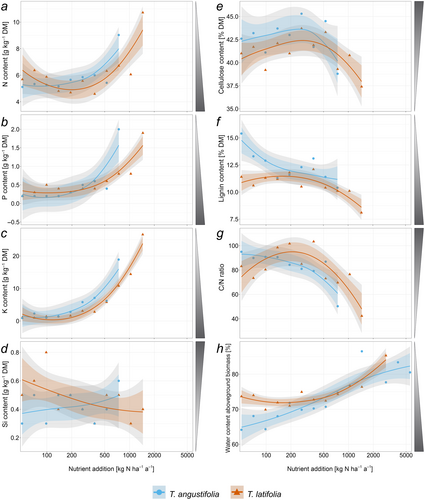
FIGURE 5(corrected): Content [g kg−1 dry matter] of (a) N (span = 1.8), (b) P (span = 1.7), (c) K (span = 1.5), and (d) Si (span = 3.0); content [% dry matter] of (e) cellulose (ADF om—ADL, span = 1.4) and (f) lignin (ADL, span = 2.2), (g) mass-based C/N-ratio (span = 1.8), and (h) water content [%] (span = 1.3) in aboveground biomass of Typha angustifolia (blue) and Typha latifolia (red) along the nutrient addition gradient. Dots are original data points, and lines show the smoothed local polynomial regression fitting (loess). 95% Confidence intervals are displayed in gray; 83% confidence intervals are displayed in color. Shaded triangles next to plots indicate preferred (= dark) biomass properties for high-value utilization. Missing values are due to the fact that sufficient biomass was lacking for the analyses because the plants were growing poorly or had died.
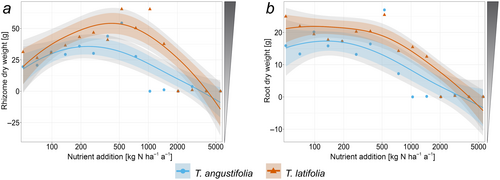
FIGURE A4(corrected): (a) Rhizome (span = 1.4) and (b) root (span = 1.4) dry weight [g] of Typha angustifolia (blue) and Typha latifolia (red) along the nutrient addition gradient. Dots are original data points, and lines show the smoothed local polynomial regression fitting (loess). 95% Confidence intervals are displayed in gray; 83% confidence intervals are displayed in color. Shaded triangles next to plots indicate preferred (= dark) biomass properties for high-value utilization.
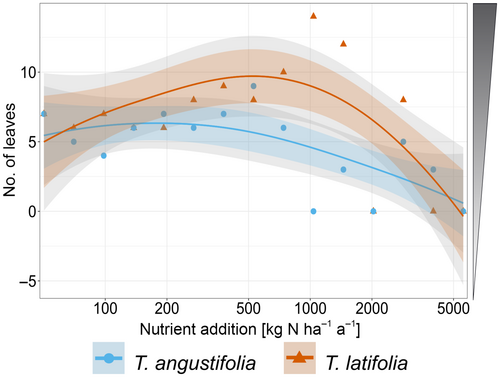
FIGURE A5 (corrected): Number of leaves per shoot (span = 1.5) measured on September 18, 2019, at the end of the growing season, of Typha angustifolia (blue) and Typha latifolia (red) along the nutrient addition gradient. Dots are original data points, and lines show the smoothed local polynomial regression fitting (loess). 95% Confidence intervals are displayed in gray; 83% confidence intervals are displayed in color. The shaded triangle next to the plot indicates preferred (= dark) biomass properties for high-value utilization.
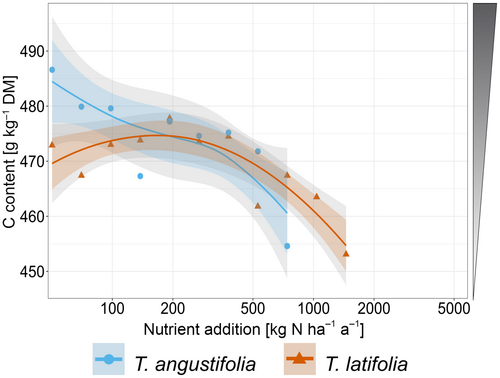
FIGURE A6(corrected): C content [g kg−1 dry matter] (span = 1.7) in aboveground biomass of Typha angustifolia (blue) and Typha latifolia (red) along the nutrient addition gradient. Dots are original data points, and lines show the smoothed local polynomial regression fitting (loess). 95% Confidence intervals are displayed in gray; 83% confidence intervals are displayed in color. The shaded triangle next to the plot indicates preferred (= dark) biomass properties for high-value utilization. Missing values are due to the fact that sufficient biomass was lacking for the analyses because the plants were growing poorly or had died.


