Impact of the 2011 Tohoku Earthquake on the species diversity of rocky intertidal sessile assemblages
Abstract
The impacts of large-scale disturbance events on the species diversity of rocky intertidal sessile assemblages across multiple spatial scales are not well understood. To evaluate the influence of the 2011 Tohoku Earthquake on alpha and beta diversities of rocky intertidal sessile assemblages, we surveyed sessile assemblages in the mid-shore zone from 2011 to 2019 and compared the data with those collected from 2003 to 2010 before the earthquake at the same region. The census was conducted across 22 study plots on five rocky shores along 30 km of the Sanriku Coast of Japan, which is located 150–160 km north–northwest of the earthquake epicenter. Alpha diversity was measured with three Hill numbers (H0, H1, and H2), which represent the number of equally common species that would exist in a community with the same diversity as the sampled community, with higher values of the subscript indicating more weight placed on abundant species. Beta diversity was measured with two metrics (BDtotal at two spatial scales). Values were compared between the post-earthquake period (2011–2019) and the pre-earthquake period (2003–2010). The results show that the Tohoku Earthquake significantly altered the species diversity of intertidal sessile assemblages across multiple spatial scales. All diversity metrics obtained at multiple spatial scales (i.e., alpha diversities: H0, H1, and H2; beta diversities: BDtotal at the shore and regional scales) decreased immediately after the earthquake and then increased in subsequent years. At 2 years after the earthquake, H0 recovered to within the range of pre-earthquake values and H1 and H2 became significantly higher than pre-earthquake values. Most metrics of alpha and beta diversities recovered to pre-earthquake levels after several years, but regional BDtotal remained low for a longer period.
1 INTRODUCTION
Understanding the impacts of natural disturbances on biological communities is a central task of ecologists because disturbance is a major driver of community dynamics and species diversity (Connell, 1978; Huston, 1979; Sousa, 1984) and is particularly important for ecosystem functioning (e.g., Lohbeck et al., 2016; Tilman, 1997). Natural disturbances can affect species diversity in various ways. At the local scale, species diversity decreases immediately after a disturbance and then subsequently increases because disturbance indirectly favors inferior competitors by increasing resource availability through the mortality of dominant species (Fuentes & Brante, 2014; Huston, 1995). Therefore, diversity at the local scale should be highest at intermediate disturbance frequency and intensity due to prevention of competitive exclusion and promotion of spatiotemporal heterogeneity (Connell, 1978; England et al. 2008; Huston, 1979; Menge & Sutherland, 1987; Sousa, 1984; Whitaker et al., 2023). However, the effect of disturbance on species diversity at the regional scale (i.e., at the metacommunity level) is less clear, because disturbances can affect the rates of both species extinction and immigration in a complex way via alterations of resource availability, larvae supply, priority effects of foundation species, and environmental heterogeneity at the landscape level (Chase et al., 2005; Holt et al., 2005; Huston, 1995; Menge, 2000; Rosenzweig, 1995; Underwood, 2000; Weidlich et al., 2021; Whitaker et al., 2023). Furthermore, the effects of disturbances on species diversity vary at both local and regional scales depending on the specific disturbance agents (Huston, 1995; Mackey & Currie, 2001; Sousa, 2001).
Earthquakes and associated tsunamis have severely impacted coastal benthic communities around the world. The uplift induced by earthquake was the main cause of mortality of sessile organisms in rocky intertidal habitats for both Chilean earthquake of 3 March 1985 and Chilean mega-earthquake of 27 February 2010 (Castilla, 1988; Castilla et al., 2010; Castilla & Oliva, 1990; Ortlieb et al., 1996). The abundance and biomass of macrobenthos in a soft-bottom community significantly increased after the 2007 tsunami and earthquake in Paracas Bay, Peru, and they remained higher 4 months later (Lomovasky et al., 2011). Similarly, 3 years after the mega-thrust earthquake in Maule, Chile, in 2010, the density, biomass, and diversity of epibenthic macrofaunal community at different locations were structured differently, with apparent directionality, and there was spatial homogenization of the community (Hernández-Miranda et al., 2014). Another tsunami that hit Tetepare Island in 2010 reduced the cover and diversity of the seagrass community, and recovery to pre-tsunami levels did not occur within the next 8 years (Moseby et al., 2020). The main causes of these tsunami-induced effects are increased sedimentation and uplift or subsidence of the seafloor (Chunga-Llauce & Pacheco, 2021). The speed of recovery from the earthquake may usually be affected by colonization ability of species (Paine & Levin, 1981; Wootton, 1993), larvae supply of the metapopulation (Kinlan & Gaines, 2003), and the indirect influence of the earthquake and associated tsunami via other species.
The influence of earthquakes and subsequent tsunamis on species diversity should be elucidated at multiple spatial scales. The influence of the 2010 Maule mega-thrust earthquake on the species richness and abundance of sandy intertidal communities differed significantly among locations (Sepúlveda & Valdivia, 2016, 2017), suggesting spatial heterogeneity and a local specificity of impacts. This phenomenon might be caused by differences in species characteristics (e.g., high mobility and other species' adaptations) and habitat characteristics (e.g., the dynamic environmental conditions of sandy beaches and hydrological characteristics such as upwelling) (Jaramillo et al., 2003; Loreau et al., 2003; Menge & Menge, 2019; Shanks & Morgan, 2018; Valdivia et al., 2014). However, the effects of earthquakes and tsunamis on species diversity across spatial scales generally remain unknown due to a lack of systematic pre-earthquake baseline datasets (Sepúlveda & Valdivia, 2016; Underwood, 2000). A case study that has a hierarchical spatial structure and experienced a large-scale disturbance with consistent baseline data is the key to understanding the influence of earthquakes and tsunamis on species diversity across spatial scales.
The 2011 Tohoku Earthquake, which had a moment magnitude (Mw) of 9.0, triggered a huge tsunami with run-up heights exceeding 30 m and caused 35–70 cm of subsidence throughout the Pacific coastline of the Tohoku region of northern Japan (Lay & Kanamori, 2011; Shimada, 2016; Tajima et al., 2013). The earthquake heavily altered the distribution and abundance of rocky intertidal sessile organisms (Iwasaki et al., 2016; Iwasaki & Noda, 2018; Kanamori et al., 2020; Noda, Iwasaki, & Fukaya, 2016a, 2016b). However, the impact of mega-earthquakes on the species diversity of intertidal sessile assemblages has not been fully evaluated. The same earthquake significantly decreased the species richness, evenness, and Shannon–Wiener diversity of macrozoobenthic assemblages in Gamo Lagoon, Japan (Kanaya et al., 2015). Although studies have examined the effects of various disturbance agents such as storms, ice scars, severe winters, and earthquakes on the species diversity of intertidal sessile assemblages (Kunze et al., 2021; Sousa, 1984, 2001), these effects have rarely been examined across multiple spatial scales. Thus, to understand how large-scale disturbance events affect the species diversity of intertidal sessile assemblages across spatial scales, a sample with the geographic consistency of the disturbance is a better comparison across multiple spatial scales.
We addressed the following three hypotheses about the course and recovery status of alpha and beta diversities of rocky intertidal sessile assemblages after the 2011 Tohoku Earthquake. First, we hypothesize that alpha diversity would have decreased immediately after the earthquake and then changed to pre-earthquake levels because the tsunami associated with the earthquake caused mortality of dominant species (Iwasaki & Noda, 2018) but would not affect the recovery led by recruitment of larvae and propagules from shoreward transport (Addessi, 1994; Menge & Sutherland, 1987). Second, species dominance (or evenness) would have changed after the earthquake because species responses (resistance to and recovery from the earthquake) vary with species traits (Kanamori et al., 2020). Third, beta diversity would have increased after the earthquake due to an increase in the patchiness of sessile organisms' distributions (Castilla, 1988; Castilla et al., 2010; Castilla & Oliva, 1990; Ortlieb et al., 1996) caused by variations in coastal topography and geology that affected the force of the tsunami impact and susceptibility to wave action (Mori et al., 2011; Wijetunge, 2006).
To test the three hypotheses, we censused sessile assemblages from 2003 to 2019 in the mid-shore zone on five shores along 30 km of the Sanriku Coast. Then, we compared three metrics of alpha diversity (H0, H1, and H2) and two metrics of beta diversity (BDtotal at two spatial scales) for 2011–2019 with corresponding metrics for the pre-earthquake period (2003–2010).
2 MATERIALS AND METHODS
2.1 Census design
Rocky intertidal sessile assemblages were monitored at 22 plots on five rocky shores (Figure 1) located 2.6–7.9 km apart from each other along the Pacific coast of Japan. The study shores are located 150–160 km north–northwest of the epicenter (38°06′12.0″ N, 142°51′36.2″ E) of the 2011 Tohoku Earthquake. The detailed descriptions of the biogeographic features of the same census area were reported by Okuda et al. (2004), Nakaoka et al. (2006), Fukaya et al. (2010), and Ishida et al. (2021).

Within each shore, three to five plots were haphazardly chosen from semi-exposed locations, with distances between neighboring plots ranging from 8 to 209 m (mean ± SD = 59 ± 70 m). Each plot was established on steep rock walls and spanned 50 cm wide by 100 cm in vertical extent, and the mean tidal level corresponded to the vertical mid-point.
The upper margin and lower margin of each plot was extended respectively by 50 cm in July 2011 (Figure 2), because the study area experienced subsidence during the 2011 Tohoku Earthquake; vertical subsidence was 50 cm at four of the five shores (Myojin, Oura, Aragami, and Katagishi) and 60 cm at Akahama (Noda, Iwasaki, & Fukaya, 2016a). Consequently, the vertical observation range was 200 cm after the earthquake at each plot.
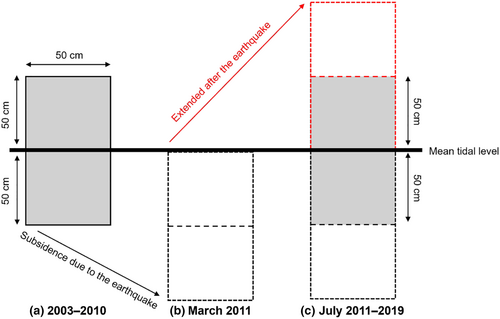
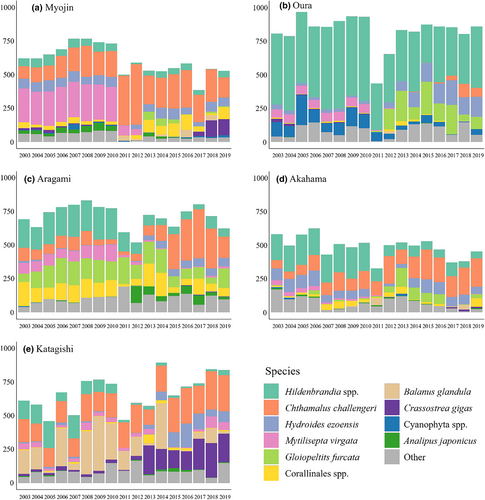
For each plot, the estimates of the coverage of each sessile species were obtained from the same elevational range (1 m) of the plot before and after the earthquake such that the census area corresponded to the mean tidal level ± 50 cm (Figure 2) by using a grid overlain on the plot with 200 observation points inside the plot at evenly spaced intervals (5-cm intervals in both the vertical and the horizontal directions). Each sessile organism occupying a grid point was identified and recorded, and the total number of grid points for each sessile organism was determined in each census (time series relative abundance of dominant species is shown in Figure 3). This census was carried out in July during low tide from 2003 to 2019.
2.2 Data analysis
2.2.1 Diversity estimation
2.3 Statistical analyses
We used Cohen's standardized measure of difference to assess the significance of effect size. An absolute value less than 0.3, around 0.5, and greater than 0.8 is considered to represent small, medium, and large effects, respectively (Cohen et al., 1988). If the 95% CI does not cross the zero line, this indicates that the diversity component for post-earthquake year t was significantly different from that for the pre-earthquake period. Alternatively, if there is no confidence interval for the estimated effect size, an effect size greater than 1.96 in absolute value suggests that the diversity component for post-earthquake year t was significantly different from that for the pre-earthquake period (Borenstein et al., 2021; McLeod et al., 2016). This threshold of 1.96 corresponds to the two-tailed significance level of p < .05 commonly used in hypothesis testing. It is derived from the standard normal distribution and serves as a critical value for determining statistical significance.
3 RESULTS
3.1 Alpha diversity
3.1.1 H 0
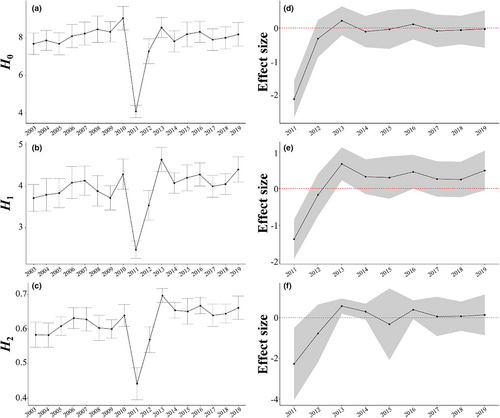
Before the earthquake (2003–2010), the mean value of H0 varied within a small range (from 6 to 8; Figure 4a, Table 1). In 2011, when the earthquake occurred, the 95% CI of its effect size did not cross the zero line and the mean value of H0 decreased to nearly 4 (Figure 4d, Table 1), which was significantly lower than the level before the earthquake. Subsequently, the mean value of H0 increased and recovered to nearly pre-earthquake levels after 2 years (2013; Figure 4a,d).
| Shore scale | Regional scale | ||||||||
|---|---|---|---|---|---|---|---|---|---|
| Year | H 0 | H 1 | H 2 | BD total | BD total | ||||
| Mean | SE | Mean | SE | Mean | SE | Mean | SE | ||
| 2003 | 7.68 | 0.57 | 3.71 | 0.32 | 0.58 | 0.04 | 2921.24 | 853.05 | 3076.93 |
| 2004 | 7.86 | 0.53 | 3.79 | 0.39 | 0.58 | 0.04 | 2506.18 | 651.51 | 2646.06 |
| 2005 | 7.68 | 0.59 | 3.83 | 0.35 | 0.61 | 0.03 | 2550.43 | 653.16 | 2655.03 |
| 2006 | 8.09 | 0.62 | 4.09 | 0.38 | 0.63 | 0.03 | 2462.23 | 574.51 | 2576.59 |
| 2007 | 8.23 | 0.61 | 4.13 | 0.36 | 0.63 | 0.03 | 2032.02 | 855.36 | 2146.58 |
| 2008 | 8.45 | 0.70 | 3.88 | 0.37 | 0.60 | 0.04 | 2632.36 | 952.04 | 2798.05 |
| 2009 | 8.32 | 0.54 | 3.72 | 0.29 | 0.60 | 0.03 | 2667.85 | 870.73 | 2862.54 |
| 2010 | 9.05 | 0.63 | 4.29 | 0.37 | 0.64 | 0.03 | 2222.16 | 676.58 | 2340.24 |
| 2011 | 4.09 | 0.33 | 2.47 | 0.21 | 0.44 | 0.05 | 1844.47 | 1048.00 | 2011.12 |
| 2012 | 7.29 | 0.66 | 3.54 | 0.36 | 0.57 | 0.04 | 2015.31 | 215.20 | 2028.53 |
| 2013 | 8.55 | 0.53 | 4.64 | 0.29 | 0.70 | 0.02 | 1750.72 | 364.79 | 1794.32 |
| 2014 | 7.82 | 0.56 | 4.08 | 0.25 | 0.65 | 0.02 | 2098.69 | 221.64 | 2122.03 |
| 2015 | 8.19 | 0.66 | 4.20 | 0.31 | 0.65 | 0.04 | 1941.73 | 491.99 | 1905.95 |
| 2016 | 8.32 | 0.56 | 4.28 | 0.28 | 0.67 | 0.02 | 1721.96 | 403.02 | 1753.34 |
| 2017 | 7.90 | 0.57 | 4.00 | 0.26 | 0.64 | 0.03 | 1981.77 | 374.04 | 1995.89 |
| 2018 | 8.00 | 0.59 | 4.05 | 0.25 | 0.64 | 0.03 | 2017.16 | 462.23 | 2114.72 |
| 2019 | 8.18 | 0.63 | 4.40 | 0.31 | 0.66 | 0.03 | 2082.75 | 653.34 | 2220.75 |
3.1.2 H 1
Before the earthquake, the mean value of H1 varied within a small range (around 4; Figure 4b, Table 1). In 2011, when the earthquake occurred, the 95% CI of its effect size did not cross the zero line and the mean value of H0 decreased to 2.5 (Figure 4e, Table 1), which was significantly lower than the level before the earthquake. After the earthquake, the value of H1 increased rapidly until 2013 (Figure 4b); the mean value of H1 at 2 years after the earthquake (2013) was significantly higher than the level before the earthquake, and the 95% CI of its effect size did not cross the zero line (the lower bound of 95% CI was 0.226; Figure 4e, Table 1). Subsequently, the mean value of H1 returned to almost the same level as before the earthquake, and its 95% CI crossed the zero line (Figure 4b,e).
3.1.3 H 2
Before the earthquake, the mean value of H2 varied within a small range (around 0.6; Figure 4c, Table 1). In 2011, when the earthquake occurred, it decreased to 0.45, which was significantly lower than the level before the earthquake (Figure 4f, Table 1). After the earthquake, the value of H2 increased rapidly until 2013. The value of H2 at 2 years after the earthquake (2013) was significantly higher than the level before the earthquake (the lower bound of 95% CI was 0.191; Figure 4f). Subsequently, the value returned to almost the same level as before the earthquake, and its 95% CI crossed the zero line (Figure 4c,f).
3.2 Beta diversity
3.2.1 BDtotal at the shore scale
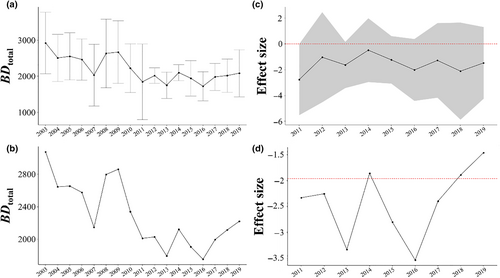
Before the earthquake, the value of BDtotal at the shore scale varied from 2500 to 3800 (Figure 5a, Table 1). In 2011, when the earthquake occurred, BDtotal decreased to 2400, which was significantly lower than the level before the earthquake (Figure 5c, Table 1). After 2012, the value of BDtotal at the shore scale remained relatively low until 2019, but any differences from the pre-earthquake values were not significant (Figure 5a,c).
3.2.2 BDtotal at the regional scale
Before the earthquake, the value of BDtotal at the regional scale varied from 2200 to 3200 (Figure 5b, Table 1). When the earthquake occurred, BDtotal decreased to 2100, which was significantly lower than the value before the earthquake (Figure 5d, Table 1). Subsequently, the value of BDtotal at the regional scale decreased continuously until 2013. Overall, BDtotal at the regional scale was significantly lower for much of the post-earthquake period (2011–2013 and 2015–2017) when compared with the pre-earthquake period (Figure 5b,d).
4 DISCUSSION
The effects of earthquakes and subsequent tsunamis on the species diversity of coastal communities at different spatial scales have remained unclear until now. In this study, we assessed the effects of the 2011 Tohoku Earthquake on the species diversity of the rocky intertidal sessile community at both regional and local scales. Using the data of 22 study plots from 8 years after the earthquake and 8 years before the earthquake, the changes in alpha and beta diversities were estimated. The results show that all three components of alpha diversity (H0, H1, and H2) significantly decreased after the earthquake occurred and returned to almost the same level as before the earthquake by 3 years later. Moreover, the shore-scale beta diversity (BDtotal) in the post-earthquake period was only significantly lower than that for the pre-earthquake period in 2011, whereas the BDtotal at the regional scale was significantly lower than that for the pre-earthquake period from 2011 to 2017, except in 2014.
4.1 Alpha diversity
The alpha diversity results are consistent with our first hypothesis that alpha diversity would decrease immediately after the earthquake and then subsequently recover toward the pre-earthquake level: all metrics of alpha diversity (H0, H1, and H2) declined within the first year after the earthquake, and the values of H1 and H2 subsequently increased rapidly until 2013. The rapid declines of species richness caused by the 2011 Tohoku Earthquake were also reported in a macrozoobenthos community in Gamo Lagoon (Kanaya et al., 2015). Similarly, the earthquakes causing rapid declines in species richness (H0) of rocky intertidal community have also been reported in Kaikōura of November 2016, New Zealand (Schiel et al., 2019). The coseismic subsidence of 50–60 cm throughout the study area (Noda, Iwasaki, & Fukaya, 2016a) is considered a major cause of the decline of alpha diversity just after the earthquake because alpha diversity generally increased with elevation in the mid-intertidal zone during the pre-earthquake period (unpublished data) due to lower predator abundance and moderate desiccation. In addition, physical damage from the force of the tsunami, which caused significant population declines among several sessile organisms, such as mussels (Iwasaki et al., 2016), may also have contributed to the decline of alpha diversity immediately after the earthquake.
From 2011 to 2013, all metrics of alpha diversity increased, and by 2013 H0 had recovered to within the range of values observed before the earthquake, whereas H1 and H2 reached significantly higher values than those observed before the earthquake. This clearly indicates that the relative abundance of common species in 2013 was significantly higher than before the earthquake (Figure 3), supporting our second hypothesis that species dominance (or evenness) would change after the earthquake. This increase in the relative abundance of common species could have been associated with a temporary increase in free space availability caused by coseismic subsidence, because in the mid-intertidal zone in our study area, the proportion of bare space on rock surface generally increased with elevation during the pre-earthquake period (Sakaguchi, 2014). Moreover, a decline in the two competitive dominants, mussels (Mytilisepta virgatus) and the perennial crustose red alga Hildenbrandia spp. (Ishida et al., 2021; Miyamoto & Noda, 2004), during the first 3 years after the earthquake (Kanamori et al., 2020) might have contributed to an increase in the relative abundance of other species in the sessile assemblage in 2013.
4.2 Beta diversity
Based on the previous studies that assessed the impact of mega-earthquakes on rocky intertidal communities on the Chilean coast (Castilla, 1988; Castilla et al., 2010; Castilla & Oliva, 1990; Ortlieb et al., 1996), we hypothesized that the beta diversity of rocky intertidal sessile assemblages on the Sanriku Coast would increase after the 2011 Tohoku Earthquake. Contrary to this prediction, BDtotal tended to decline after the earthquake on both the shore and the regional scales. There are at least three non-exclusive explanations for this result. First, the 2011 Tohoku Earthquake might have reduced, rather than increased, environmental heterogeneity (Castilla, 1988; Castilla et al., 2010; Castilla & Oliva, 1990; Ortlieb et al., 1996), which is a major cause of spatial patchiness in the distribution of rocky intertidal sessile organisms. In fact, landslides and slope failures, which are often associated with huge earthquakes, did not occur around our study plots (Noda et al., 2017). By contrast, the 50–60 cm of coseismic subsidence that did occur throughout the study area would have reduced the spatial heterogeneity of wave exposure by reducing the spatial variability (coefficient of variation) of water depth at the survey plots. Second, the tsunami might have enabled among-shore transport of species that were unable to disperse between shores under normal hydrodynamic conditions before the earthquake. In fact, the tsunami and tsunami debris associated with the 2011 Tohoku Earthquake provided an opportunity for various sessile organisms to colonize areas outside of their original geographical distribution by transporting their propagules (Gewin, 2013). Third, in marine benthic habitats, early successional assemblages tend to be dominated by long-distance dispersers, which show less spatially aggregated distributions (Foggo et al., 2007; Sahara et al., 2015) because their larval dispersal weakens the influence of any spatial heterogeneities in the adult distribution on the juvenile distribution pattern (Reed et al., 2000; Uriz et al., 1998). In fact, barnacles, such as Chthamalus challengeri and Semibalanus cariosus, whose abundance increased dramatically immediately after the earthquake (Kanamori et al., 2020; Noda, Iwasaki, & Fukaya, 2016b; Noda, Sakaguchi, et al., 2016), are capable of long-distance dispersal over several kilometers as planktonic larvae and are fast growing (Kinlan & Gaines, 2003). Of the above three explanations for the decline of BDtotal after the earthquake, the last two could also explain why regional BDtotal remained low after the earthquake for a long period even after the quick recovery of BDtotal at the shore scale.
Marine heatwaves (MHWs), which have become more frequent in recent years (Hobday et al., 2018; Oliver et al., 2018), often affect community dynamics of marine organisms (Ishida et al., 2023; Mieszkowska et al., 2021; Suryan et al., 2021; Weitzman et al., 2021; Ziegler et al., 2023). Indeed, it has been reported that the MHWs that occurred in Pacific coast of eastern Hokkaido from 2010 to 2016 (Miyama et al., 2021) affected the species composition and abundance of sessile organisms in rocky intertidal communities (Ishida et al., 2023). It is suspected that the decline in BDtotal values observed in 2009 to 2010 confirmed in this study may be related to the occurrence of MHW. Therefore, we additionally estimated the effect of MHWs on BDtotal by comparing the difference between BDtotal value in years with and without MHWs. First, we investigated the occurrence of MHWs around Sanriku coast during the study period. The results showed that category I (moderate) MHWs (Hobday et al., 2016, 2018) occurred twice each in 2005 and 2007, and no MHW occurred in the period after the 2009 survey and before the 2010 survey (Tables S1 and S2). Furthermore, MHW occurred annually from 2011 to 2019, with a category II (strong) MHW (Hobday et al., 2016, 2018) in 2012 and category I (moderate) MHW in other years (Table S1). Second, we statistically estimated the effect of MHW on BDtotal. Before the 2011 Tohoku earthquake, because only the MHW that occurred in 2007 is included in the census data and the MHW in 2005 came after the census, we used ANOVA to compare the difference between BDtotal in 2006 and in other years before the 2011, the difference between BDtotal in 2007 and in other years before the 2011, and the difference between BDtotal in 2006 and BDtotal in 2007. The results showed that there was no significant difference in any of the above comparisons (Table S3). Third, we recalculated the effect size of BDtotal with the baseline that excluded the data of 2006 and 2007. This recalculation did not change our results, indicating that the MHW years should be included in the baseline data for the pre-earthquake years (Figure S1 in Data S1). Therefore, based on the above results, we think that the MHWs around Sanriku coast are weak and have no significant effect on BDtotal.
4.3 Ecological consequences of changes in species diversity
Although alpha and beta diversities at the shore-scale returned to pre-earthquake levels after experiencing rapid declines in 2011, the changes in species diversity and subsequent changes in community structure had several ecological consequences. First, the relative abundance of dominant species decreased after the disturbance (Figure 3), which could provide niche opportunities for invasion of rare species (Shea & Chesson, 2002). Second, the order of opportunistic species invasion may determine the process of succession, because priority effects of foundation species may alter the colonization, growth, or reproduction of other species that arrive later (Weidlich et al., 2021). Consequently, although the indices of species diversity returned to the pre-earthquake level, the species composition and community structure changed obviously compared with that before the earthquake (Figure 3). Finally, drastic changes in relative abundance caused by external factors (i.e., disturbance) may also alter the direction and strength of species interactions, which may cause the changes in species distribution range. This is because the upper limits of rocky intertidal sessile species are determined by environmental stress and the lower limits by species interactions (Connell, 1961; Scrosati et al., 2011; Valdivia et al., 2011).
5 CONCLUSION
Despite the large amount of research conducted on the marine community ecology of rocky intertidal assemblages in recent decades (Hadiyanto et al., 2024; Ishida et al., 2021; Menge et al., 2022; Morgan, 2011; Scrosati et al., 2022), the effects of large-scale disturbance events on the species diversity of this assemblage across multiple spatial scales remain poorly understood. The present study shows that the disturbance across spatial scales indeed altered the species diversity of intertidal sessile assemblages at multiple spatial scales. In the region 150–160 km north-northwest of the epicenter of the 2011 Tohoku Earthquake, all of the diversity metrics (i.e., alpha diversities: H0, H1, and H2; beta diversities: BDtotal at the shore and regional scales) examined from five shores located 2.6–7.9 km apart from each other immediately decreased after the earthquake and then increased in subsequent years. At 2 years after the earthquake (2013), H0 recovered to within the range of values observed before the earthquake, while H1 and H2 reached significantly higher values than those observed before the earthquake, indicating that species evenness became significantly lower than pre-earthquake levels. At several years after the earthquake, although most metrics of alpha and beta diversities recovered toward pre-earthquake levels, regional BDtotal remained low for a prolonged period. The effects of disturbances at both local and regional scales on species diversity are likely to vary among disturbance agents (Huston, 1995; Mackey & Currie, 2001; Sousa, 2001). Although rocky intertidal habitats are vulnerable to various large-scale disturbance agents, such as storms, ice scars, severe winters, and earthquakes (Kunze et al., 2021; Sousa, 1984, 2001), their consequences for metacommunity diversity remain poorly understood. Because the present study only revealed the long-term pattern of changes in species diversity after the earthquake and associated tsunami, further research that elucidates the ecological consequences of changes in species diversity caused by large-scale disasters and their mechanisms of recovery is eagerly awaited by ecologists and conservation biologists.
AUTHOR CONTRIBUTIONS
Yuan Yao: Conceptualization (equal); data curation (equal); formal analysis (lead); investigation (equal); visualization (lead); writing – original draft (equal). Jingru You: Conceptualization (equal); data curation (equal); investigation (equal); writing – original draft (supporting). Ken Ishida: Data curation (equal); investigation (equal); writing – review and editing (equal). Takashi Noda: Conceptualization (equal); data curation (equal); funding acquisition (lead); investigation (equal); supervision (lead); writing – review and editing (lead).
ACKNOWLEDGMENTS
We appreciate many researchers and students who helped with data collection in the field. We are grateful to the staff of the International Coastal Research Center of the Atmosphere and Ocean Research Institute, University of Tokyo, for their maintenance of the field and laboratory facilities used in this research. This study was made possible by the generous support and encouragement of local fishermen and fisherman's cooperative associations in Iwate Prefecture. This research was funded by grants-in-aid from the Japan Society for the Promotion of Science to T.N. (nos. 15K07208, 18H02503, and 23H02546).
CONFLICT OF INTEREST STATEMENT
The authors declare no conflict of interest. The funders had no role in the design of the study; in the collection, analyses, or interpretation of data; in the writing of the manuscript; or in the decision to publish the results.
Open Research
DATA AVAILABILITY STATEMENT
The data supporting the findings of this study are available in the Dryad Digital Repository, and can be accessed at https://doi.org/10.5061/dryad.vmcvdnd1r.


