The first complete mitochondrial genome of the Mariana Trench Freyastera benthophila (Asteroidea: Brisingida: Brisingidae) allows insights into the deep-sea adaptive evolution of Brisingida
Funding information
This study was supported by The National Key R & D Program of China (2017YFC0306600), Strategic Priority Research Program of the Chinese Academy of Sciences (CAS) (XDB06010104), National Natural Science Foundation of China (41576127), Knowledge Innovation Program of CAS (SIDSSE–201401), Hundred Talents Program of CAS (SIDSSE–BR–201401), and Major scientific and technological projects of Hainan Province (ZDKJ2016009).
Abstract
Starfish (phylum Echinodermata) are ecologically important and diverse members of marine ecosystems in all of the world's oceans, from the shallow water to the hadal zone. The deep sea is recognized as an extremely harsh environment on earth. In this study, we present the mitochondrial genome sequence of Mariana Trench starfish Freyastera benthophila, and this study is the first to explore in detail the mitochondrial genome of a deep-sea member of the order Brisingida. Similar to other starfish, it contained 13 protein-coding genes, two ribosomal RNA genes, and 22 transfer RNA genes (duplication of two tRNAs: trnL and trnS). Twenty-two of these genes are encoded on the positive strand, while the other 15 are encoded on the negative strand. The gene arrangement was identical to those of sequenced starfish. Phylogenetic analysis showed the deep-sea Brisingida as a sister taxon to the traditional members of the Asteriidae. Positive selection analysis indicated that five residues (8 N and 16 I in atp8, 47 D and 196 V in nad2, 599 N in nad5) were positively selected sites with high posterior probabilities. Compared these features with shallow sea starfish, we predict that variation specifically in atp8, nad2, and nad5 may play an important role in F. benthophila's adaptation to deep-sea environment.
1 INTRODUCTION
The class Asteroidea (sea stars and starfish) is one of the most familiar and diverse groups of the phylum Echinodermata with a long paleontological history, including nearly 1,800 species grouped into 35 families (Clark & Downey, 1992; Matsubara, Komatsu, & Wada, 2004). They are present in all of the world's oceans and occur from intertidal to abyssal, and they are most diverse in the Indo-Pacific and tropical Atlantic regions (Mah & Blake, 2012). To date, the phylogenetic relationships of these starfish have not yet been fully resolved (Knott & Wray, 2000).
Because of its maternal inheritance, and low frequency of gene recombination, mitochondrial genes (e.g., COI) are widely used for phylogenetic analysis (Boore, 1999). Compared to one gene, complete mitogenomes include more genetic information and usually could obtain more accurate phylogenetic relationship and therefore have become more popular in recent years (Fan, Hu, Wen, & Zhang, 2011; Shen, Ma, Ren, & Zhao, 2009; Shen et al., 2017). Up to now, the complete mitochondrial genomes have been reported in many marine organisms, such as sea cucumber (Fan et al., 2011; Perseke et al., 2010; Scouras, Beckenbach, Arndt, & Smith, 2004; Sun, Qi, & Kong, 2010), sea urchin (Cantatore, Roberti, Rainaldi, Gadaleta, & Saccone, 1989; De Giorgi, Martiradonna, Lanave, & Saccone, 1996; Qureshi & Jacobs, 1993), brittle star (Perseke et al., 2008, 2010; Scouras et al., 2004; Smith, Arndt, Gorski, & Fajber, 1993), sea lily (Perseke et al., 2008; Scouras & Smith, 2006), shellfish (Plazzi, Ribani, & Passamonti, 2013; Ren, Liu, Jiang, Guo, & Liu, 2010), and crab (Liu & Cui, 2010; Yang & Yang, 2008).
Animal mitogenome is typically always circular molecule, except for some classes of cnidarians (Bridge, Cunningham, Schierwater, Desalle, & Buss, 1992). It contains 37 genes in general: 13 protein-coding genes (PCGs) (cytochrome c oxidase subunits I–III [cox1-cox3], NADH dehydrogenase subunits 1–6 and 4L [nad1-6, nad4L], ATP synthase subunits 6 and 8 [atp6, atp8], apocytochrome b [cob]), two ribosomal RNAs (12S and 16S), and 22 transfer RNAs (tRNAs). All 13 protein-coding genes play key roles in oxygen usage and energy metabolism (Boore, 1999; Xu et al., 2007). Because variation in mitochondrial protein-coding genes that involved in oxidative phosphorylation can directly influence metabolic performance, an increasing number of researches related to adaptive evolution of these genes have been reported (Maliarchuk, 2011; Xu et al., 2007; Yu, Wang, Ting, & Zhang, 2011; Zhou, Shen, Irwin, Shen, & Zhang, 2014). Despite strong functional constraints, mitochondrial DNA may be subject to positive directional selection in response to pressures from extreme harsh environment (Tomasco & Lessa, 2011). Indeed, mtDNA analyses have demonstrated the existence of adaptive evolution in the ATP synthase genes of the sea anemones, alvinocaridid shrimp, and galliform birds (Sun, Hui, Wang, & Sha, 2018; Zhang, Zhang, Wang, Zhang, & Lin, 2017; Zhou et al., 2014); the NADH dehydrogenase genes of sea anemones, alvinocaridid shrimp, Tibetan horses, and Chinese snub-nosed monkeys (Sun et al., 2018; Xu et al., 2007; Yu et al., 2011; Zhang et al., 2017); the cytochrome b gene of cetaceans and alpacas (da Fonseca, Johnson, O'Brien, Ramos, & Antunes, 2008); and the cytochrome c oxidase genes of Tibetan antelope and anthropoids (Adkins & Honeycutt, 1994; Luo et al., 2008).
Here, we report the complete mitogenome of the starfish Freyastera benthophila, which collected from Mariana Trench at 5,463 m depth. Freyastera benthophila exist in abyssal and is mainly distributed in the southern Pacific, eastern Pacific off California, mid-Atlantic (between Azores and Spain), the Bay of Bengal, and Biscay, ranging from 4,250 to 5,000 m depth (Downey, 1986). The mitogenome features, organization, codon usage, and gene arrangement information were presented. The phylogenetic relationships between F. benthophila and 19 other species from Echinodermata were analyzed. To infer the deep-sea adaptive evolution, positive selection analysis of mitochondrial genes was also performed.
2 MATERIALS AND METHODS
2.1 Sample collection and DNA extraction
The specimen was collected at Mariana Trench, in June 2016 (10°51.0971′N, 141°57.2705′E, at 5,463 m depth). The collection was accomplished by deep-sea human occupied vehicle (HOV) “Jiao Long” during an expedition. The specimen was preserved in 95% ethanol. Total genomic DNA was extracted from ethanol-fixed tissue with tissue DNA kit (Omega Bio-Tek) and stored at −20°C.
2.2 PCR amplification and DNA sequencing
The universal metazoan primers for mtDNA were used in PCR. Three fragments cox3, cob, and 16S were successfully amplified with the primers cox3F + cox3R (Boore, Macey, & Medina, 2005), cobF424 + cobR876 (Boore & Brown, 2000), and 16SarL + 16SbrH (Boore et al., 2005). In addition, partial sequences of cox1, cox2, nad4L, atp6, nad4, and nad5 were amplified with the degenerate primers from conserved regions of other starfish in GenBank. The remaining gaps were amplified with the species-specific primers designed according to the obtained sequences. Finally, the whole mitogenome was amplified based on eight pairs of primers (Table 1).
| Name | Sequence (5′–3′) | Region | Location |
|---|---|---|---|
| W1-F | CCGCAAGAGTCGAAAGAG | cox1 | 3473–3490 |
| W1-R | TCAAGGAGTCGTGGCATT | cox2 | 5448–5465 |
| W2-F | TAGCTCTTTCCCGAACAC | nad4L | 4993–5010 |
| W2-R | GAACCGTAAACACTATCTGCT | cox3 | 7233–7253 |
| W3-F | GACTCGCAGCTAATCTTACA | atp6 | 6466–6485 |
| W3-R | CAAGACCGTATCCACCTAAC | nad4 | 8630–8649 |
| W4-F | CCCTCCTTCCAACCCTCATC | nad4 | 8287–8306 |
| W4-R | CACCCATCTTTCGTAGGTCTTGT | nad5 | 10735–10757 |
| W5-F | CCACCGCTACTTCTCAACAT | nad5 | 10545–10564 |
| W5-R | TAGAGCGAAGGATTGCATAG | cob | 12860–12879 |
| W6-F | CCACCTATTCTTCCTTCACC | cob | 12614–12633 |
| W6-R | GCATAATCATTTGCCTCTTA | 16S | 15183–15202 |
| W7-F | AGCTCGATAGGGTCTTCTCGTC | 16S | 15063–15084 |
| W7-R | GCAGTGGCATTGTTGACTTTGA | nad1 | 2040–2061 |
| W8-F | AGCTAACGGCTGAAACAATC | nad1 | 1957–1976 |
| W8-R | TTCCTGCGTAATGGGCTA | cox1 | 3902–3919 |
PCRs were performed with a gradient machine (Applied Biosystems Inc.). The cycling was set up with an initial denature step at 94°C for 5 min, followed by 35 cycles (94°C for 30 s, 45–55°C for 1 min, 72°C 1–3 min), and a final extension was executed at 72°C for 10 min. LA-PCR was carried out in a 20 μl reaction volume containing 12.6 μl ddH2O, 2 μl 10 × LA-PCR buffer (Mg2+ plus, Takara), 3.2 μl dNTP mix (2.5 mM each), 0.5 μl each primer (10 μM), 0.2 μl LA Taq DNA polymerase (5 U/μl, Takara), and 1 μl DNA template (50 ng/μl). PCR products were electrophoresed on a 1.0% agarose gel and purified with gel extraction kit (Omega Bio-Tek) and sequenced with ABI 3730x1 DNA analyzer (Applied Biosystems Inc.).
2.3 Gene annotation and Sequence analysis
Raw sequencing reads were first processed using Phred with the quality score 20 and assembled in Phrap with default parameters (Ewing & Green, 1998; Ewing, Hillier, Wendl, & Green, 1998). Then, all assemblies and sequence quality were verified manually in Consed (Gordon, Abajian, & Green, 1998). DOGMA (Wyman, Jansen, & Boore, 2004), ORFfinder (http://www.ncbi.nlm.nih.gov/projects/gorf/orfig.cgi), and BLAST (http://blast.ncbi.nlm.nih.gov/Blast.cgi) were used to identify protein-encoding genes and rRNA genes. The tRNA genes were identified by tRNAscan-SE 1.21 (Lowe & Eddy, 1997) and ARWEN 1.2.3.c (Laslett & Canbäck, 2008). Secondary structures for tRNAs were drawn using MITOS Web server (Bernt et al., 2013). Codon usage analysis was estimated with CodonW 1.4.4 (Peden, 1999). The mitochondrial gene map was drawn with GenomeVx (Conant & Wolfe, 2008).
2.4 Phylogenetic analysis
Twenty echinoderm mt genomes including the one obtained in this study were used for phylogenetic analysis. All complete mtDNA sequences vailable in GenBank are listed in Table 2. Crinoidea is generally considered as the earliest diverged group of echinoderms (Scouras & Smith, 2006). In this study, Antedon mediterranea (Crinoidea) was rooted as the out-group. The amino acid sequence from each of 13 protein-coding genes was aligned separately using Clustal ×2.0 (Larkin et al., 2007), and then, the relatively poor homologous sequence was eliminated. The aligned amino acid sequences were concatenated into a single dataset. The phylogenetic reconstruction approach was performed using neighbor joining (NJ) and maximum likelihood (ML) with MEGA 5.0 (Tamura et al., 2011). The assessment of node reliability was performed using 1,000 bootstrap replicates.
| Taxon | Classification | Accession number | References |
|---|---|---|---|
| Crinoidea | |||
| Antedom mediterranea | Crinoidea; Articulata; Comatulida; Antedonidae | NC_010692 | Perseke et al. (2008) |
| Ophiuroidea | |||
| Ophiocomina nigra | Ophiuroidea; Ophiuridea; Ophiurida; Ophiurina; Gnathophiurina; Ophiocomidae | NC_013874 | Perseke et al. (2010) |
| Astrospartus mediterraneus | Ophiuroidea; Ophiuridea; Euryalida; Gorgonocephalidae | NC_013878 | Perseke et al. (2010) |
| Echinoidea | |||
| Strongylocentrotus purpuratus | Echinoidea; Euechinoidea; Echinacea; Echinoida; Strongylocentrotidae | NC_001453 | Qureshi and Jacobs (1993) |
| Echinocardium cordatum | Echinoidea; Euechinoidea; Atelostomata; Spatangoida; Loveniidae | NC_013881 | Perseke et al. (Unpublished) |
| Paracentrotus lividus | Echinoidea; Euechinoidea; Echinacea; Echinoida; Echinidae | NC_001572 | Cantatore et al. (1989) |
| Holothuroidea | |||
| Cucumaria miniata | Holothuroidea; Dendrochirotacea; Dendrochirotida; Cucumariidae | NC_005929 | Scouras et al. (2004) |
| Apostichopus japonicus | Holothuroidea; Aspidochirotacea; Aspidochirotida; Stichopodidae | NC_012616 | Sun et al. (2010) |
| Holothuria forskali | Holothuroidea; Aspidochirotacea; Aspidochirotida; Holothuriidae | NC_013884 | Perseke et al. (2010) |
| Parastichopus nigripunctatus | Holothuroidea; Aspidochirotacea; Aspidochirotida; Stichopodidae | NC_013432 | Sasaki and Hamaguchi (Unpublished) |
| Stichopus horrens | Holothuroidea; Aspidochirotacea; Aspidochirotida; Stichopodidae | NC_014454 | Fan et al. (2011) |
| Asteroidea | |||
| Freyastera benthophila | Asteroidea; Forcipulatacea; Brisingida; Brisingidae | MG563681 | This study |
| Aphelasterias japonica | Asteroidea; Forcipulatacea; Forcipulatida; Asteriidae | NC_025766 | Tang et al. (2014) |
| Pisaster ochraceus | Asteroidea; Forcipulatacea; Forcipulatida; Asteriidae | X55514 | Smith, Banfield, Doteval, Gorski, and Kowbel (1990) |
| Asterias amurensis | Asteroidea; Forcipulatacea; Forcipulatida; Asteriidae | NC_006665 | Matsubara et al. (2005) |
| Astropecten polyacanthus | Asteroidea; Valvatacea; Paxillosida; Astropectinidae | NC_006666 | Matsubara et al. (2005) |
| Luidia quinaria | Asteroidea; Valvatacea; Paxillosida; Luidiidae | NC_006664 | Matsubara et al. (2005) |
| Acanthaster brevispinus | Asteroidea; Valvatacea; Valvatida; Acanthasteridae | NC_007789 | Yasuda et al. (2006) |
| Acanthaster planci | Asteroidea; Valvatacea; Valvatida; Acanthasteridae | NC_007788 | Yasuda et al. (2006) |
| Patiria pectinifera | Asteroidea; Valvatacea; Valvatida; Asterinidae | NC_001627 | Asakawa et al. (1995) |
2.5 Positive selection analysis
To evaluate the variation in selective pressure between deep-sea F. benthophila and other eight shallow sea starfish, we used a codon-based likelihood approach implemented in the CODEML program of the pamlX package (Xu & Yang, 2013; Yang, 2007). All models correct the transition/transversion rate and codon usage biases (F3 × 4). The branch model tests were used to analyze the difference of selective pressure between the deep-sea and shallow sea starfish. The “one-ratio” model (model 0), “free-ratio” model (model 1), and “two-ratio” model were used in the combined dataset of 13 protein-coding genes. Considering that positive selection may occur in some amino acids during the evolution of a protein, we used two branch site models (A and A null). Bayes empirical Bayes (Yang, Wong, & Nielsen, 2005) analysis was used to calculate the posterior probabilities of a specific codon site.
3 RESULTS AND DISCUSSION
3.1 General features
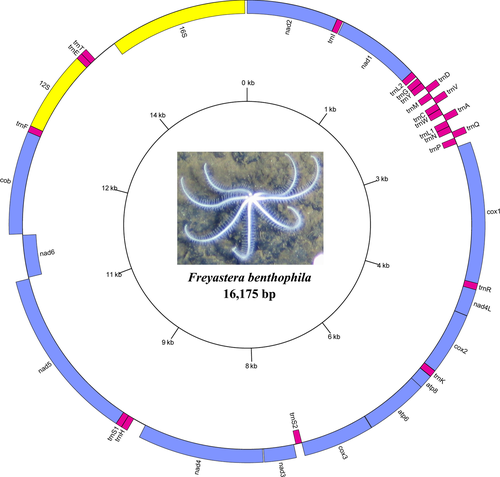
The mitogenome of the F. benthophila is a 16,175-bp circular molecule (Figure 1) with a nucleotide composition of 34.70% A, 21.13% C, 10.65% G, and 33.53% T bases. The genome has an overall A + T content of 68.23%, which appears to be high for Asteroidea. Among the eight species in Asteroidea, the lowest A + T content is 56.34% in Acanthaster planci (Table 3). Freyastera benthophila has the smallest complete mitogenome found in Asteroidea thus far. The size of Asteroidea mitogenomes ranged from 16,524 bp in Luidia quinaria to 16,175 bp in F. benthophila (Table 3). The synteny and identity level between F. benthophila and each of the other seven starfish mitogenomes is shown in Figure 2. The lack of similarity between F. benthophila and L. quinaria is the most obvious feature in the plot.
| Freyastera benthophila | Asterias amurensis | Astropecten polyacanthus | Luidia quinaria | Aphelasterias japonica | Acanthaster brevispinus | Acanthaster planci | Patiria pectinifera | |
|---|---|---|---|---|---|---|---|---|
| Entire genome length (bp) | 16,175 | 16,427 | 16,304 | 16,524 | 16,215 | 16,254 | 16,234 | 16,260 |
| Entire genome A + T% | 68.23 | 65.45 | 64.00 | 62.98 | 64.32 | 56.37 | 56.34 | 61.27 |
| Protein-coding gene length (bp) | 11,506 | 11,488 | 11,539 | 11,506 | 11,504 | 11,488 | 11,491 | 11,501 |
| Protein-coding gene A + T% | 67.15 | 64.45 | 62.48 | 61.02 | 62.95 | 55.95 | 55.64 | 60.12 |
| 12S gene length (bp) | 891 | 893 | 901 | 884 | 900 | 928 | 929 | 897 |
| 12S gene A + T% | 65.66 | 61.70 | 62.04 | 59.16 | 62.22 | 53.45 | 54.04 | 58.86 |
| 16S gene length (bp) | 1,602 | 1,620 | 1,629 | 1,751 | 1,602 | 1,545 | 1,549 | 1,531 |
| 16S gene A + T% | 72.28 | 70.19 | 69.12 | 69.67 | 69.66 | 55.34 | 56.04 | 66.49 |
| tRNA length (bp) | 1,557 | 1,580 | 1,561 | 1,563 | 1,566 | 1,546 | 1,550 | 1,585 |
| tRNA A + T% | 60.65 | 67.22 | 67.01 | 66.54 | 66.99 | 61.45 | 61.35 | 64.35 |
| Largest NCR length (bp) | 284 | 483 | 395 | 402 | 281 | 551 | 531 | 445 |
| Largest NCR A + T% | 67.25 | 63.98 | 64.56 | 70.15 | 62.63 | 53.90 | 54.99 | 59.78 |
| nad2 | 1062 (ATG/TAG) | 1062 (GTG/TAA) | 1068 (GTG/TAA) | 1068 (GTG/TAA) | 1062 (ATG/TAG) | 1065 (ATG/TAG) | 1065 (ATG/TAG) | 1065 (ATG/TAA) |
| nad1 | 972 (ATG/TAG) | 978 (GTG/TAA) | 976 (ATG/T-) | 978 (GTG/TAG) | 978 (GTG/TAA) | 981 (GTG/TAG) | 981 (GTG/TAG) | 981 (GTG/TAG) |
| cox1 | 1557 (ATG/TAA) | 1551 (ATG/TAA) | 1554 (ATG/TAA) | 1554 (ATG/TAA) | 1552 (ATG/T-) | 1553 (ATG/TA-) | 1553 (ATG/TA-) | 1554 (ATG/TAA) |
| nad4L | 297 (ATG/TAA) | 288 (ATG/TAA) | 297 (ATT/TAA) | 297 (ATT/TAA) | 297 (ATC/TAA) | 297 (ATT/TAA) | 297 (ATT/TAA) | 297 (ATT/TAA) |
| cox2 | 690 (ATG/TAA) | 690 (ATG/TAA) | 688 (ATG/T-) | 693 (ATG/TAG) | 690 (ATG/TAA) | 688 (ATG/T-) | 688 (ATG/T-) | 688 (ATG/T-) |
| atp8 | 168 (ATG/TAA) | 168 (ATG/TAA) | 168 (ATG/TAA) | 168 (ATG/TAA) | 168 (ATG/TAA) | 165 (ATG/TAA) | 165 (ATG/TAA) | 165 (ATG/TAA) |
| atp6 | 693 (ATG/TAA) | 693 (ATG/TAA) | 693 (ATG/TAA) | 693 (ATG/TAA) | 693 (ATG/TAA) | 693 (ATG/TAA) | 693 (ATG/TAA) | 693 (ATG/TAA) |
| cox3 | 783 (TAG/TAA) | 780 (ATG/TAA) | 783 (ATG/TAA) | 783 (ATG/TAA) | 783 (ATG/TAA) | 783 (ATG/TAA) | 783 (ATG/TAA) | 783 (ATG/TAA) |
| nad3 | 351 (ATG/TAA) | 351 (ATG/TAA) | 351 (ATT/TAA) | 351 (ATT/TAG) | 351 (ATG/TAA) | 351 (ATT/TAA) | 351 (ATT/TAA) | 333 (ATT/TAG) |
| nad4 | 1386 (ATG/TAA) | 1383 (ATG/TAA) | 1380 (ATG/TAA) | 1380 (ATG/TAA) | 1383 (ATG/TAA) | 1383 (ATG/TAG) | 1383 (ATG/TAA) | 1383 (ATG/TAA) |
| nad5 | 1920 (ATG/TAA) | 1917 (ATG/TAA) | 1905 (ATG/TAA) | 1911 (ATG/TAA) | 1920 (ATG/TAA) | 1902 (ATG/TAA) | 1902 (ATG/TAA) | 1932 (GTG/TAA) |
| nad6 | 489 (ATG/TAG) | 489 (ATG/TAG) | 492 (ATG/TAA) | 492 (ATG/TAA) | 489 (ATG/TAG) | 489 (ATG/TAG) | 489 (ATG/TAG) | 489 (ATG/TAA) |
| cob | 1138 (ATG/T-) | 1138 (ATG/T-) | 1138 (ATG/T-) | 1138 (ATG/T-) | 1138 (ATG/T-) | 1138 (ATG/T-) | 1138 (ATG/T-) | 1138 (ATG/T-) |
| Reference | This study | Matsubara et al. (2005) | Matsubara et al. (2005) | Matsubara et al. (2005) | Tang et al. (2014) | Yasuda et al. (2006) | Yasuda et al. (2006) | Asakawa et al. (1995) |
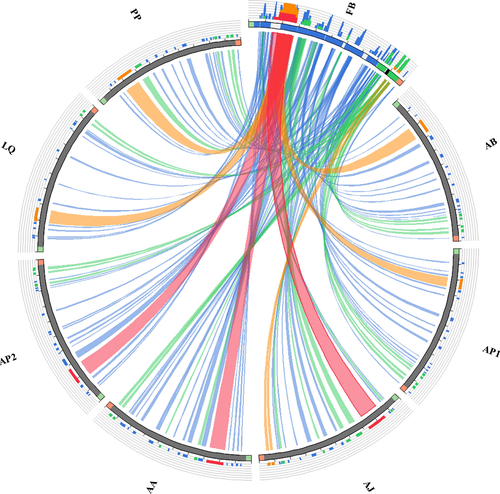
The genome encodes 37 genes including 13 protein-coding genes (PCGs), two rRNA genes, and 22 tRNA genes (duplication of two tRNAs: trnL and trnS) on both strands. Fifteen of the genes are encoded on the negative strand, while the other 22 are encoded on the positive strand. A total of 22 noncoding regions were found, with the largest continuous region (284 bp, A + T = 67.25%) located between trnT and 16S. Due to its AT richness, we predict that this part is mitochondrial control region. Furthermore, we found four overlaps: trnC/trnV, trnA/trnL1, atp8/atp6, and cox3/trnS2. Table 4 presents a summary of the organization of F. benthophila mitogenome. The complete mitochondrial DNA sequence has been deposited in GenBank (Accession Number: MG563681).
| Gene | Location | Size | Codon | Intergenic nucleotide (bp) | Strand | |||
|---|---|---|---|---|---|---|---|---|
| Start | End | Nucleotide (bp) | Amino acid | Start | Stop | |||
| nad2 | 1 | 1062 | 1,062 | 353 | ATG | TAG | 0 | L |
| trnI | 1064 | 1132 | 69 | 1 | L | |||
| nad1 | 1147 | 2118 | 972 | 323 | ATG | TAG | 14 | L |
| trnL 2 | 2119 | 2191 | 73 | 0 | L | |||
| trnG | 2216 | 2284 | 69 | 24 | L | |||
| trnY | 2286 | 2356 | 71 | 1 | L | |||
| trnD | 2357 | 2426 | 70 | 0 | H | |||
| trnM | 2428 | 2500 | 73 | 1 | L | |||
| trnV | 2509 | 2579 | 71 | 8 | H | |||
| trnC | 2578 | 2648 | 71 | −2 | L | |||
| trnW | 2651 | 2721 | 71 | 2 | L | |||
| trnA | 2735 | 2804 | 70 | 13 | H | |||
| trnL 1 | 2804 | 2875 | 72 | −1 | L | |||
| trnN | 2876 | 2947 | 72 | 0 | L | |||
| trnQ | 2951 | 3022 | 72 | 3 | H | |||
| trnP | 3023 | 3093 | 71 | 0 | L | |||
| cox1 | 3130 | 4686 | 1,557 | 518 | ATG | TAA | 36 | H |
| trnR | 4687 | 4757 | 71 | 0 | H | |||
| nad4L | 4758 | 5054 | 297 | 98 | ATG | TAA | 0 | H |
| cox2 | 5056 | 5745 | 690 | 229 | ATG | TAA | 1 | H |
| trnK | 5747 | 5821 | 75 | 1 | H | |||
| atp8 | 5824 | 5991 | 168 | 55 | ATG | TAA | 2 | H |
| atp6 | 5976 | 6668 | 693 | 230 | ATG | TAA | −16 | H |
| cox3 | 6673 | 7455 | 783 | 260 | ATG | TAA | 4 | H |
| trnS 2 | 7454 | 7524 | 71 | −2 | L | |||
| nad3 | 7549 | 7899 | 351 | 116 | ATG | TAA | 24 | H |
| nad4 | 7911 | 9296 | 1,386 | 461 | ATG | TAA | 11 | H |
| trnH | 9448 | 9517 | 70 | 151 | H | |||
| trnS 1 | 9519 | 9586 | 68 | 1 | H | |||
| nad5 | 9587 | 11506 | 1,920 | 639 | ATG | TAA | 0 | H |
| nad6 | 11524 | 12012 | 489 | 162 | ATG | TAG | 17 | L |
| cob | 12027 | 13164 | 1,138 | 379 | ATG | T- | 14 | H |
| trnF | 13165 | 13235 | 71 | 0 | H | |||
| 12S | 13236 | 14126 | 891 | 0 | H | |||
| trnE | 14127 | 14194 | 68 | 0 | H | |||
| trnT | 14195 | 14263 | 69 | 0 | H | |||
| 16S | 14548 | 16149 | 1,602 | 284 | L | |||
3.2 Protein-coding genes
With regard to PCGs, nine (cox1-cox3, nad3-nad5, nad4L, cob, atp6, and atp8) are encoded by the positive strand, and the remaining three (nad1, nad2, and nad6) are encoded by the negative strand. These features have been observed in all Asteroidea mitogenomes published so far. Thirteen PCGs initiate with the standard start codon ATG. Most of PCGs terminate with the stop codon TAA (9 of 13), and three genes terminate with the stop codon TAG. Incomplete termination codon T is used by cob. However, mitogenomes often use a variety of nonstandard initiation codons (Wolstenholme, 1992). Nonstandard initiation codon GTG and incomplete termination codon TA are also used in other starfish (Table 3). The lengths of PCGs are 11,506 bp, and the A + T content is 67.15% higher than that of other Asteroidea species (Table 3).
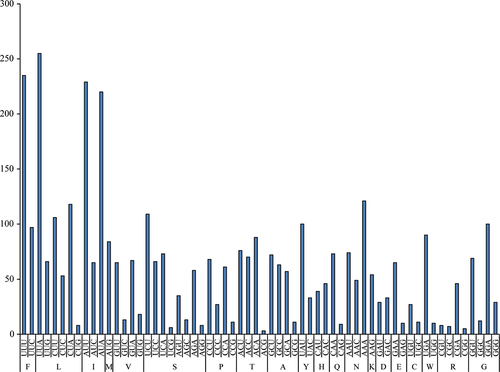
The codon usage of F. benthophila is shown in Figure 3. Among PCGs, leucine (15.85%) and cysteine (0.99%) are the most and the least frequently used amino acids, respectively. Codons, UUA (leucine 6.67%) and ACG (threonine 0.08%), are the most and the least frequently used, respectively. We predict that the richness of A and T occurrence frequency of the mitogenome caused the corresponding amino acid bias to some extent. It is obvious that the A + T content of the third codon position (74.10%) is higher than that of the first (63.43%) and second positions (63.67%).
3.3 Ribosomal RNA and transfer RNA genes
Boundaries of both the small and the large ribosomal genes were determined by BLAST and DOGMA. The 16S and 12S genes of F. benthophila are 1,602 bp (A + T = 72.28%) and 891 bp (A + T = 65.66%) in length, respectively. These lengths are typical for Asteroidea, whereas the AT contents are higher than those of other starfish (Table 3).
We analyzed the entire mitogenome sequence of F. benthophila and successfully identified 22 tRNA genes based on their potential secondary structures using the tRNAscan-SE, ARWEN, and MITOS Web server (Table 4, Supporting Information Figure S1). The length of these tRNA genes ranged from 68 bp (trnS1 and trnE) to 75 bp (trnK). Twenty-one of these genes displayed a common cloverleaf secondary structure, and the remaining one lacked a DHU arm from trnS1. The D-stem absence has been found in many other starfish, such as Acanthaster brevispinus, Acanthaster planci, Aphelasterias japonica, Asterias amurensis, L. quinaria, and Patiria pectinifera (Asakawa, Himeno, Miura, & Watanabe, 1995; Matsubara et al., 2005; Tang et al., 2014; Yasuda et al., 2006).
3.4 Gene arrangement
Mitochondrial gene arrangement has been demonstrated to be an effective means to solve the deep phylogenetic studies (Boore, 1999; Boore & Brown, 1998). In recent years, some research on mt gene arrangement of echinoderms has been reported (Arndt & Smith, 1998; Perseke et al., 2008, 2010; Scouras et al., 2004).
In this study, mitochondrial gene order of echinoderm was compared among species within classes Asteroidea, Echinoidea, Holothuroidea, Ophiuroidea, and Crinoidea (Figure 4). We expected that the mt gene order of starfish may reveal some phylogenetically information. However, the gene component and gene order of eight species of Asteroidea are completely identical to each other. This phenomenon also happened in the class Echinoidea. We obtained 27 complete mt genomes of Echinoidea from NCBI genebank, and the gene component and gene order of 27 species of Echinoidea are also completely identical to each other. Because Strongylocentrotus purpuratus has been considered as a model for developmental and systems biology, we took S. purpuratus as a representative for Echinoidea in Figure 4 (Sodergren et al., 2006). However, mitochondrial gene order has undergone significant changes in the classes of Holothuroidea, Ophiuroidea, and Crinoidea. Scouras et al. (2004) suggested that it is difficult to resolve the echinoderm phylogeny using the mitochondrial gene rearrangement.
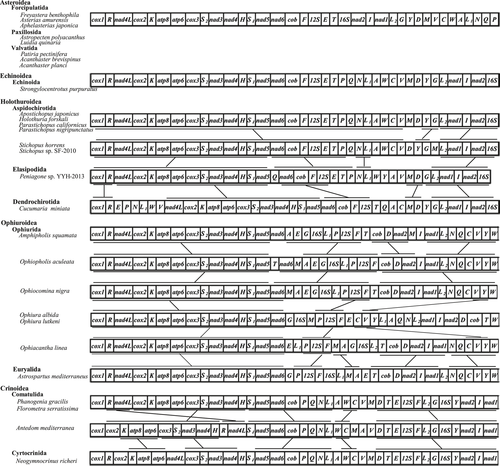
It is interesting that mt gene order of the species in the classes of Asteroidea and Echinoidea is completely identical to each other. If the tRNA is not considered, gene order of PCGs in species within the class Holothuroidea is also the same. This raises the questions: As these species are distributed throughout the world's oceans, why had the mt gene order not been changed and how do they evolve over time. More studies of mt genome species are needed to further investigate whether this pattern is common among starfish, sea urchins, and sea cucumbers.
3.5 Phylogenetic analysis
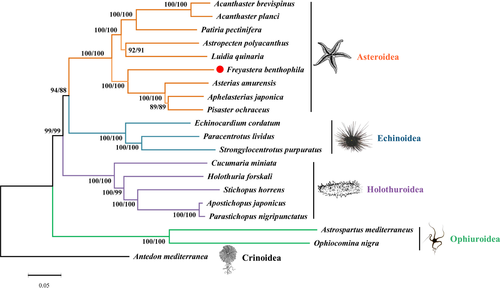
The gene order and transcriptional orientation of the eight Asteroidea species are completely identical to each other, so the mt genome structures would not provide the phylogenetic information. Thus, we performed the phylogenetic analysis using all amino acids of mt protein-coding genes (Figure 5). Almost all the phylogenetic relationships are supported with high values (NJ/ML bootstraps 99–100). Acanthaster brevispinus is first clustered with A. planci and then united with P. pectinifera; meanwhile, Astropecten polyacanthus and L. quinaria formed a clade. And these five starfish formed the Valvatacea clade. Then, A. japonica is first clustered with Pisaster ochraceus and then united with A. amurensis. Finally, F. benthophila with these three species formed a Forcipulatacea clade. Blake (1987) recognized that Brisingida and Forcipulatida are the two orders within the Forcipulatacea and suggested that they were the most primitive asteroids (Blake, 1987, 1988). Mah and Foltz (2011) described that the largest clade within the Forcipulatacea is formed by the Brisingida and Asteriidae, which forms a clade of deep-sea and Southern Hemisphere taxa. In the present study, the results supported the deep-sea Brisingida as a sister taxon to the traditional members of the Asteriidae, and the branch support values are higher than those in previous studies (Glover et al., 2016; Mah & Foltz, 2011). However, the number of Brisingida species with complete mitogenome is still limited, and more mitogenomes and analysis are necessary to determine the phylogenetic relationship among members of Brisingida.
3.6 Positive selection analysis
We examined the potential positive selection in Brisingida lineage because of the colonization of deep-sea environments which may affect the function of mitochondrial genes. The results of selective pressure analyses are shown in Table 5. When the ω ratios for the 13 concatenated mitochondrial protein-coding genes were tested between the deep-sea F. benthophila and other eight shallow sea starfish, we failed to find a significant difference in their ω ratios, which may be due to the large bias of sample sizes (p > 0.05) (Table 5). In addition, in the analyses of individual genes, we found five residues with high posterior probabilities in the atp8 (8 N, 16 I), nad2 (47 D, 196 V), and nad5 (599 N), respectively (Table 5). Similar results have been observed in deep-sea animals, and the authors concluded that it may be related to the adaptation to environment (Sun et al., 2018; Zhang et al., 2017). Under the deep-sea extreme environment, survival may require a modified and adapted energy metabolism (Sun et al., 2018).
| Trees | Branch model | Model compared | 2△lnL | LRT p-value | ||
|---|---|---|---|---|---|---|
| Model | lnL | Estimates of parameters | ||||
| NJ/ML | Model 1 | −77,922.08746 | Model 1 versus Model 0 | 127.22418 | 0.00000 | |
| Two ratio | −77,985.69322 |
ω0 = 0.06446 ω1 = 0.06371 |
Two ratio versus Model 0 | 0.01266 | 0.91027 | |
| Model 0 | −77,985.69955 | ω = 0.06438 | ||||
| Gene | Branch site model (BSM) | Model compared | 2△lnL | LRT p-value | Positive sites | ||||||
|---|---|---|---|---|---|---|---|---|---|---|---|
| Model | lnL | Estimates of parameters | |||||||||
| atp8 | Model A | −1,269.41181 | Site class | 0 | 1 | 2a | 2b | Model A versus Model A null | 1.82842 | 0.17632 | 8 N 0.996** |
| Proportion | 0.53865 | 0.21395 | 0.17707 | 0.07033 | 16 I 0.971* | ||||||
| Background ω | 0.08240 | 1.00000 | 0.08240 | 1.00000 | |||||||
| Foreground ω | 0.08240 | 1.00000 | 151.29990 | 151.29990 | |||||||
| Model A null | −1,270.32602 | ||||||||||
| nad2 | Model A | −7,398.27984 | Site class | 0 | 1 | 2a | 2b | Model A versus Model A null | 2.54316 | 0.11077 | 47 D 0.969* |
| Proportion | 0.83756 | 0.10993 | 0.04641 | 0.00609 | 196 V 0.959* | ||||||
| Background ω | 0.04253 | 1.00000 | 0.04253 | 1.00000 | |||||||
| Foreground ω | 0.04253 | 1.00000 | 127.13451 | 127.13451 | |||||||
| Model A null | −7,399.55142 | ||||||||||
| nad5 | Model A | −12,858.89872 | Site class | 0 | 1 | 2a | 2b | Model A versus Model A null | 0.34180 | 0.55879 | 599 N 0.961* |
| Proportion | 0.76189 | 0.18603 | 0.04185 | 0.01022 | |||||||
| Background ω | 0.04324 | 1.00000 | 0.04324 | 1.00000 | |||||||
| Foreground ω | 0.04324 | 1.00000 | 1.52724 | 1.52724 | |||||||
| Model A null | −12,859.06962 | ||||||||||
- *Posterior probability >95%; **Posterior probability >99%.
Because ATP synthase directly produces ATP, variation in ATPase protein sequence should influence ATP production (Mishmar et al., 2003; Wallace, 2007). Amino acid variations have been widely reported in the ATPase proteins (da Fonseca et al., 2008; Mishmar et al., 2003; Zhang et al., 2017; Zhou et al., 2014). Nad2, nad4, and nad5 are suggested to act as proton-pumping devices (Brandt, 2006; da Fonseca et al., 2008); thus, mutations in these proteins should influence metabolic efficiency (da Fonseca et al., 2008; Hassanin, Ropiquet, Couloux, & Cruaud, 2009; Zhang et al., 2017). Therefore, we predict that mitochondrial protein-coding genes, specifically atp8, nad2, and nad5, may play an important role in F. benthophila's adaptation to deep-sea environment.
4 CONCLUSIONS
In this study, we determined the mitogenome of the deep-sea member F. benthophila, which is 16,175 bp in length and encodes 37 genes including 13 PCGs, two rRNA genes, and 22 tRNA genes on the both strands. We described the mitogenome features, codon usage, gene arrangement, phylogenetic analysis, and positive selection of the starfish F. benthophila. This study is the first determination of the mitogenome of a deep-sea member of the order Brisingida and may shed light on the adaptive evolution of Brisingida species to the deep-sea environment.
ACKNOWLEDGEMENTS
The authors thank the captains and crews of the R/V Xiangyanghong 09 and the pilots of HOV “Jiao Long” for their technical support. This study was supported by The National Key R & D Program of China (2017YFC0306600), Strategic Priority Research Program of the Chinese Academy of Sciences (CAS) (XDB06010104), National Natural Science Foundation of China (41576127), Knowledge Innovation Program of CAS (SIDSSE–201401), Hundred Talents Program of CAS (SIDSSE–BR–201401), and Major scientific and technological projects of Hainan Province (ZDKJ2016009).
CONFLICT OF INTEREST
The authors declare no conflict of interest.
AUTHOR CONTRIBUTIONS
Haibin Zhang and Wendan Mu designed the study. Haibin Zhang contributed to the project coordination and collected the samples. Wendan Mu conducted the sequence analyses and drafted the manuscript. Haibin Zhang and Jun Liu helped to draft the manuscript. All authors read and approved the final manuscript.
DATA ACCESSIBILITY
The complete mitochondrial DNA sequence has been deposited in GenBank (Accession Number: MG563681).


