Visualization of inactive X chromosome in preimplantation embryos utilizing MacroH2A–EGFP transgenic mouse
Summary
One of the two X chromosomes is inactivated in female eutherian mammals. MacroH2A, an unusual histone variant, is known to accumulate on the inactive X chromosome (Xi) during early embryo development, and can thus be used as a marker of the Xi. In this study, we produced a transgenic mouse line expressing the mouse MacroH2A1.2–enhanced green fluorescent protein (EGFP) fusion protein (MacroH2A–EGFP) under the control of a CAG promoter and verified whether MacroH2A–EGFP would be useful for tracing the process of X chromosome inactivation by visualizing Xi noninvasively in preimplantation embryos. In transgenic female mice, MacroH2A–EGFP formed a fluorescent focus in nuclei throughout the body. In female blastocysts, the MacroH2A–EGFP focus colocalized with Xist RNA, well known as a marker of Xi. Fluorescence marking of Xi was first observed in some embryonic cells between the 4- and 8-cell stages. These results demonstrate that MacroH2A can bind to the Xi by around the 8-cell stage in female mouse embryos. These MacroH2A–EGFP transgenic mice might be useful to elucidate the process of X chromosome inactivation during the mouse life cycle. genesis 51:259–267. © 2013 Wiley Periodicals, Inc.
Introduction
In female eutherian mammals, X chromosome inactivation (XCI) is known to compensate for the different dosage of X-linked gene expression between male and female individuals (Lyon, 1961). XCI is a representative example of epigenetic control of gene expression. In the mouse embryo, the paternal X chromosome is inactivated from the two-cell stage and is inactively maintained through the extraembryonic lineage. At the blastocyst stage, the inactive paternal X chromosome is reactivated with loss of epigenetic modifications in the pluripotent inner cell mass (ICM) and then the paternal and maternal X chromosomes are randomly inactivated in differentiated cells derived from the ICM (Kalantry, 2011; van den Berg et al., 2011).
Several unique features of the inactive X chromosome (Xi) have been identified when compared with the active X chromosome. Features of the Xi include hypermethylation of CpG islands, late replication in the S phase of the cell cycle, trimethylation of histone H3 lysine 27, dimethylation of histone H3 lysine 9, hypoacetylation of histone H4, and association of the chromosome with a large untranslated RNA, the Xi-specific transcript (Xist) (Morey and Avner, 2011; Senner and Brockdorff, 2009). In addition, the Xi chromatin is enriched for the histone H2A variant, MacroH2A (Costanzi and Pehrson, 1998; Mermoud et al., 1999).
MacroH2As are unusual histone variants with two subtypes: MacroH2A1 and MacroH2A2 (Costanzi and Pehrson, 2001; Pehrson and Fried, 1992). One-third of the proteins (at the amino terminus) share 60% amino acid sequence identity to conventional H2A, whereas the remaining two-thirds of MacroH2A have no sequence homology to known proteins. Although little is known about the function of MacroH2A, immunolocalization studies and green fluorescence protein (GFP)-tagging studies have demonstrated that MacroH2A1 and MacroH2A2 appear as a dense staining region in female interphase cells, termed a macrochromatin body (MCB) that is identical to the Xi (Chadwick and Willard, 2001; Costanzi and Pehrson, 1998, 2001). Moreover, MacroH2A1 function is known to be dispensable for the viability and fertility of mice (Changolkar et al., 2007). Therefore, we considered that MacroH2A would be a useful tool for labeling the Xi in mice.
Results AND DISCUSSIOn
We produced a plasmid (pCX-MH2A–EGFP) consisting of a CAG promoter, a chimeric cDNA encoding mouse MacroH2A1.2 (a splicing variant of MacroH2A1: GenBank accession number AF171080) (Pehrson et al., 1997) fusion polypeptide with EGFP at the C-terminus of MacroH2A1.2, and the rabbit β-globin polyadenylation signal to visualize the Xi in living cells during early embryogenesis (Fig. 1a). To confirm expression of the fusion protein, the plasmid was first transfected into normal female mouse C2C12 myoblasts, which contain one inactive X chromosome as demonstrated by fluorescence in situ hybridization (FISH) of Xist RNA (Murakami et al., 2009). When an immunoblot analysis of whole lysate was performed using an anti-GFP antibody, a major band of 67 kDa was detected (Fig. 1b). The size was consistent with the expected mass of the MacroH2A1.2–EGFP fusion protein (MacroH2A–EGFP).

Subcellularly, the MacroH2A–EGFP was distributed throughout the nucleus, whereas EGFP protein was distributed throughout the cytoplasm (Fig. 1c). Moreover, a green fluorescent focus, which colocalized with the Barr body evident by 4′,6-diamidino-2-phenylindole (DAPI) staining, was observed in each nucleus of the pCX-MH2A–EGFP transfected cells (Fig. 1d). When Xist RNA-specific probe was used for FISH to identify the Xi, a clear overlap of the Xist RNA signal with the MacroH2A–EGFP focus was detected, indicating that the MacroH2A–EGFP was localized on the Xi. This demonstrates that the MacroH2A–EGFP can be used to label the Xi in cultured female cells.
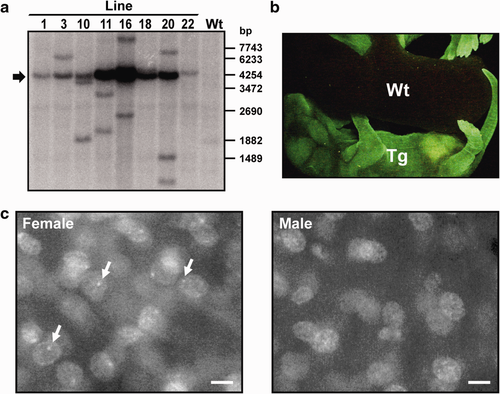
MacroH2A–EGFP transgenic mouse lines expressing MacroH2A–EGFP under the control of a CAG promoter (CX-MH2A–EGFP) were produced by microinjection of a CX-MH2A–EGFP fragment into pronuclear (PN) stage embryos. Southern blot analysis showed that the full length of the transgene had been introduced into the genomes of the eight transgenic mouse lines (Fig. 2a). However, an unexpected band was detected in six lines, except for #1 and #22. All the transgenic mice were healthy and fertile. Because of the low transgene copy number, normal phenotype in homozygous mice, and its ease of breeding for subsequent usage, transgenic mouse line #1 was used for further analysis. In neonatal transgenic mice, green fluorescence was detected throughout the body (Fig. 2b). The MacroH2A–EGFP seemed to accumulate in the nuclei of skin cells in both male and female transgenic mice (Fig. 2c). Moreover, a green fluorescent focus was observed in female cells (Fig. 2c, arrow).
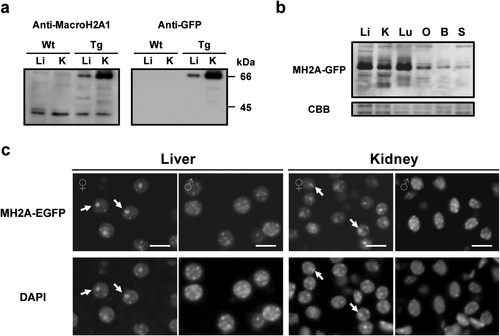
The fusion protein existed mostly in the nuclei of kidney and liver tissues when immunoblot analysis was performed using the nuclear or cytosol extracts (data not shown). In the nuclear extract, a band of 42 kDa was detected in both wild-type and transgenic mice using an anti-macroH2A1 antibody, whereas a band of 67 kDa was detected only in transgenic organs (Fig. 3a). This molecular size of 67 kDa was consistent with the expected size of the MacroH2A–EGFP. A band of the same size was also detected with an anti-GFP antibody, confirming that the band represented the MacroH2A–EGFP. MacroH2A–EGFP was detected in various organs, according to the CAG promoter (Fig. 3b). Moreover, frozen sections showed that MacroH2A–EGFP was distributed throughout the cell nucleus in the liver (Fig. 3c), kidney (Fig. 3c), muscle (data not shown), and spleen (data not shown). MacroH2A–EGFP fluorescent foci—colocalizing with the Barr body evident by DAPI staining—were observed only in female mice (Fig. 3c), indicating that the fusion protein is preferentially concentrated in the Xi in somatic cells of female transgenic mice, as reported for endogenous MacroH2A (Costanzi and Pehrson, 1998).
To examine the localization of MacroH2A–EGFP in preimplantation embryos, female transgenic mice were mated with wild-type male mice. MacroH2A–EGFP was localized in the nucleus in all embryonic stages (Fig. 4a), although PN, 2-cell, 4-cell, and 8-cell stage embryos exhibited weak fluorescence, consistent with previous reports (Chang et al., 2005; Nashun et al., 2010). In detail, some strong MacroH2A–EGFP signals were observed in the nuclei from the 2-cell stage. When the localization of MacroH2A-EGFP was analyzed using line intensity scan analysis, the signal intensity of MacroH2A-EGFP overlapping with Xist RNA signal was low against the threshold at the 4-cell stage, indicating that the strong fluorescent signals were not Xi (Fig. 4b). At the 8-cell stage, one of the MacroH2A-EGFP strong signals, slightly high against the threshold, began to colocalize with Xist RNA signal (Fig. 4a,b). The number of foci colocalizing with Xist RNA increased toward the morula stage. Finally, only one MacroH2A–EGFP focus was observed in each nucleus of the female blastocysts and most of these colocalized with Xist RNA (Fig. 4a,b). Conversely, MacroH2A–EGFP was distributed throughout the nucleus without any particular focus in male blastocysts (Fig. 4a).
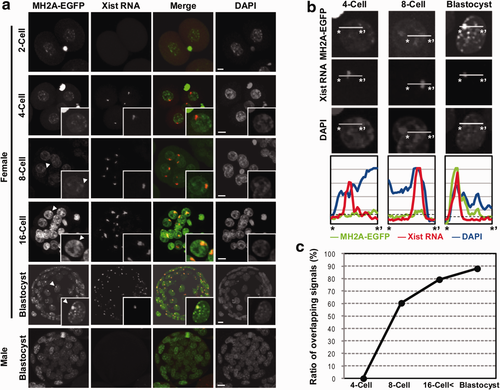
We also calculated the ratio of the strong MacroH2A–EGFP signal overlapping with the Xist RNA signal at the 4-cell, 8-cell, morula (>16 cells), and blastocyst stages (Fig. 4c). None of the signals overlapped with Xist RNA in the 4-cell stage (n = 4 embryos; 16 blastomeres). However, one of the signals in the nucleus overlapped with Xist RNA in more than half of the blastomeres by the 8-cell stage (60%, n = 6 embryos; 48 blastomeres). The ratio of the overlapping signals increased with embryo development (>16-cell stage 79%, n = 4 embryos, 116 blastomeres) and almost all of the MacroH2A–EGFP foci colocalized with Xist RNA at the blastocyst stage (88%, n = 7 embryos, 535 blastomeres). These results indicate that MacroH2A–EGFP accumulated gradually on the Xi after the 4-cell stage in these mouse embryos.
The concentration of MacroH2A–EGFP in the Xi from the 4-cell to the 8-cell stage coincided with the gene silencing of some Xi loci beginning from the 4-cell stage (Patrat et al., 2009). Recruitment of MacroH2A to the Xi is reported to begin after the coating of Xist RNA and around the accumulation of polycomb proteins between 8-cell and 16-cell stages in mouse preimplantation embryos (Costanzi et al., 2000; Okamoto et al., 2004). Our results suggest that the factors recruiting MacroH2A to the Xi might be expressed during the 4-cell to the 8-cell stage. The necessity of polycomb proteins for MacroH2A accumulation needs to be examined further.
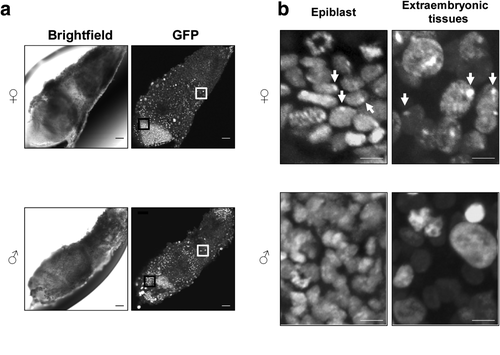
MacroH2A–EGFP transgenic mice enabled us to trace the Xi noninvasively by green fluorescence in preimplantation embryos. When we examined the MacroH2A-EGFP localization in embryo at embryonic day 7.5, the MacroH2A–EGFP foci were also observed in epiblast and extraembryonic tissues (Fig. 5a,b), indicating that the transgenic mice can be used to label the Xi in postimplantation embryos. Moreover, MacroH2A is known to be involved in development, oncogenesis, and cell cycle by associating with the genome of associated genes (Barzily-Rokni et al., 2011; Gamble and Kraus, 2010; Kapoor et al., 2010). The transgenic mouse would also be a helpful tool for studies in the epigenetic regulation of autosomal gene expression.
MATERIALS AND METHODS
Expression Construct
A DNA fragment encoding mouse MacroH2A1.2 was amplified by PCR from a B16F10 cDNA library, using a set of primers, 5′–GGAATTCGCCACCATGTCGAGCCGCGGCG–3′ and 5′–AAGTCGACGTTGGCGTCCAGCTTGGC–3′. The reaction was performed in a 50 µl mixture containing 20 mM Tris/HCl pH 8.0, 100 mM KCl, 0.1 mM EDTA, 1 mM dithiothreitol (DTT), 0.5 % Tween 20, 0.5 % Nonidet P-40, 2 mM MgCl2, 0.2 mM each of dATP, dCTP, dGTP, and dTTP, 1 µM of each primer, template cDNA, and 2 units of LA Taq DNA polymerase (Takara Bio Inc., Shiga, Japan). The reaction program consisted of 30 cycles at 94°C for 30 sec, 65°C for 30 sec, and 72°C for 70 sec. The PCR product was then introduced into a pEGFP-N3 vector (Clontech Laboratories Inc., Mountain View, CA, USA) at EcoRI and SalI sites to create a fusion cDNA encoding mouse MacroH2A1.2 fused with enhanced GFP (EGFP) at the C terminus. Nucleotide sequencing was carried out using a Hitachi SQ5500E sequencer (Hitachi Ltd., Tokyo, Japan). The fusion cDNA was then subcloned into a pCAGGS vector, containing the chicken β-actin promoter and a cytomegalovirus enhancer, a β-actin intron, and a bovine globin polyadenylation signal (Niwa et al., 1991), downstream of a cytomegalovirus enhancer/β-actin promoter (pCX-MH2A–EGFP). Plasmid pCX-EGFP was a gift from Dr. Masaru Okabe (Osaka University) (Okabe et al., 1997).
Cell Culture and Transfection Analysis
The mouse female myoblast line C2C12 was maintained in Dulbecco's modified Eagle's medium (Nissui Pharmaceutical Co., Ltd., Tokyo, Japan) supplemented with 10% fetal calf serum, 4 mM L-glutamine, 150 U/ml penicillin, and 0.1 mg/ml streptomycin at 37°C under 5% CO2 in air. Expression plasmids (2 µg) were introduced into the cells using a Fugene HD transfection reagent (Roche Diagnostics, Basel, Switzerland). After 48 h incubation at 37°C, cells were harvested by centrifugation, extracted on ice in 20 mM Hepes/KOH pH 7.5, containing 150 mM NaCl, 1 mM EDTA, 1% Triton X-100, 0.5% sodium deoxycholate, 0.1% SDS, and protease inhibitors for 20 min and recentrifuged at 16,000g for 10 min. Proteins in the supernatant solution were subjected to immunoblot analysis. To establish a stably transformed C2C12 cell line, we linearized 1.6 µg of pCX-MH2A–EGFP with HindIII (Takara Bio), and 0.4 μg of a pST-neoB plasmid carrying a neomycin resistance gene (Katoh et al., 1987) was linearized with ScaI (Takara Bio) before cotransfection with FuGENE HD. Cells were grown for 24 h before selection with G418 (Sigma-Aldrich, St. Louis, MO, USA).
Preparation of Nuclear Extracts of Tissues
Mouse tissues (0.2 g each) were homogenized in two volumes of buffer A (10 mM Hepes/KOH pH 7.6, containing 1.5 mM MgCl2, 10 mM KCl) containing 1× HALT protease inhibitor cocktail (PI) (Thermo Fisher Scientific Inc., Waltham, MA, USA) at 4°C with a pestle for microtube (As One, Osaka, Japan). The homogenate was centrifuged at 2800g for 5 min at 4°C. The precipitate was washed with buffer A and gently suspended in equal volume of buffer C (20 mM Hepes/KOH pH 7.6, containing 5 mM MgCl2, 0.2 mM EDTA, 25% glycerol) containing PI. The suspension was added 1/10 volume of 5 M NaCl and incubated for 1 h at 4°C. The suspension was centrifuged at 15,000g for 1 h at 4°C. The supernatant solution was used as a nuclear extract. Protein concentration was determined using a Bio-Rad protein assay kit (Bio-Rad Laboratories, Inc., Hercules, CA, USA).
Immunoblot Analysis
Proteins were separated using SDS-polyacrylamide gel electrophoresis and transferred onto Immobilon-P polyvinylidene difluoride membranes (Millipore Corp., Bedford, MA, USA). After blocking with 2% skim milk, the blots were incubated with primary antibodies: rabbit polyclonal anti-MacroH2A1 (1:400; Millipore Corp.), rabbit polyclonal anti-GFP (1:200; Santa Cruz Biotechnology, Santa Cruz, CA, USA) and mouse monoclonal anti-α-tubulin (1:5000; Sigma-Aldrich). The blots were then incubated with specific secondary antibodies conjugated with horseradish peroxidase (1:5000; Promega Corp., Madison, WI, USA). The immunoreactive proteins were visualized by an ECL western blotting detection kit (GE Healthcare BioSciences, Piscataway, NJ, USA).
Production of MacroH2A–EGFP Transgenic Mice
All animal experiments were carried out according to the Guide for the Care and Use of Laboratory Animals of Tottori University. To generate transgenic mice expressing MacroH2A–EGFP, the ScaI/HindIII fragment from pCX-MH2A–EGFP were excised and microinjected into the pronuclei of B6D2F1 × B6D2F1 zygotes following purification using a QIAEX II gel extraction system (Qiagen Inc., Valencia, CA, USA) (Nakanishi et al., 2002). Thirty-one mice were born from 139 microinjected eggs and 8 of them were positive for the transgene by PCR amplification from tail tissue genomic DNA, using the primers, 5′–TGACAGAAAGCTGAAATCCATCGC–3′ and 5′–TCCAGCAGGACCATGTGATCGC–3′, and by observing whole body EGFP fluorescence using a fluorescence dissecting microscope (MZ16F; Leica Microsystems Inc., Bannockburn, IL, USA). The MacroH2A–EGFP transgenic mouse lines were maintained by mating with wild-type mice (B6D2F1). All experiments were performed using heterozygous transgenic mice. This MacroH2A–EGFP transgenic mouse line will be made available to the research community after publication.
Southern Blot Analysis
Genomic DNA (10 µg) was prepared from mouse tail tissues, digested with DraIII (Takara Bio), separated by agarose gel electrophoresis, and transferred onto Hybond-XL nylon membranes (GE Healthcare UK Ltd., Buckinghamshire, UK). The blots were probed with a 32P-labeled EGFP fragment and analyzed using a BAS-2500 Bio-Image Analyzer (Fuji Photo Film Corp., Tokyo, Japan).
Frozen Sections
Fresh liver and kidney fragments were fixed in 4% paraformaldehyde at 4°C for 12 h and then transferred sequentially into 10%, 20%, 30% sucrose in phosphate-buffered saline (PBS) at 4°C for 12 h each. Fixed tissues were embedded in Tissue-Tek OCT compound (Sakura Finetechnical Co. Ltd. Tokyo, Japan) and 6 μm sections were prepared using a HM 505 E Cryostat (Microton, Walldorf, Germany). Sections were counterstained with DAPI (Sigma-Aldrich) and images were captured using a fluorescence microscope (DMRB; Leica).
RNA FISH
C2C12 cells were seeded onto Lab-Tek chamber slides (Nalge Nunc International, Rochester, NY, USA) and fixed in 4% paraformaldehyde for 20 min at room temperature. After being washed with PBS, the cells were permeabilized with 0.2% Triton X-100 in PBS for 10 min and postfixed for 5 min at room temperature with 1% paraformaldehyde. The slides were dehydrated and subjected to RNA FISH. DNA fragments corresponding to exons 1–7 of mouse Xist RNA (Sado et al., 2001) were labeled by nick translation (Roche Diagnostics) with digoxigenin-11-dUTP (Roche Diagnostics), purified by ethanol precipitation, and dissolved in formamide. The Xist probe was hybridized to the slides and detected as described (Murakami et al., 2009). Keyence BZ 9000 microscope (Keyence Corp., Osaka, Japan) was used for image acquisition.
Embryos were fixed in 4% paraformaldehyde for 1 h, permeabilized with PBS containing 0.2% Triton X-100 for 15 min, postfixed in 1% paraformaldehyde for 30 min, and rinsed in 5× saline sodium citrate buffer (SSC: 0.15 M NaCl, 0.015 M sodium citrate, pH 7) at room temperature. The Xist probe (above) was mixed with an equal volume of hybridization solution to make a final concentration of 50% formamide, 5× SSC, 50 μg/ml heparin sodium salt, 0.1% Tween 20, and incubated with the embryos overnight at 45°C. The embryos were washed in 5× SSC containing 50% formamide and 0.1% Tween 20 at 45°C for 15 min and then in 5× SSC, 2× SSC, and 1× SSC for 10 min each at room temperature. After being rinsed in 4× SSC, they were incubated with anti-digoxigenin-rhodamine Fab fragments (Roche Diagnostics) at a 1:100 dilution in 4× SSC with 1% BlockAce (Dainippon Pharmaceutical Co. Ltd., Osaka, Japan) overnight at 4°C. The embryos were washed sequentially with 4× SSC, 0.05% Triton X-100 in 4× SSC, and 4 × SSC for 20 min each at room temperature and stained with 0.25 μg/ml DAPI. FISH images were captured as vertical sections (∼1 µm intervals) using an Olympus FV1000D IX81 confocal laser scanning fluorescence microscope (Olympus Corp., Tokyo, Japan) and then stacked into one picture. The pictures acquired were pseudocolored and line scan analysis was done to measure the intensity across the line trace using the Olympus FluoView FV1000 software. FISH images were modified in contrast and brightness using Adobe Photoshop CS2 (Adobe Systems, San Jose, CA, USA).
ACKNOWLEDGMENTS
The authors wish to thank Dr. Naohiro Hori, Dr. Goshi Shiota, Dr. Hiroyuki Kugoh, and our laboratory members for technical assistance and valuable discussions. This study was supported by Grant-in-Aids for Scientific Research on Priority Areas, Young Scientists (B), and JSPS Fellows from Japan Society for the Promotion of Science (JSPS) and Ministry of Education, Culture, Sports, Science and Technology in Japan (MEXT).


