Natural killer cell (NK) subsets and NK-like T-cell populations in acute myeloid leukemias and myelodysplastic syndromes
Abstract
The impact of the immune microenvironment on the behavior and therapeutic strategies for hematopoietic and lymphoid neoplasms is being increasingly recognized. Many functional studies of natural killer (NK) cell cytotoxic responses in myelodysplasia (MDS) and acute myeloid leukemia (AML) exist, but with limited data on these lymphocyte proportions and related T-cell subsets. The proportions of these cells and their prognostic implications were therefore investigated in 89 AML, 51 MDS, and 20 control marrows by flow cytometry. The median proportion of NK cells (relative to the total lymphocytes) was lower in AML versus controls (P = 0.01). Among AML, a lower proportion of NK cells predicted better survival, whereas a higher NK cell proportion was associated with the poor prognostic AML category (P = 0.002). NK cell proportions were similar in MDS, MDS subgroups, and control marrows. The relative proportion of the mature NK cell subset (CD56dim CD16/57bright) was lower in AML and MDS versus controls (P = 0.006, P = 0.0002, respectively). The proportion of mature NK cells was not a prognostic indicator although fewer were seen in poor prognosis AML. In contrast, a lower proportion of mature NK cells correlated with worse survival in MDS (P = 0.027). A higher proportion of NK-like T-cells (of total lymphoid cells) was found in MDS compared to controls (P = 0.01). A lower proportion of NK-like T-cells predicted better survival in AML but not in MDS. Thus, the proportions of NK, NK-cell subsets, and NK-like T-cells vary in myeloid neoplasms, may potentially impact immunomodulatory therapies, and may impact outcome. © 2016 International Clinical Cytometry Society
The immune response to neoplastic cells consists of both innate and adaptive immune responses. The innate system includes natural killer (NK) cells, cytolytic T-cells expressing T-cell receptors (TCR) of γδ type (CTLγδ), and invariant natural killer T-cells (iNKT) 1, 2. The adaptive system consists predominantly of cytolytic T-lymphocytes that identify specific antigenic targets through the CD3-TCR complex in association with class I major histocompatibility (MHC) molecules 3. Invariant NKT (iNKT) cells express specific subsets of TCRαβ type and are thought to form a first line defense against certain bacterial infections and identify target cells expressing certain lipid rich antigens via the TCR in association with CD1d (and related CD1 family members), a class I like MHC-related antigen involved in presentation of lipid rich antigen to the iNKT cells 4, 5.
Natural killer cells, like other members of the lymphocyte family, derive primarily from bone marrow progenitor cells and consist in humans of primarily two principle subsets: 1 CD56dimCD16+ (localized mostly in peripheral blood, bone marrow, and spleen, and principally involve a cytokine mediated response) and 2 CD56bright CD16dim/negative (localized mostly in peripheral tissue sites and involved primarily in direct target cell cytolytic activity) 6. They recognize virally infected and neoplastic cells predominantly in an MHC-unrestricted fashion by recognizing target cells having down-regulated MHC class I molecules 7.
Understanding the microenvironmental influences and specifically the role of the immune system in the behavior of myeloid neoplasms is of great importance especially with the therapeutic success of immunomodulatory techniques (8–11). An important component that may relate to tumor control and progression are the natural killer (NK) cells and T-cells that coexpress NK-associated antigens, the so-called NK-like T cells. The NK-like T cells demonstrate cytotoxic killing but are not restricted by MHC recognition 12. NK cell activity has been studied in various malignancies including breast carcinomas 13, non-Hodgkin lymphoma 14-16, Hodgkin lymphoma 17, multiple myeloma 18, and myeloid neoplasms 19-31 and evasion of NK immunosurveillance may be important for disease progression. Most studies evaluating NK cells in myeloid neoplasms have focused on their functional abnormalities, with few addressing their relative or absolute numbers 21, 23, 25, 30, 31. Little attention has been paid to the enumeration of the mature versus immature NK subsets that are distinguished, not only, based on CD16 and intensity of CD56 expression and also in anatomic distribution and function 7, 32, 33.
The baseline relative proportions of NK cells and their subsets at diagnosis is especially important with the renewed interest in attempt to utilize autologous NK cells in treatment. Major advances have been made in this regard with phase 1 trials of anti-KIR antibodies that block NK-cell inhibitory recognition of self-HLA-C and activate the autologous NK cells against the malignant cells 11, 34, 35. The response to such a therapy may be dependent not only on the proportion of existing autologous NK cells but also on the relative proportion of the NK cell subsets as they differ in their expression of inhibitory and activating receptors. In addition, most prior studies have evaluated NK cells in the peripheral blood, and not the bone marrow, which is the primary organ of involvement in the myeloid neoplasms. Knowledge about the influence of NK-like T-cells is even more complex and limited 36; although there are phase 1 and 2 trials of use of NK-like T-cells in solid tumors 37.
To address these questions, flow cytometric immunophenotypic studies were retrospectively reviewed to determine the proportion of NK cells, their subsets, and NK-like T-cells in bone marrow aspirations with acute myeloid leukemias (AML), myelodysplastic syndromes and benign control samples. The myeloid neoplasms were further categorized based on the 2008 WHO criteria 38. The relationship between the NK, NK subset, and NK-like T-cell populations and clinicopathologic features including survival data were evaluated.
MATERIALS AND METHODS
Case Selection
The study was approved by the University of Pittsburgh Institutional Review Board. Eighty-nine cases of AML at diagnosis (classified as per 2008 WHO criteria) 38, 51 cases of MDS at diagnosis (classified as per 2008 WHO criteria) 38, and 20 negative bone marrows submitted for lymphoma staging evaluation without history of or evidence of a myeloid neoplasm, were selected from specimens analyzed in the clinical flow cytometry laboratory of the University of Pittsburgh Medical Center, between January 2011 and August 2012. Patients with a history of immune mediated disorders or immunodeficiency such as immune thrombocytopenic purpura, HIV or solid organ transplantation were excluded. Patients with a prior history of myeloproliferative neoplasm (MPN), children <12 years and patients with a history of prior treatment with chemotherapeutic agents [except AML with myelodysplasia-related changes (AML-MRC)] were excluded.
Data Collection
Pathology reports and flow cytometry scatter plots were reviewed in all cases and controls. Patient's clinical characteristics (gender, age at diagnosis, treatment, and survival data) were obtained by electronic medical record review. AML were divided into four subgroups: AML with recurrent cytogenetic abnormalities; AML with mutated NPM1; AML, not otherwise specified; and AML, poor prognostic category (Table 1). Laboratory values including hemoglobin, absolute neutrophil count, and platelet count were noted in cases of MDS for stratification into prognostic subgroups by the Revised International Prognostic Scoring System (IPPS-R) 39. IPSS-R scoring was not performed for the therapy-related myelodysplastic syndrome (t-MDS), which were analyzed separately. For statistical analyses, MDS were divided into four subgroups (low risk- IPSS-R 1 and 2; intermediate risk- IPSS-R 3; high risk- IPSS-R 4 and 5; t-MDS) (Table 1).
| Category | n | Total lymphs | T-cells | NK-like T-cells | NK cells | CD16/57+ (mature) NK |
|---|---|---|---|---|---|---|
| (% of total cells) | (% of total lymphocytes) | (% of total NK cells) | ||||
| AML, good prognosisa | 11 | 8.1 (3.4–36.6) | 74.4 (67.5–87.0) | 13.4 (1.8–21.0) | 7.1 (2.3–20.5) | 89.8 (73.1–98.5) |
| AML, poor prognosisb | 39 | 10.6 (1.0–53.9) | 73.7 (27.9––92.1) | 19.8 (2.9–52.8) | 12.6 (4.7–43.8) | 84.1 (16.0–98.3) |
| AML, NPM1 mutated | 9 | 7.4 (1.8–49.1) | 79.2 (49.3–90.7) | 12.4 (5.1–42.4) | 4.1 (2.8–13.8) | 93.3 (77.4–97.1) |
| AML, NOS | 30 | 6.4 (1.2–73.1) | 78.6 (22.9–95.7) | 17.3 (2.1–50.2) | 7.8 (0.6–24.3) | 88.7 (33.3–98.4) |
| MDS, low risk | 26 | 17.4 (8.6–35.6) | 76.1 (56.2–94.2) | 18.4 (3.8–47.6) | 12.1 (0.9–36.8) | 84.6 (36.8–98.1) |
| MDS, Int risk | 4 | 16.9 (3.8–43.9) | 80.4 (76.9–87.5) | 12.1 (3.7–42) | 13.4 (8.9–15.1) | 73.7 (69.7–98.2) |
| MDS, high risk | 16 | 18.2 (13.8–54.7) | 83.9 (62.4–95.8) | 24.7 (10.8–49.6) | 6.6 (1.4–31.3) | 82.4 (37.4–98.6) |
| T-MDSc | 5 | 20.3 (3.6–29.2) | 82.2 (40.9–91.0) | 30.1 (1.0–53.0) | 10.8 (6.1–16.8) | 71.4 (20.3–85.1) |
| Controlsd | 20 | 15.1 (6.4–30.7) | 73.5 (58.5–90.1) | 11.0 (3.5–53.7) | 15.3 (3.1–28.0) | 92.9 (76.8–98.6) |
- Acute myeloid leukemia with t(15;17)(q24.1;q21) (seven cases), t(8;21)(q22;q22) (one case), and inv16(p13.1q22) (three cases).
- Acute myeloid leukemia, myelodysplasia related (24 cases) and AML, therapy related (12 cases), one case with t(6;9)(p23;q34), and onr case with t(9;11)(p22;q23).
- Therapy-related myelodysplasia.
- Negative staging marrow samples from patients with lymphoma.
- Abbreviations: n = sample size; NK = natural killer cells, AML = acute myeloid leukemia. NOS = not otherwise specified. MDS = myelodysplasia.
Flow Cytometric Immunophenotypic Studies
All samples were analyzed for the proportion of NK cells and NK-like T-cells relative to the total lymphoid cells and NK cell subsets relative to the total NK cells, using tubes that were run at the time of primary diagnostic analysis. Briefly, a suspension of 5 × l05 cells/tube in 2% fetal bovine serum was incubated with different combinations of fluorochrome-labeled antibodies for 15 min at room temperature (23°C). The following tube and antibody combinations were used: 1 NK/T cell tube: CD16/57 FITC, CD7 PE, CD4 PerCP-Cy5.5, CD2 PE-Cy7, CD56 APC, CD3 APC-H7, CD5 V450, CD8 V500; 2 B-cell tube (8-color): Kappa FITC, Lambda PE, CD5 PerCP-Cy5.5, CD19 PE-Cy7, CD10 APC, CD38 APC-H7, CD20 V450, CD45 V500; 3 B-cell tube (4-color): Kappa FITC, Lambda PE, CD19 PerCP-Cy5.5, CD5 APC. Flurochrome abbreviations are as follows: FITC, fluorescein isothiocyanate; PE, Phyocerythrin; PerCP-Cy5.5, Peridinin chlorophyll protein Cychrome 5.5; PE-Cy7, Phycoerythrin-cychrome 7; APC, allophycocyanin; APC-H7, Allophyocyanin H7; BD Horizon V450TM and V500TM. All antibodies were obtained from BD Biosciences, San Jose, CA). Lysis was performed using FACS Lyse (BD Biosciences, San Jose, CA), and followed by washing with PBS with 0.1% sodium azide. Stained cells were fixed with 2% formaldehyde. Data were acquired using BD FACS Canto II flow cytometer (BD Bioscience, San Jose, CA), and 30,000 events were collected in most cases wherever possible. Analysis was performed using BD FACSDiva software (BD Bioscience, San Jose, CA). T-cells (CD3 positive, CD2 positive), and NK cells (CD3 negative, CD7 positive cells with at least dim expression of CD56) were identified based on a plot of CD16/57 versus CD56. The NK cell subsets were recognized as CD56brightCD16/57negative/dim NK-cells (immature), and CD56dim CD16/57bright NK-cells (mature) (Fig. 1). The percentage of NK cells, T-cells with expression of CD56 and/or CD16/57 (NK-like T-cells, NKT) as a proportion of the total lymphoid cells (B-cells + T-cell + NK-cells) and NK cell subset as a proportion of total NK cells was determined in each case. The proportion of B-cells was determined based on CD19 and/or CD20 expression using four or eight antibody combinations (based on availability). The T/NK cell and B-cell analyses were evaluated for comparability by comparing the CD5+ T cells from the B-cell tube and CD3+, CD2+ cells from the T-cell tube. Cases were excluded if no CD5 was included in the B cell tube, if <20,000 events were acquired, or if the blasts demonstrated CD56 or CD7 staining.
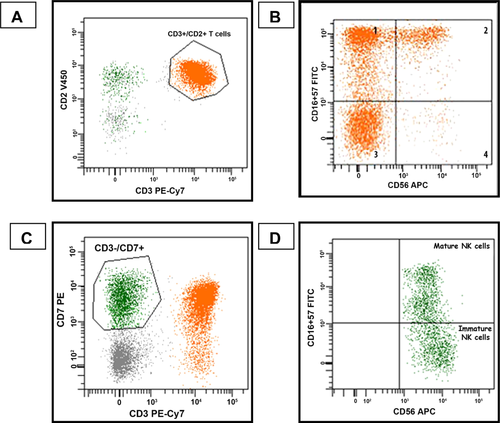
Flow cytometric analysis. A: T cells (orange population) were identified by their co-expression of CD3 and CD2, B: NK-like T-cells were identified by gating on the T cells and then analyzing their expression of CD16/57 and CD56, C: Cells identified as NK cells (green population) were CD7+, CD3−. CD7+, CD3− cells that were CD56 negative were not included among the reported NK cell population, D: NK cell subsets were identified by gating specifically on the CD7+, CD3− cells and evaluating expression of CD16/57 and CD56 (mature NK cells: CD56dim CD16/57positive, immature NK cells: CD56bright CD16/57negative/dim).
Statistical Analysis
Statistical analysis was performed using Stata 12 software (StataCorp LP, College Station, TX). Comparisons of the median percentage of NK cells, NK like T-cells, and NK cell subsets were performed using Mann Whitney-U and Kruskal–Wallis tests. Survival differences were evaluated by Cox proportional hazards model analysis, with adjustment for prognostic subcategory. Kaplan–Meier survival curves and the log rank test were used to evaluate survival data.
RESULTS
Clinicopathologic Findings
AML (n = 89)
The mean age of the AML cohort was 63 years (range 14–87 years) with 48 males and 41 females. There were 11 AML with recurrent cytogenetic abnormalities, 39 AML, poor prognostic category, 9 AML with mutated NPM1 and 30 AML-NOS (Table 1). One patient with AML-NOS was found to have a t(9;22) but did not have a history of chronic myeloid leukemia. Median survival of patients with AML with good prognosis was >664 days, AML with poor prognosis 189 days, AML with mutated NPM1 347 days and AML-NOS 340 days.
Treatment
All seven patients with AML t(15;17) were treated with all-trans-retinoic acid (ATRA) and Idarubicin. Thirty-five patients received induction chemotherapy with Idarubicin/cytarabine followed by high dose intermittent cytarabine (HIDAC) consolidation chemotherapy; of these, 12 patients required further therapy with multiple inductions. Other therapies included stem cell transplant, decitabine, azacitidine, hydroxyurea, mitoxantrone, etoposide, darbepoetin alpha, and lenalidomide. Two patients received supportive care only.
MDS (N = 51)
The mean age of the MDS cohort was 72.9 years (range 47–92 years), with 33 males and 18 females. There were 26 low risk MDS, 4 intermediate risk MDS, 16 high risk MDS, and 5 therapy-related MDS (t-MDS). Four patients progressed to AML, 3 to higher grade MDS, 30 did not progress and in 14 there was no follow-up available.
Treatment
Treatment included azacitidine, decitabine, darbepoetin alpha, lenalidomide, or supportive treatment. Patients who progressed to AML were treated with further induction chemotherapy or decitabine.
Control Bone Marrows (N = 20)
These included uninvolved staging bone marrows in patients with six follicular lymphomas (one patient also had a history of adenocarcinoma of the lung and stomach), six diffuse large B-cell lymphomas (one primary CNS, one testicular, one with a history of prostate carcinoma, and three not otherwise specified), two primary cutaneous lymphomas, (one follicle center cell lymphoma and one primary cutaneous marginal zone lymphoma), four B-cell lymphomas, not further classified, one anaplastic large cell lymphoma and one classical Hodgkin lymphoma. The mean age of these patients was 55.7 years (age range 24–77 years) with 9 males and 11 females.
Immunophenotypic Studies
AML
The median percentage (%) of NK cells relative to total lymphocytes in AML was lower compared to the control marrows (8.3% versus 15.3%) (P = 0.01) (Fig. 2) as was the median percentage of the mature NK cell subset (CD56dim CD16/57bright) relative to total NK cells (88.0% versus 92.9%) (P = 0.006, Fig. 3). The poor prognostic subtype of AML demonstrated a significantly higher percentage of NK cells compared to other AML groups; however, it had a lower relative percentage of mature NK cells compared to AML, NOS (P = 0.02) (Fig. 3, Table 1). The proportion of NK-like T cells did not differ compared to MDS or control marrows or within the AML subgroups.
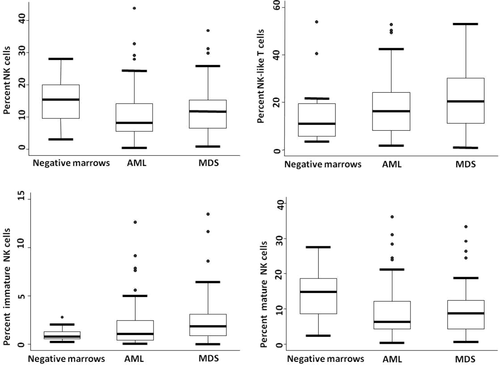
Proportion of NK cells, NK-like T-cells, mature NK cells, and immature NK cells relative to the total lymphoid cells.
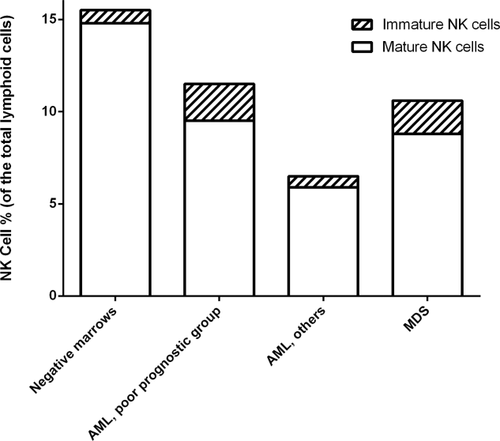
Median proportion of total NK cells and NK cell subsets relative to total lymphoid cells.
MDS
The percentage of NK cells did not differ between MDS and either control marrows or AML or within the MDS categories. The relative median percentage of the mature NK cell subset was lower in MDS compared to negative control marrows (82.1% versus 92.9%; MDS versus negative marrow P = 0.0002), and showed a trend to be lower than in AML (P = 0.06). The median percentage of mature NK cells did not differ within the various MDS subgroups. There was a significantly higher median percentage of NK-like T cells in MDS compared to negative marrows (19.2% versus 11.0%, P = 0.01); however, there were similar proportions of NK-like T cells within the subgroups of MDS.
Prognostic correlations
A lower proportion of NK cells at diagnosis correlated with better survival in AML [HR (95% CI):1.05 (1.01–1.08); P = 0.002] (Fig. 4a). This effect persisted even after adjusting for prognostic categories of AML (P = 0.01). The percentage of mature NK cells did not correlate with survival in AML. The proportion of NK cells did not correlate with survival in MDS; however, a low proportion of mature NK cells did correlate with worse survival in MDS [HR (95% CI): 0.08 (0.008–0.75); P = 0.027] (Fig. 5). A lower percentage of NK-like T cells also correlated with better survival in AML, [HR (95% CI): 1.05 (1.01–1.08); P = 0.002] (Fig. 4b); however, there was only a trend when adjusted for the otherwise defined prognostic categories (P = 0.08). NK like T-cells did not predict survival in MDS patients.
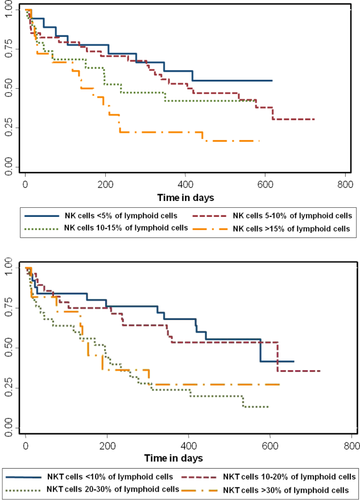
Kaplan–Meier survival curves for patients with AML stratified by the percentage of NK (top panel) and NK-like T-cells (NKT, bottom panel). A higher percentage of NK cells is associated with a worse survival (P = 0.002). A higher percentage of NKT cells is associated with worse survival (P = 0.02). [Color figure can be viewed in the online issue, which is available at wileyonlinelibrary.com.]
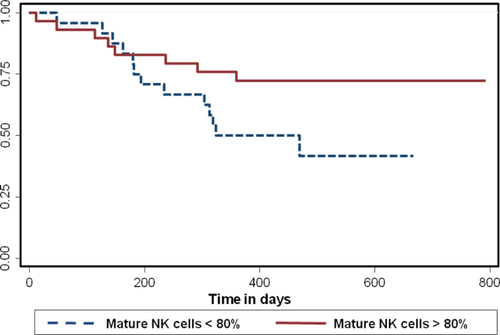
Kaplan–Meier survival curves in MDS based on the percentage of mature NK cells. A lower percentage of mature NK cells of total NK cells is associated with a worse survival (P = 0.02). [Color figure can be viewed in the online issue, which is available at wileyonlinelibrary.com.]
DISCUSSION
There has been dramatic progress in understanding the role of the immune system and its potential exploitation in the therapy for myeloid neoplasms. The focus has been on modulating the innate immune system such as NK and NK-like T-cells as many tumor cells have defective expression of human leukocyte antigens (HLA) and, unlike the adaptive immune system, the cells of the innate immune system have an HLA-independent mechanism of killing the target cell 7. Unfortunately, “self/autologous” NK cells have been shown to be functionally incompetent against most neoplastic clones that arise in both solid tumors and other neoplasms, probably due to suppression by the physiologic recognition of “self” MHC molecules on the neoplastic cells by the NK-cell recognition 40. In addition, some studies have shown that at least a subset of NK cells in some myeloid neoplasms harbor the same cytogenetic anomaly and hence could be derived from a common clonal progenitor 31, 41, 42. In contrast, “alloreactive” NK cells sense the missing expression of self MHC molecules 43 and mediate cytotoxic action against the tumor cells such as in the setting of haploidentical hematopoietic cell transplantation 9, 10. In vitro studies show that “alloreactive” NK cells effectively destroy acute myeloid leukemia (AML), chronic myeloid leukemia (CML), T-cell acute lymphoblastic leukemia (ALL), chronic lymphocytic leukemia (CLL), non-Hodgkin lymphoma, and multiple myeloma cells 8.
Recently, the focus has shifted back to utilization of the self/autologous NK cells by targeting the killer immunoglobulin-like receptor (KIR) antigens on the NK cells. Anti-KIR antibodies have been shown to activate NK-cell killing in preclinical murine models 11. Phase 1 trials with anti-KIR antibodies in patients with AML 35 and plasma cell myeloma 34 have demonstrated safety and provided preliminary data of efficacy. Given the interest in the utilization of the patient's own NK cells as part of the therapy of myeloid neoplasms, this investigation aimed to assess the relative proportions of NK cells and their subsets in these patients, as that might prove to be an important factor in the effectiveness of such therapy and help might provide insight into understanding the possible variability in the response in different patients. We present here retrospective data examining NK and “NK-like T-cells” (CD3 + CD16/57+ and/or CD3+/CD56+ T-cells) based on available surface markers examined at the time of diagnosis in bone marrow samples from patients with AML and MDS. Admittedly, these data are limited by their very nature and do not permit examination of other potentially interesting subsets such as CTLγδ and iNKT cells; peripheral blood values were not available. However, we believe it still provides valuable observations regarding the relative proportions of the subsets studied (relative to samples uninvolved by tumor) and their potential impact on overall response to therapy.
Currently, there is limited data available regarding the proportion of NK cells in normal bone marrow [2.7–4.8% 44 in cardiac patients, 6–10% 45 in normal paid donors]. The control bone marrows studied here had a higher median percentage and range of NK cells, which may in part be due to the fact that the bone marrows in this study were from patients with malignant neoplasms at some other site. This is a potential limitation in the comparisons with “normal” bone marrows reported here. Although we have previously demonstrated that different types of B-cell lymphomas may have different numbers of reactive NK and NK-like T-cells 16, data regarding whether or not negative marrows from patients with lymphoma or neoplasms at other sites have increased numbers of NK cells or NK-like T-cells relative to marrows from normal healthy donors is not available to the best of our knowledge.
The median percentage of NK cells (relative to the total lymphocytes) in AML was lower as compared to that seen in controls. Although there have been functional studies demonstrating impaired NK cell function and cytokine production in AML 19, 26, 46, that reverses after complete remission 27, these do not address the absolute/relative numbers of NK cells or their subsets and the results have not been correlated with survival. NK cells are phenotypically and functionally heterogeneous with less mature NK-cells (CD56brightCD16 negative) characterized by low KIR receptor expression and poor cytotoxic ability and more mature NK cells (CD56dimCD16positive) with a higher expression of KIR receptors being responsible for most of the natural cytotoxicity and antibody dependent cellular cytotoxicity 7, 32, 47. Hence an alteration in the relative proportion of individual subsets may modify the immune environment and ability to kill tumor cells. Here, the NK cells in AML included a relatively lower proportion of the mature NK cells. Although AML with poor prognostic features had the highest percentage of NK cells, the relative proportion of mature NK cells was reduced. This suggests a complex interplay between the varied types of immune effector cells and the neoplastic myeloid cells that cannot be further dissected from this study. In addition, the impact of the varied treatment protocols used for the patients studied cannot be assessed.
The median percentage of NK cells did not significantly differ between marrows with MDS compared to the negative controls or AML. These findings are similar to reported peripheral blood findings where the peripheral NK cell population was quantitatively normal in patients with MDS compared to normal donors 31. In spite of similar proportions, however, the cytolytic function and proliferative capacities of NK cells were altered in response to activation by cytokines in the MDS patients 31. In addition, our study did not demonstrate significant differences in the proportion of NK cells among different MDS categories based on IPSS-R score and did not predict survival in MDS. In contrast, Yokose et al. 21, reported decreased absolute numbers of CD3–CD16+ and CD3–CD56+ cells in peripheral blood, reduced lymphocyte cytotoxicity and increased plasma level of sIL-2R in patients with high-risk MDS group compared to low risk-MDS group. Of note, these results did not correlate with the hemoglobin value, white blood cell count, platelet count or the bone marrow blast count, all of which are criteria currently used for the IPSS-R scoring system 39. Epling-Burnette et al. 22 also demonstrated reduced NK cell activity in MDS patients as compared to normal which was significantly associated with higher international prognostic score, abnormal karyotype, excess blasts and age adjusted bone marrow hypercellularity 22, 36. We did demonstrate that the relative percentage of mature NK cell subset was lower in MDS compared to negative control bone marrows and a low proportion of mature NK cell subset correlated with worse survival in MDS. This could, in part, explain the reduced cytotoxic function of the NK cells observed in various myeloid neoplasms as mature NK cells are responsible for the majority of cytotoxic function of NK cells. 7, 40 Mature NK cells have been shown to be significantly reduced in patients with other myeloid neoplasms as well, such as in CML 30. However, many of the above studies have examined NK cells and/or NK-like T-cell populations in peripheral blood or have focussed on functional assays of in vitro cytotoxic activity, whereas our study directly examined the percentages obtained from bone marrow samples that would not necessarily be equivalent.
NK-like T cells are cytotoxic T-cells that co-express NK receptors such as CD56, CD16, and/or CD57. They are involved in cytotoxic killing and, like NK cells, are not restricted by MHC recognition 12. Although, we defined NK-like T cells as T cells with expression of CD16/57 and/or CD56, which would include some CD4+, CD57+ T follicular helper cells, given that the evaluation was performed on bone marrow specimens, this population would not be expected to be very numerous. NK-like T cells have been studied in various malignancies and their role in therapy evaluated 12, 37, 48, 49. One specific subset of NK-like T-cells, so called invariant NKT cells (iNKT), that recognize glycolipid antigens presented by major histocompatibility class I-like C1d molecules has been examined in AML specifically, with lower counts (<0.2 cells per microliter) in peripheral blood correlating with adverse clinical outcome 50. In mouse studies, increased numbers of these cells appear to have a role in the suppression of a variety of solid tumors, including micrometastases 37. Our study could not specifically examine iNKT cells due to the available antigens for analysis on routine clinical evaluations. However, it is of interest that a lower percentage of NK-like T-cells correlated with worse survival in AML, although not in MDS.
In conclusion, the proportions of NK cells, NK subsets, and NK-like T cells in the bone marrow vary in different types of myeloid neoplasms and, in some circumstances, their relative numbers at diagnosis may correlate with prognosis. These results could potentially be of interest vis-à-vis therapies that seek to modify or enhance innate immunity.


