Real-Time Monitoring of Bacteria Clearance From Blood in a Murine Model
Abstract
Bloodstream infections, especially those that are antibiotic resistant, pose a significant challenge to health care leading to increased hospitalization time and patient mortality. There are different facets to this problem that make these diseases difficult to treat, such as the difficulty to detect bacteria in the blood and the poorly understood mechanism of bacterial invasion into and out of the circulatory system. However, little progress has been made in developing techniques to study bacteria dynamics in the bloodstream. Here, we present a new approach using an in vivo flow cytometry platform for real-time, noninvasive, label-free, and quantitative monitoring of the lifespan of green fluorescent protein-expressing Staphylococcus aureus and Pseudomonas aeruginosa in a murine model. We report a relatively fast average rate of clearance for S. aureus (k = 0.37 ± 0.09 min−1, half-life ~1.9 min) and a slower rate for P. aeruginosa (k = 0.07 ± 0.02 min−1, half-life ~9.6 min). We also observed what appears to be two stages of clearance for S. aureus, while P. aeruginosa appeared only to have a single stage of clearance. Our results demonstrate that an advanced research tool can be used for studying the dynamics of bacteria cells directly in the bloodstream, providing insight into the progression of infectious diseases in circulation. © 2019 International Society for Advancement of Cytometry
Bacteremia, or the presence of viable bacteria in the bloodstream, poses a significant problem in health-care today 1-6. Approximately 600,000 cases of bloodstream infections are diagnosed annually, resulting in around 80,000 deaths in the United States alone 3. Staphylococcus aureus-associated bacteremia (SAB) is one of the most prevalent forms of bloodstream infections that can lead to serious complications such as metastatic infections and infective endocarditis 7, 8. The 30-day all-cause mortality rate of SAB has been reported at approximately 20% 9, 10. Further complications for managing SAB arise from the rise in antibody resistant strains, such as methicillin resistant S. aureus (MRSA), which limits current treatment methods 11, 12. Similarly, Pseudomonas aeruginosa, a gram-negative pathogen, is also a leading cause of nosocomial bacteremia (PAB) in the United States 8, 13, 14. S. aureus and P. aeruginosa are both ESKAPE pathogens, a group of microbes (Enterococcus faecium, Staphylococcus aureus, Klebsiella pneumoniae, Acinetobacter baumannii, Pseudomonas aeruginosa, and Enterobacter species) highlighted by the Infectious Disease Society of America as particularly dangerous pathogens in health care due to the increase in prevalence of multidrug resistant strains 5, 15-17. Better diagnosis and understanding of SAB and PAB are needed to improve our methods for treating this disease and preventing relapse and further complications 18.
Of particular interest here, the clearance of bacteria from the bloodstream in clinical cases in the literature is poorly defined and bacteremia persistence is not fully understood 7, 9, 18-21. There have been few studies in animal models that monitor the clearance rate of S. aureus from the bloodstream, and the older studies that do describe it use radioactive methods or culture-based methods 22-24. The absence of a bloodstream bacterial clearance rate and its dynamic behavior is perhaps due to the lack of an established method to routinely observe bacteria in the bloodstream in real time. Further, it has been shown that bacteremia can be both caused by and result in metastatic infection sites through the process of hematogenous seeding, increasing the risk of mortality and further disease 20, 21. However, there has been little research done in this area to study the patterns and mechanisms behind this seeding.
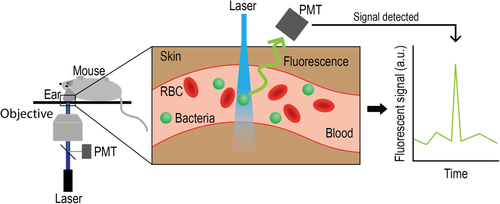
Here, we present a novel approach for real-time noninvasive detection of circulating bacteria cells (CBCs) using in vivo fluorescent flow cytometry (FFC), a platform pioneered by us and other groups to detect circulating tumor cells 25-36. Specifically, we detect circulating GFP-expressing S. aureus and P. aeruginosa cells in a murine model. The principle of using in vivo FFC to detect CBCs is shown in Figure 1. Using this platform, we can detect bacteria cells directly as the cross the laser path that is focused on an artery in the ear, allowing for continuous monitoring and subsequent analysis of the dynamics of CBCs in the blood. To the best of our knowledge, this is the first time a real-time method of monitoring bacteria in the blood has been explored.
Materials and Methods
Bacteria and Mouse Model
To visualize bacteria in the bloodstream, the S. aureus strain UAMS-1 transformed with a plasmid (pCM11) inducing super green fluorescent protein (GFP) production (described elsewhere in Ref. 37) was cultured on tryptic soy agar containing erythromycin antibiotic selection. This bacteria was then cultured overnight tryptic soy broth at 37°C in the presence of erythromycin and subsequently suspended at 107 colony-forming units (CFU) per ml in Phosphate-buffered saline (PBS). GFP-expressing P. aeruginosa was purchased from ATCC (10145GFP) and cultured on tryptic soy agar-containing ampicillin antibiotic selection. Similarly to the S. aureus preparation, the P. aeruginosa culture was then cultured overnight in tryptic soy broth at 37°C in the presence of ampicillin and subsequently suspended at ~107–108 CFU per ml in PBS. A bacteremia model was established by injecting ~1 × 10⁶ to 1 × 10⁷ CFU of GFP-expressing S. aureus or GFP-expressing P. aeruginosa into the tail vein 6–12-week-old female nu/nu nude mice (Charles River). Nu/nu mice have light skin pigmentation of the ear, which allows the Fluorescent Flow Cytometry (FFC) platform to monitor vessels in the ear, whereas other models have the disadvantage of higher background noise due to higher skin pigmentation from melanin 38. The S. aureus or P. aeruginosa was allowed to circulate for 5–120 min depending on the experimental parameters. Mice were anesthetized under isoflurane during the entire procedure and subsequently euthanized following the completion of the procedure, in accordance with an animal use protocol approved by the UAMS Institutional Animal Care and Use Committee.
In Vivo Fluorescent Flow Cytometry
In an effort to detect circulating bacteria cells in the bloodstream of nu/nu mice, we used our custom built in vivo FFC set up, described elsewhere 25, 39. In brief, nu/nu mice are anesthetized using isoflurane and placed on a warmed microscope stage. Mice were anesthetized throughout the entirety of each experiment. The ears of the mice are positioned on a coverslip where a 473 nm laser beam (LaserGlow LRS-0473; laser power on tissues 1–5 mW) is focused by microscope objective into a small ear artery. Laser beam is shaped using cylindrical lenses to form a line across the whole artery. Fluorescence from the ear artery was collected using the same microscope objective, and separated from the incident laser light using a dichroic mirror (FF01-520/15; Semrock Inc., Rochester, NY). Fluorescence intensity was measured by a photomultiplier tube (PMT, R928; Hamamatsu, Co., Bridgewater, NJ). The voltage signal from the PMT was analyzed using PCI-5124 high-speed digitizer (National Instrument, Austin, TX). These signal traces were then analyzed using custom build software (LabView, National Instrument, Austin, TX). At the completion of each experiment, mice were euthanized under anesthesia via cervical dislocation.
Colony Formation Assays
Whole blood was drawn via cardiac puncture under anesthesia at various time points after tail vein injection and placed in heparin containing tubes. The blood was then serial diluted and 10 μL of each dilution was dotted on agar plates and incubated at 37°C overnight. After incubation, places were removed and colonies were counted at dilution factors which had colony counts between 3 and 30 CFU. These counts were then used to calculate the concentration of bacteria that was present in the original blood samples drawn from the mice at various time points.
Results
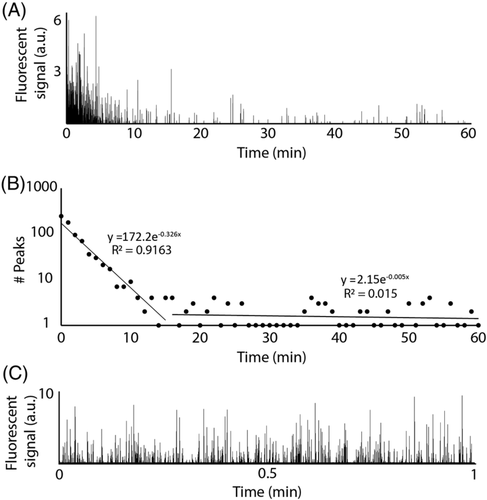
To determine the clearance of S. aureus and P. aeruginosa in the blood of a murine model, a custom in vivo FFC platform was used in this study. Mice were placed on a heated stage and arteries in the ear were located using a 40x objective. A 473 nm continuous wave laser beam was focused across an artery in the mouse ear that allowed for the detection of GFP-expressing bacteria via the fluorescence produced as they crossed the focused laser beam path (Fig. 1). A negative control (i.e., no bacteria injection) was monitored for an hour, and no fluorescent peaks above the established threshold were observed. Figure 2a shows a typical trace produced by in vivo FFC over the course of 1 h for mice injected with approximately 106 colony forming units (CFUs) of S. aureus via the tail vein, setting up a model of SAB, whereas most of the bacteria seems to be cleared from the bloodstream in 10–20 min, there is a clear presence of a few bacterial peaks spaced out over the rest of the hour, suggesting the persistence of S. aureus to remain in the blood at low levels despite clearance mechanisms.
 (1)
(1) (2)
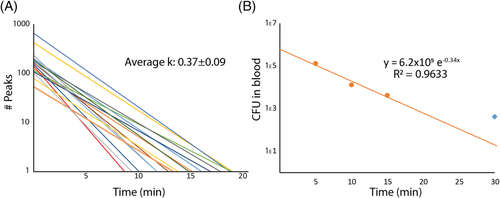
(2)Interestingly, this plot suggests that the clearance of S. aureus from the bloodstream involves a two-stage process. For the first 10–20 min, the clearance follows a steady pattern with a rate constant of k = 0.326 min−1. After this initial phase of clearance, however, there appears to be a second phase of clearing, or even simple persistence, yielding a rate constant of k = 0.005. These phases have been indicated using separate regression lines in Figure 2b, divided at 15 min post injection (pi). This pattern held true over multiple experiments (n > 10) for the model of SAB. The initial phase of clearance was measured for 16 mice injected with the same concentration of bacteria to determine the average clearance rate of S. aureus, which was determined to have an average rate constant of k = 0.37 ± 0.09 min−1 (Fig. 3a). This corresponds to a half-life of approximately 1.9 min in the blood for S. aureus. Figure 2c shows the trace given from running a similar sample through in vitro FFC to verify that the system was showing GFP-expressing S. aureus peaks and that the quantification of such peaks did correspond to actual bacterial concentration determined via optical density at 560 nm (OD560) (1.1 × 10⁵ ± 7.4 × 10³ CFU/ml compared to ~1 × 10⁵ CFU/ml, respectively).
 (3)
(3) (4)
(4) (5)
(5)For further verification that our system is indeed a good approximation for actual bacterial concentration, we performed a colony formation assay on blood taken at different time points from mice that had been injected with S. aureus at the same concentration (~1 × 10⁶ cfu) as those observed using in vivo FFC. For this experiment, four mice were injected with ~106 CFU and sacrificed at different time points (5, 10, 15, and 30 min), after which whole blood was drawn, diluted, and plated for each mouse. Figure 3b shows the results of this assay. Two things were especially evident after plotting this data. First, when a regression line is fit to the first 15 min of the data, the rate constant agrees well with the average rate constant found via in vivo FFC (k = 0.34 min−1 compared to k = 0.37 ± 0.09 min−1, respectively). Second, the 30 min time point deviates from the initial regression line as would be expected in a model of a two-phase clearance, giving further validation of the data found via in vivo FFC (indicated by a blue diamond in Fig. 3b). It should be noted that although there were four mice used in this assay, each point represents just one replicate. However, the slope of the clearance curve agrees well with the slope obtained from the real-time in vivo FFC clearance data, with a hint that the 30 min time point might be diverging from the line as in the two-phase clearance found via in vivo FFC, although there is not enough statistical power in this assay to determine this with confidence. More experiments will be needed to confirm this. The y-intercept of the regression implies an initial injection of ~6.2 × 10⁵ CFU into the blood, which similarly agrees well with the median y-intercept from in vivo FFC (~5.3 × 10⁵ CFU) and is well within the upper and lower limits calculated above. This also suggests that a small portion of the initial injection (~106 CFU) is either lost as a result of injection and/or cleared quickly before or during the first minute of detection.
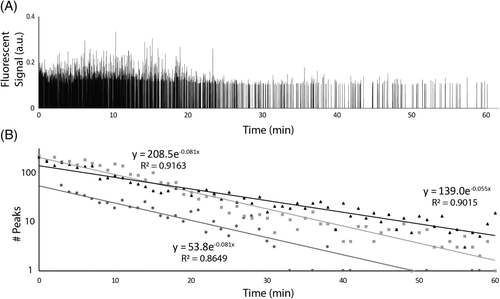
To show the generalizability of our platform and some of the ways in vivo FFC can be used as a versatile research tool, we preformed similar experiments using GFP-expressing P. aeruginosa. Similar to the SAB model, ~1 × 10⁷ CFU P. aeruginosa was injected into mice via the tail vein to establish a PAB model. Figure 4a shows a typical trace detecting P. aeruginosa peaks over the course of an hour. Figure 4b shows a typical regression curve indicating the clearance rate for P. aeruginosa. Note that there only appears to be a single clearance phase in contrast to the S. aureus curves. Figure 4c shows three of these regression curves that yield an average clearance rate with k = 0.07 ± 0.02 min−1, corresponding to a half-life of ~9.6 min in the blood for P. aeruginosa. This clearance rate is significantly lower than that of S. aureus reported earlier (k = 0.37 ± 0.09 min−1, half-life of ~1.9 min). Correspondingly, P. aeruginosa circulated in the bloodstream in higher amounts for much longer than S. aureus. A 2 h experiment detected P. aeruginosa to at least 108 min. This suggests that S. aureus and P. aeruginosa behave much differently in the bloodstream, likely due to differences in virulence factors and structural differences (gram positive vs. gram negative).
Discussion
Here, we demonstrate for the first time real-time, noninvasive, and label-free bacterial clearance in a murine model using in vivo FFC that does not require blood draws, injection of labels, or radioactive isotopes. Both GFP-expressing S. aureus and P. aeruginosa have been used to establish and monitor the clearance rate in of each organism in a bacteremia model. Detection of fluorescent bacteria flowing through a laser path can be used to infer overall blood concentration of bacteria, and clearance regression lines can be used to extrapolate the concentration of bacteria in the blood. It should be noted that the absolute amplitude of the fluorescent peaks is different for the PAB compared to the SAB model due to the different types of GFP that are expressed in each bacterial species.
Crucially, interesting differences can be observed when the clearance of S. aureus, a gram-positive bacterium, is compared to the clearance of P. aeruginosa, a gram-negative bacterium, whereas S. aureus seemed to consistently show a two-phase clearance rate with a relatively fast initial clearance (k = 0.37 ± 0.09 min−1, half-life ~1.9 min), P. aeruginosa experiments indicated a single clearance phase with a much slower clearance rate (k = 0.07 ± 0.02 min−1, half-life ~9.6 min) and thus a longer lifespan in the blood. The two-phase clearance exhibited by S. aureus could be due to exit from and re-entry to the bloodstream by the pathogen, which may be a good model for intermittent bacteremia 40. The different clearance rates observed for S. aureus and P. aeruginosa could be due to the differences between clearance mechanisms used for gram-positive and gram-negative bacteria. Our results that show a faster clearance for the gram-positive bacteria (S. aureus) than the gram-negative bacteria (P. aeruginosa) are consistent with one of the few bacterial clearance studies referenced above which also showed a faster clearance of a gram positive bacteria versus a gram negative bacteria 22. Further, this study also showed that the bulk of S. aureus was cleared within 10–20 min after injection, consistent with our results. Another possible explanation for the different clearance rates for each bacterial species in this study could come from the mouse model itself. One group has shown that different patterns of pro-inflammatory cytokines are induced when human monocytes are challenged with the different types of bacteria. 41 For example, this group showed that gram-negative infections tend to elicit higher IL-8 cytokines, a response that would be diminished in nu/nu mice due to the lack of a thymus in this model, thus leading to a slower clearance rate for P. aeruginosa. 42
Interestingly, the peaks in the P. aeruginosa trace seem to be more uniform in terms of amplitude when compared to the SAB model (compare Fig. 2a). One possible explanation for this phenomenon is the likelihood that some of the SAB peaks could actually be clusters oftwo to three cells, as S. aureus is known to cluster 43. The fact that the higher signal amplitudes occur most often toward the beginning of the injection (i.e., when bacterial concentration would be at a high), gives evidence that higher amplitudes reflect multiple bacteria cells crossing simultaneously through the laser detection zone. If this is true, it is possible that the in vivo FFC could roughly distinguish between single and clustered cells. It is unlikely that this would have a significant effect on the CFU calculations as CFU is not equated to the absolute number of bacterial cells (e.g., a cluster of two to three S. aureus cells would likely still form one CFU). Thus, there is evidence to suggest that our method might give more information about the sample of bacteria than a conventional colony formation assay.
The bulk of S. aureus cells seemed to leave the bloodstream much faster than P. aeruginosa cells; however, S. aureus showed a persistence of peaks after the initial clearance phase. This persistence could be due to seeding organs and tissues with S. aureus and then having some of these cells reenter the bloodstream 44. Since the slope of the second phase of clearance is nearly horizontal, it is possible that an equilibrium is established, at least for a period of time, between seeded tissues and cells circulating in the bloodstream. This effect appears to be less apparent in P. aeruginosa.
It is important to note that the parameters of detecting bacteria cells in a small artery in the ear with a set diameter and velocity place the limit of detection of S. aureus per minute of detection for the in vivo FFC to be ~3.6 × 10³ CFU/ml due to the fact that one peak in 1 min would yield this concentration. This detection limit could be lowered by using a larger and faster artery, such as the carotid artery, which would allow the platform to scan more blood per minute; however, detection at this site would likely involve at least a minimally invasive procedure. We have previously demonstrated the ability to detect malaria in such arteries, suggestion that this adaptation would be possible 39. Another way to improve the detection limit that does not require a new site would be to we allow the detection period to span multiple minutes. In this case, the detection limit would decrease dramatically, even to a point at which we could scan the whole blood volume through one artery, making the limit of detection effectively 1 CFU/entire blood volume.
Overall, we believe that in vivo FFC is a valuable tool for observing and monitoring clearance in SAB and PAB models. This research could be expanded to monitor bacteremia caused by any number of pathogens, supposing that there is a GFP (or other fluorescent protein that is able to be detected) variant of the bacteria. Further, bacteria that are not GFP expressing could be labeled with a fluorescent dye (either by antibody or a cell membrane dye) either prior to injection (ex vivo labeling) or perhaps after injection (in vivo labeling), adding more potential to the platform. Additionally, conjugated nanoparticles that are targeted to the outer membrane proteins of bacteria could be used as contrast agents, as we have explored previously 45. Another suggestion to probe deeper questions of clearance kinetics would be to label white blood cells, such as monocytes or neutrophils, with a secondary fluorescent color (via antibody) and perform two-color FFC to determine whether the detected bacteria are free floating or if they have been phagocytosed, similar to a method we demonstrated for the detection of the malaria parasite in blood plasma or red blood cells 46. in vivo FFC produces valuable information in real time about the presence of bacteria in the blood and can be used to study differences in clearance mechanisms, persistence or even the effects of drugs, such as antibiotics, on the presence or clearance of bacteria in the bloodstream.
Acknowledgments
This work was supported in part by the NIH grant R01CA131164 and the NSF grants OIA 1457888 and DBI 1556068.


