tRF-59:76-Arg-ACG-1-M2 is upregulated during colorectal carcinogenesis and promotes cell proliferation, migration, and invasion
Xiangrong Gao, Hao Bai, Yiming Wang and Zhaohui Zhang contributed equally to this work.
Dear Editor
Colorectal cancer (CRC) ranks third in incidence and second in mortality worldwide as of 2022.1 Although CRC is driven by the accumulation of diverse molecular alterations,2, 3 its underlying mechanisms have not been fully understood. Transfer RNA-derived small RNAs (tsRNAs) participate in diverse physiological and pathological processes by modulating gene expression at both the transcription and post-transcription levels.4, 5 Evidence indicates that dysregulation of tsRNAs is widespread across various human diseases and plays a critical role in cancer development.6-8 Here, we aimed to profile dynamic changes across all stages of colorectal carcinogenesis in human and to elucidate the biological functions of tRF-59:76-Arg-ACG-1-M2 through experiments.
A multi-stage study was conducted, encompassing a discovery stage, two validation stages (I and II), in vitro and in vivo experiments, and bioinformatics analyses (Figure S1). Human plasma samples were obtained from the Jiashan cohort, a population-based cohort of CRC in southeast China.9 We included healthy controls (HC), non-advanced adenoma (NAA), advanced adenoma (AA), and CRC patients between June 2016 and September 2021, matched by age and sex. Follow-up was continued until death or December 31, 2024.
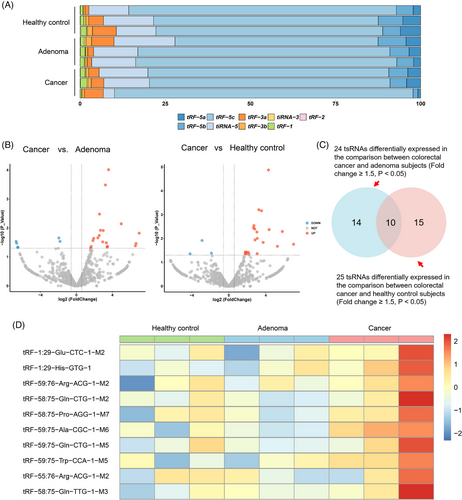
In the discovery stage, small RNA sequencing was performed to profile plasma tsRNA expression and identify differentially expressed tsRNAs (fold change ≥1.50, p < .05) (Table S1). The proportion distribution of subtypes and the number of subtypes mapped to tRNA isodecoders across HC, adenoma and cancer groups are presented in Figure S2. tRF-5c was the most abundant subtype in all samples (Figure 1A). We observed significant differences in the expression of 24 tsRNAs between CRC and adenoma, and of 25 tsRNAs between CRC and HC (Figure 1B). Among them, 10 tsRNAs exhibiting higher levels in the CRC group overlapped (Figure 1C,D; Table S2). These tsRNAs were selected as candidates for further validation. Nevertheless, primers were only available for 8 of them (Table S3).
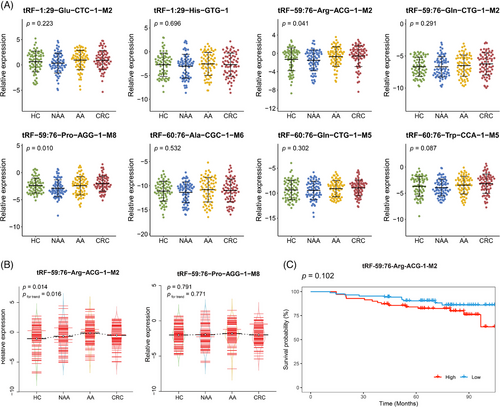
In addition to the examination of candidate tsRNAs expression across different stages of colorectal carcinogenesis, a two-stage qRT-PCR was conducted. The baseline characteristics did not differ significantly across the four groups in both validation stage I and II (p > .05) (Table 1). In validation stage I, the expression levels of the 8 candidate tsRNAs were quantified among 70 HC, 70 NAA, 70 AA and 70 CRC subjects. tRF-59:76-Arg-ACG-1-M2 and tRF-59:76-Pro-AGG-1-M8 showed significant differences in expression levels across the four groups (p < .05), while the remaining six did not (Figure 2A). The expression levels of these two tsRNAs were further measured in the validation stage II using a larger independent sub-cohort, consisting of 87 HC, 87 NAA, 87 AA and 87 CRC subjects. As illustrated in Figure 2B, the significantly differential expression was confirmed only for tRF-59:76-Arg-ACG-1-M2 (p < .05). Furthermore, its expression level progressively increased from HC to NAA, to AA, and then followed by a very slight decrease in CRC (still higher than NAA, pfor trend < .05). To assess the prognostic value of tRF-59:76-Arg-ACG-1-M2, Kaplan–Meier survival analysis was performed among 157 CRC patients pooled from both validation stages. Although patients with higher expression levels of tRF-59:76-Arg-ACG-1-M2 tended to have worse overall survival, the difference was not statistically significant (log-rank p = .102) (Figure 2C).
| Index | Validation stage I | Validation stage Ⅱ | ||||||||
|---|---|---|---|---|---|---|---|---|---|---|
|
HC (n = 70) |
NAA (n = 70) |
AA (n = 70) |
CRC (n = 70) |
p-value |
HC (n = 87) |
NAA (n = 87) |
AA (n = 87) |
CRC (n = 87) |
p-value | |
| Age, year, mean (SD) | 62.24 ± 6.71 | 62.41 ± 6.77 | 62.30 ± 6.85 | 62.54 ± 7.04 | .994 | 62.32 ± 7.87 | 62.61 ± 7.85 | 62.10 ± 7.88 | 63.34 ± 8.11 | .749 |
| Sex, n (%) | 1.000 | 1.000 | ||||||||
| Male | 35 (50.00) | 35 (50.00) | 35 (50.00) | 35 (50.00) | 54 (62.07) | 54 (62.07) | 54 (62.07) | 54 (62.07) | ||
| Female | 35 (50.00) | 35 (50.00) | 35 (50.00) | 35 (50.00) | 33 (37.93) | 33 (37.93) | 33 (37.93) | 33 (37.93) | ||
| Body mass index, n (%) | .751 | .457 | ||||||||
| <18.5 kg/m2 | 4 (5.71) | 3 (4.29) | 3 (4.29) | 3 (4.29) | 6 (6.90) | 3 (3.45) | 3 (3.45) | 2 (2.30) | ||
| 18.5 to <24 kg/m2 | 43 (61.43) | 38 (54.29) | 46 (65.71) | 39 (55.71) | 51 (58.62) | 52 (59.77) | 42 (48.28) | 43 (49.43) | ||
| 24 to <28 kg/m2 | 22 (31.43) | 25 (35.71) | 17 (24.29) | 22 (31.43) | 22 (25.29) | 29 (33.33) | 33 (37.93) | 33 (37.93) | ||
| ≥28 kg/m2 | 1 (1.43) | 3 (4.29) | 4 (5.71) | 4 (5.71) | 8 (9.20) | 3 (3.45) | 8 (9.20) | 8 (9.20) | ||
| Middle school and above education level, n (%) | 27 (38.57) | 26 (37.14) | 19 (27.14) | 21 (30.00) | .162 | 35 (40.23) | 35 (40.23) | 24 (27.59) | 33 (37.93) | .377 |
| Current married, n (%) | 67 (95.71) | 65 (92.86) | 61 (87.14) | 65 (92.86) | .290 | 78 (89.66) | 86 (98.85) | 79 (90.80) | 78 (89.66) | .066 |
| Current smokers, n (%) | 20 (28.57) | 24 (34.29) | 26 (37.14) | 27 (38.57) | .612 | 27 (31.03) | 33 (37.93) | 40 (45.98) | 29 (33.33) | .182 |
| Current drinkers, n (%) | 17 (24.29) | 16 (22.86) | 21 (30.00) | 17 (24.29) | .774 | 26 (29.89) | 22 (25.29) | 31 (35.63) | 26 (29.89) | .527 |
| Regular physical activity, n (%) | 7 (10.00) | 14 (20.00) | 11 (15.71) | 4 (5.71) | .106 | 18 (20.69) | 12 (13.79) | 15 (17.24) | 26 (29.89) | .053 |
| Family history of CRC | 7 (10.00) | 10 (14.29) | 4 (5.71) | 7 (10.00) | .414 | 13 (14.94) | 17 (19.54) | 9 (10.34) | 8 (9.20) | .172 |
| Regular aspirin use | 0 (0.00) | 3 (4.29) | 1 (1.43) | 1 (1.43) | .276 | 8 (9.20) | 3 (3.45) | 3 (3.45) | 6 (6.90) | .282 |
- Abbreviations: AA, advanced adenoma; CRC, colorectal cancer; HC, healthy control; NAA, non-advanced adenoma.
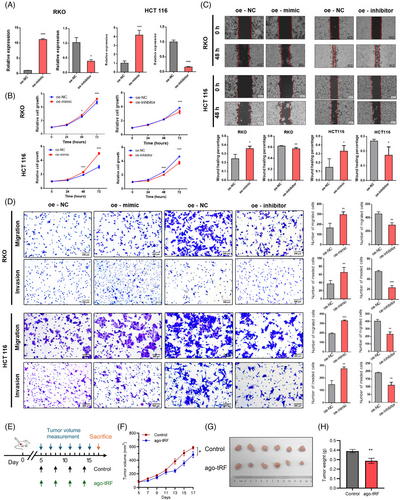
Then, we further explored the functional role of tRF-59:76-Arg-ACG-1-M2 through cell experiments. The transfection efficiency of its mimic and inhibitor was confirmed in RKO and HCT116 cells (Figure 3A). The CCK8 assay revealed that the mimic significantly enhanced cell proliferation, whereas the inhibitor suppressed it (Figure 3B). Wound healing and transwell assays demonstrated that the mimic promoted cell migration, while the inhibitor reduced it (Figure 3C,D). Additionally, the transwell assay with Matrigel showed that the overexpression of tRF-59:76-Arg-ACG-1-M2 increased CRC cell invasion, whereas its downregulation inhibited invasion (Figure 3D). Taken together, these results demonstrated that tRF-59:76-Arg-ACG-1-M2 promotes colorectal carcinogenesis. To further validate its in vivo function, we performed animal experiments using a xenograft model. HCT116 cells were injected subcutaneously into BALB/c nude mice, and after 5 days, mice were randomized to receive intratumoral injections of tRF-59:76-Arg-ACG-1-M2 antagomir to inhibit its expression or phosphate-buffered saline (PBS) as control (Figure 3E). In the antagomir-treated group compared with controls, significantly slower subcutaneous tumour growth and notably reduced tumour weight after 2 weeks were observed (Figure 3F–H), and a significant decrease in the proportion of Ki-67-positive cells was found by subsequent immunohistochemistry (IHC) staining on the subcutaneous tumours (Figure S3). These findings demonstrate that inhibiting tRF-59:76-Arg-ACG-1-M2 suppresses CRC tumour growth in vivo.
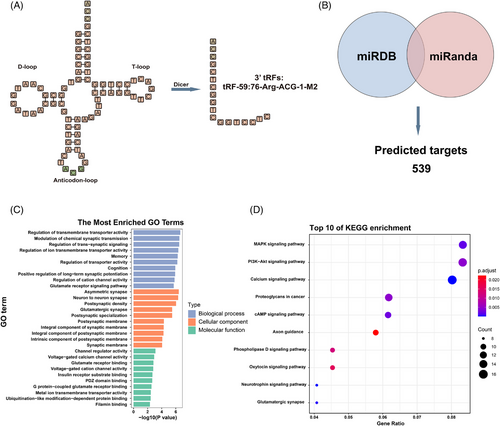
Secondary structure modelling classified tRF-59:76-Arg-ACG-1-M2 as a tRF-3a type generated by cleavage of tRNA-Arg-ACG-1 (Figure 4A). A total of 539 overlapping target genes were identified through the prediction by miRDB and miRanda (Figure 4B). Gene Ontology (GO) analysis highlighted roles in the regulation of transmembrane transporter activity, asymmetric synapses, and channel regulator activity (Figure 4C). Kyoto Encyclopedia of Genes and Genomes (KEGG) pathway enrichment analysis implicated MAPK, PI3K-Akt, and calcium signalling pathways (Figure 4D). These findings suggest that tRF-59:76-Arg-ACG-1-M2 may play a crucial role in CRC development and progression.
In conclusion, this study identified that tRF-59:76-Arg-ACG-1-M2 has an increasing pattern across all stages of colorectal carcinogenesis. Functional assays revealed its role in promoting cell proliferation, migration, and invasion, and bioinformatics tools also validated its involvement in CRC development and progression. These results suggest that tRF-59:76-Arg-ACG-1-M2 holds great potential as a biomarker for CRC diagnosis and prognosis and deserves further investigation.
AUTHOR CONTRIBUTIONS
Mingjuan Jin conceived and designed the study. Xiangrong Gao and Hao Bai performed the experiments with human samples, analyzed the data, and drafted the manuscript. Zhaohui Zhang performed the cell experiments. Tingting Lin and Yiming Wang conducted the animal experiments. Hao Fu, Jianhao Xu, Xinglin Fei, Jinhua Yang, Xiaojiang Ying, and Lihua Zhang recruited the study participants and collected the samples. Xiangrong Gao and Hao Bai drafted the manuscript under the supervision of Mingjuan Jin and Jinghao Sheng. Kun Chen, Mengling Tang, and Jianbing Wang revised the manuscript critically. All authors read and approved the final manuscript.
ACKNOWLEDGEMENTS
This study was supported by the National Natural Science Foundation of China (81973124, 82373652).
CONFLICT OF INTEREST STATEMENT
The authors declare no conflict of interest.
ETHICS STATEMENT
This study was approved by the ethics committee of Zhejiang University School of Medicine (Hangzhou, China). Written informed consent was obtained from all participants, and data were analyzed anonymously. All animal experimental procedures and protocols were approved by the Medical Experimental Animal Care Commission of Zhejiang University.
Open Research
DATA AVAILABILITY STATEMENT
The datasets used during the current study are available from the corresponding author upon reasonable request.


