Coordinate Network Mapping of Focal Brain Volume Differences in ADHD Reveals Common Patterns That Lack Specificity: A Systematic Review
ABSTRACT
Objective
Attention-deficit/hyperactivity disorder (ADHD) has been associated with decreased regional brain volume, yet no consistent localization has emerged across studies. This discrepancy has been attributed to ADHD's diagnostic heterogeneity; however, one alternative is that ADHD is associated with alterations of brain networks, not individual regions. To test this hypothesis, we compared a traditional anatomic likelihood estimate (ALE) with a “coordinate network mapping” (CNM) approach using data from 38 studies comparing regional brain volumes in ADHD versus healthy controls.
Methods
We performed an ALE analysis, determining above-chance convergence between experiments. Next, we calculated the overlap with the putamen and default mode network, defined a priori. We then applied CNM, generating connectivity maps for each study and statistically comparing these maps to identify common areas of connectivity across studies. Finally, we compared the network map of ADHD with several control groups of neuropsychiatric disorders and with randomly generated coordinates.
Results
ALE identified no significant spatial convergence between experiments. We also found only limited spatial overlap with the default mode network and weak functional connectivity with the putamen. Conversely, CNM revealed that the heterogenous coordinates fell within a consistent brain network characterized by connectivity with the reward and cingulo-opercular “action mode” networks. However, we could not differentiate this network from the CNM-derived networks in control groups.
Interpretation
Although this network is biologically plausible and consistent with ADHD symptoms, the findings suggest that this network is not specific to ADHD and may reflect large-scale brain networks. Although this meta-analysis adds to the literature on the neurobiology of ADHD, the nonspecific findings convey the importance of studying ADHD at the symptom level.
1 Introduction
Attention-deficit/hyperactivity disorder (ADHD) is a common neurodevelopmental disorder with a worldwide prevalence of approximately 7.2% in children and 2.5% in adults [1]. Despite its prevalence, the neuroanatomical basis of ADHD remains less clear [2] than that of other neuropsychiatric conditions such as depression [3, 4] or schizophrenia [5]. Many studies have identified brain regions with decreased brain volume or cortical thickness in ADHD compared with typically developing cohorts, including the anterior cingulate cortex [6], supplementary motor cortex [7], prefrontal cortex [6, 7], regions in the basal ganglia [7], amygdala [7], hippocampus [7], corpus callosum [7], thalamus [6, 7], and cerebellum [7]. However, these regions are inconsistently reported across studies and have not been demonstrated to be specific to ADHD.
Several meta-analyses have sought to identify consistent results from this disparate literature with minimal success. Most employ a neuroimaging meta-analytic technique called activation or anatomic likelihood estimate (ALE), which examines the spatial convergence of coordinates identified from individual clusters/regions [8]. The largest meta-analysis to date used ALE to analyze data from 96 structural (n = 22) and functional (n = 74) magnetic resonance imaging (MRI) studies on ADHD [9]. Using rigid guidelines, this study found no structural differences and a single task-based activation cluster in the left pallidum/putamen in participants with ADHD (n = 68) versus controls. While specific alteration of the putamen may be a factor in ADHD, the heterogeneity of ADHD presentation and the literature to date implies likely involvement of a more complex set of regions. Interestingly, in prior studies of ADHD, the putamen has also been found to be anti-correlated with the default mode network (DMN) [10], which has exhibited atypical connectivity in this population [11]. These findings raise the possibility that connectivity patterns involving the putamen and/or the DMN are a convergent finding that may provide a more complete understanding of ADHD-related brain alterations.
Many of these prior studies and meta-analyses have primarily focused on identifying consistent localized differences in brain activity or volume between ADHD and controls, based on the hypothesis that symptoms of ADHD originate from specific regions. However, an alternative hypothesis is that similar symptoms may arise from disruptions across distributed networks rather than isolated locations, for which a traditional mass univariate approach is not ideal. Therefore, in light of the inconsistent localization of specific regions in the ADHD literature, adopting a network-based approach is a reasonable and rational “next step” approach to identify convergence across the literature. One such method is a meta-analytic technique called coordinate network mapping (CNM) [12]. CNM is derived from lesion network mapping, which uses resting-state functional connectivity to identify networks associated with symptoms linked to specific brain lesions [3, 12-20]. Although lesions may occur in separate brain regions across patients with similar symptoms, they often localize to a specific network. CNM generalizes this method to identify common networks that are functionally connected to a reported set of coordinates representing differences in volume or blood oxygenation–level dependent (BOLD) activity across studies. Unlike ALE analyses, which focus on spatial convergence at individual locations, CNM evaluates spatial convergence at the network level, that is, how functionally connected networks might underpin a disorder, even when specific regions are inconsistently implicated across specific studies. For disorders like ADHD, differences in methodology and task paradigms can make comparing task-based fMRI studies difficult. However, voxel-based morphometry studies, which measure brain volume and cortical thickness, are well suited for meta-analyses like CNM. Importantly, control analyses, such as in non-ADHD cohorts, are critical to ensuring that the observed connectivity patterns are specific to ADHD and do not represent general features of brain connectivity or artifacts of the methodology. Also of note, we use the term “decreased brain volume” as we cannot distinguish regions that are underdeveloped versus those that were of normal size at some point and then atrophied over time, either prior or subsequent to symptom onset.
Here, we first adopt a data-driven ALE approach to meta-analytically determine whether there is spatial convergence across regions currently reported in the ADHD volumetric analysis literature. Given the lack of significant findings in previous ALE studies, we predict that no specific regions will show localized spatial convergence among the current data. Next, we test the a priori hypothesis that connectivity to the putamen and/or DMN will demonstrate increased concordance in the neuroimaging literature of ADHD-related volume loss. Finally, we test whether there is a common brain network affected by volume loss in ADHD using a data-driven CNM approach. We hypothesize that there will be a consistent pattern of volume reduction that is specific to ADHD, and that this pattern will appear across studies more reliably than expected by chance.
2 Methods
2.1 Literature Search and Coordinate Extraction
Following the Preferred Reporting Items for Systematic Reviews and Meta-Analyses (PRISMA) protocols [21], we searched PubMed for articles using structural MRI to study children and adults with ADHD using the following search terms: (ADHD OR attention-deficit hyperactivity disorder) AND (“magnetic resonance imaging” OR MRI OR “voxel-based morphometry” OR VBM). As of our search date, March 24, 2022, there were 2315 results. We excluded papers that were review articles, that focused solely on specific regions of interest rather than whole-brain analyses, that contained overlapping participant groups (prioritizing the larger sample or, if equal, the more recent paper), or that included participants with comorbidities beyond those common in ADHD (i.e., oppositional defiant disorder, conduct disorder, depression, anxiety, and learning disorders). Medication status was not an exclusion criterion. Inclusion required an ADHD diagnosis based on Diagnostic and Statistical Manual of Mental Disorders (DSM) or International Classification of Diseases (ICD) criteria. Furthermore, included studies reported coordinates of decreased volume in ADHD compared with controls, and not locations of increased volume nor differences in functional MRI (fMRI) activation or functional connectivity differences. Reference lists were reviewed for additional studies, and authors were contacted for coordinates not listed in papers matching our criteria. In total, we identified 38 studies with a total of 40 comparisons. Extracted coordinate sets were converted to Montreal Neurological Institute's 152 brain template (MNI152) space when necessary.
2.2 Anatomic Likelihood Estimate
We then conducted a spatial meta-analysis of the coordinates obtained above using the ALE method, which was first described [22] to assess for convergence across fMRI studies but which has also proven highly useful for structural meta-analyses. We performed an ALE analysis using the GingerALE software [8, 23, 24], as described in Samea et al. 2019 [9]. In short, the ALE method measures the spatial convergence across studies by generating a Gaussian sphere around each reported coordinate and then statistically assessing whether any locations within the overall group are reported more often than by chance. We performed analyses with a cluster-level familywise error rate of p < 0.05 and a cluster-forming voxel-level threshold of p < 0.001. Sample sizes were used to weight each comparison in the analysis in a random-effects model.
2.3 Comparison With Putamen and Default Mode Network
Association maps for the putamen and DMN were obtained from Neurosynth [25] and thresholded based on relative image intensity. We then calculated the overlap between these regions of interest and the 40 maps of locations with decreased volume from ADHD versus control studies to determine how often the putamen and DMN were reported as atrophied in these studies. Separately, we calculated the functional connectivity of the putamen, DMN, and data-driven ADHD network with each of the 40 studies’ patterns of decreased volume using the Adolescent Brain and Cognitive Development (ABCD) study data described below. After conversion to Fisher's z values, we conducted one-sample t tests to determine if correlations between ADHD-related patterns of decreased volume and the putamen, DMN, or our derived ADHD network were significant. Note that whether the 40 studies’ patterns are correlated with our derived network is a circular analysis but was done here to compare against the putamen and DMN values—a comparison that is not circular. Additionally, we conducted a one-way ANOVA with follow-up two-sample t tests to determine how the correlations of the 40 seed maps with each of these three regions of interest compared with one another.
2.4 Coordinate Network Mapping
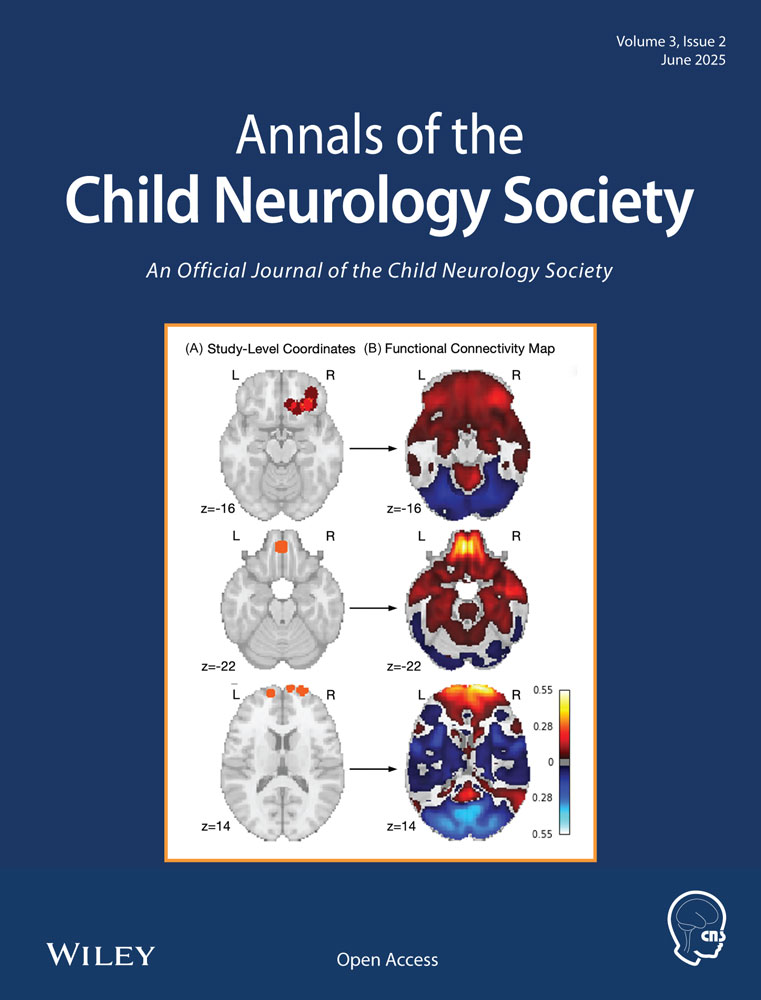
Next, we built on the ALE analysis with a CNM approach, which considers the connectivity of each study's set of coordinates by leveraging the availability of large-scale functional connectivity data sets of typically developing individuals [26, 27] (Figure 1). These functional connectivity data create the ability to generate normative connectivity maps for a set of brain coordinates, even when those coordinates are taken from clinical populations for which fMRI data are not available [13, 28]. Starting with the same set of coordinates used for the ALE analysis, 40 seed maps were created, modeling each set of coordinates as spheres with a radius of 4 mm. These seed maps were subsequently used to create functional connectivity maps representing normative resting-state connectivity between each sphere location and the rest of the brain. This was accomplished using a pediatric normative connectome, that is, a set of preprocessed resting-state fMRI time courses from 1000 typically developing adolescents from the ABCD study, chosen for low-motion, 1:1 male:female proportions, and all from Siemens scanners, as previously described [28]. Next, we conducted a voxel-wise one-sample t test via permutation testing using the FSL Permutation Analysis of Linear Models (PALM) software with 1000 permutations [29]. The resulting t map was then thresholded with familywise error (FWE) correction (p < 0.05).

2.5 Comparison With Acute Lesions
We conducted further permutation-based two-sample t tests (using PALM software) to compare the results of our ADHD analysis with lesion networks from four independent control data sets. In each data set, MNI coordinates were reported for regions with decreased volume in participants with the disorder(s) of interest than in control participants. The first data set came from a previous ALE meta-analysis of 193 voxel-based morphometry studies reporting decreased volume in psychiatric disorders: schizophrenia, bipolar disorder, depression, substance use disorder, obsessive-compulsive disorder, and anxiety disorders [30]. The second data set was derived from 72 published neuroimaging studies of neurodegenerative disorders (Alzheimer's disease, behavioral variant frontotemporal dementia, corticobasal syndrome, and progressive nonfluent aphasia) [16]. The third data set came from a meta-analysis of 159 studies of neurodegenerative disorders, namely mild cognitive impairment, Alzheimer's disease, Parkinson's disease, and Huntington's disease [31]. The final data set included 135 lesions from patients who were part of the Washington University Stroke Project [32].
2.6 Control Comparison With Random Decreased Volume/Atrophy Studies
To assess the specificity of our results to ADHD, we conducted additional permutation-based two-sample t tests to compare our identified set of coordinates with a separate and random sample (n = 160 studies) of volume decrease coordinates from the BrainMap database, which includes a range of studies on typically and atypically developing populations [33]. Using these new studies, we replicated the CNM approach and constructed a map of commonly affected networks. We computed the spatial correlation between regions of volume decrease in ADHD and in these other studies.
2.7 Control Comparison With Random Coordinates
Finally, using a binary gray matter mask, we randomly generated 236 coordinates split into 40 groups, matching the number of ADHD coordinates. Using these new seed regions, we replicated the CNM approach and constructed a map of commonly affected networks. We then compared this map with the ADHD map using permutation-based two-sample t tests. Finally, we computed spatial correlations between regions of significance from the random analysis and the ADHD analysis.
3 Results
3.1 Participant Demographics
Our literature search identified 38 studies (Figure 2), including 40 experiments, that directly compared voxel-wise brain volumes, for example, voxel-based morphometry [34], of people with ADHD and typically developing controls. These results represent data from 2952 participants (Table 1). The median age of participants at the time of study was 12.63 years, and the ratio of males to females was 2002:950, consistent with observed M:F ratios of ADHD diagnosis [1]. Due to strict inclusion and exclusion criteria across these studies, few participants were included with comorbidities; however, some participants with comorbidities common to ADHD were included in some studies. These included anxiety (3.5% of the ADHD group and 0.9% of the control group) and oppositional defiant disorder (3.2% of the ADHD group and 0.15% of the control group). Additionally, some participants were medicated, while others were medication naïve. Table 1 contains a detailed breakdown of participant demographics.

| ADHD | Control | Total | |
|---|---|---|---|
| Participants, n | 1619 | 1333 | 2952 |
| Male, sex, n (%) | 1132 (69.92) | 870 (65.23) | 2002 (67.82) |
| Median age at scan, years (IQR) | 12.63 (13.53) | 13.20 (12.68) | 12.8 (13.16) |
| Adults, n (%) | 604 (37.31) | 529 (39.68) | 1133 (38.38) |
| Children, n (%) | 1015 (62.69) | 804 (60.32) | 1819 (61.62) |
| Comorbid disorders, n (%) | 186 (11.49) | 39 (2.93) | 225 (7.62) |
| Medication-naïve | 449 (27.73) | N/A | N/A |
| Medication status not reported | 428 (26.44) | N/A | N/A |
- Abbreviations: ADHD, attention-deficit/hyperactivity disorder; IQR, interquartile range; N/A, not available.
3.2 Association With the Default Mode Network and Putamen
To test the hypotheses presented by the existing ADHD literature, we assessed whether the significant coordinates for each of the identified ADHD experiments were near or connected to a priori putamen and DMN maps obtained from Neurosynth [25]. The putamen was chosen as an a priori region because it was the only region implicated in ADHD in the Samea et al. meta-analysis [9], and the DMN was chosen as an a priori network because it has been the most consistently implicated in ADHD [35]. Coordinates from 14 of the 40 experiments (35%) had an overlap of at least 1% of the voxels in the putamen and/or DMN masks. Only five (12.5%) had an overlap of at least 5% with either mask, and only two (5%) had a 20% overlap with the putamen mask (no experiments reached this threshold for the DMN mask). While the regions obtained from the 40 independent experiments had a significant functional connection with the putamen (r = 0.141, t = 4.316, p = 0.0001), this correlation was weak and explained only 1.99% of the variance. There was no significant correlation between these regions and the DMN (r = 0.061, t = 1.513, p = 0.138).
3.3 Data-Driven Meta-Analysis Using Anatomic Likelihood Estimate
We then performed an ALE meta-analysis to identify the spatial convergence of regions reported across experiments. The original coordinates occurred in widespread regions across the brain (Figure 3), and ALE analysis yielded no significant clusters. Visual inspection indicates bilateral patterns of decreased volume across a range of cortical and subcortical structures.

3.4 Data-Driven Meta-Analysis Using Coordinate Network Mapping
Next, we examined the overlap among normative functional connectivity maps from each experiment and found that the regions from 85% of the studies were connected to the right anterior cingulate cortex (ACC) and right thalamus at t > 5 (corresponding FWE-corrected p < 0.05), although these regions were extremely small, comprising four voxels total (Supporting Information S1: Figure 1). Relaxing our inclusion threshold to 80% of studies demonstrating a connection, t > 5 identified connections to 400 voxels in the ACC and several subcortical regions (Supporting Information S1: Table 1). To remove the potential impact of choosing thresholds, we also used normative functional connectivity maps for each experiment to perform a permutation-based one-sample t test of the experiment-level ADHD versus control contrasts, in effect performing a fixed-effects ANOVA of the set of studies [29]. This identified 13 clusters with greater positive connectivity to ADHD patterns compared with typically developing cohorts. After eliminating clusters smaller than 200 cubic mm in volume [18], seven significant clusters remained, with the largest cluster (67704 cubic mm) having peaks in the left and right thalamus, bilateral accumbens, hippocampus, caudate, pallidum, and insular cortex, and to the subcallosal cortex, paracingulate gyrus, ACC, orbitofrontal cortex, cerebellum, and brainstem (Supporting Information S1: Table 1; Figure 4A). There were also connections to locations within the cerebral white matter.

3.5 Comparison to Known Brain Networks and A Priori ADHD Results
Visually, these regions appear to localize to two well-established, previously described networks: the reward network, traditionally consisting of the ventral tegmental area/ventral striatum, ACC, orbital and medial prefrontal cortices, amygdala, and dopaminergic midbrain [36] (Figure 4B); and the cingulo-opercular network, recently renamed as the action mode network [37], comprising the dorsal ACC/medial superior frontal cortex and the anterior insula/frontal operculum [38] (Figure 4C). As further verification for these visual findings, we processed our map through the Neurosynth Decoder [25], which compares any neuroimaging map with the entire database of Neurosynth meta-analyses. This analysis found that the maximum correlation between our CNM map, showing decreased volume in ADHD, and any term in the database was 0.324. The correlation with the term “reward” was 0.288. There is no singular term for the cingulo-opercular/action mode network (AMN) in Neurosynth, but correlations for regions within this network ranged from r = 0.054 (frontal operculum) to 0.239 (anterior cingulate). Purely for the sake of comparison, we also calculated the connectivity of 1) our identified network, 2) the previously mentioned putamen region of interest, and 3) the DMN mask to each of the 40 experimental regions. As expected, an ANOVA of these three groups was significant (F(2,117) = 3.285, p = 0.041) and post hoc two-sample t tests demonstrate that the CNM-derived ADHD network was more strongly correlated to the 40 originating regions than the putamen (t = 1.051) or DMN (t = 2.535). Please note that this is a circular analysis and is included purely for comparison with the results summarized above.
3.6 Control Experiment 1: ADHD Study-Related Networks of Decreased Volume Versus Networks of Decreased Volume in Previously Characterized Clinical Cohorts
3.6.1 Psychiatric Disorders
Since attentional difficulties are common in psychiatric disorders [39], we assessed the specificity of our network by comparing the connectivity patterns from regions of decreased volume in ADHD with regions of decreased volume in a range of psychiatric disorders (n = 212 experiments across 193 studies). Disorders included in the control group were schizophrenia (including schizoaffective and schizophreniform disorders), bipolar disorder, major depressive disorder, substance use disorder, obsessive-compulsive disorder, and several anxiety disorders [30]. However, the resulting two-sample statistical map was both nonsignificant and strongly resembled the one-sample map of the control disorders (Figure 5A), indicating a much higher level of consistency across multiple distinct psychiatric conditions than among ADHD studies only.

3.6.2 Neurodegenerative Disorders Cohort 1
We next compared connectivity patterns in ADHD with those from regions of decreased volume seen in a variety of neurodegenerative disorders (n = 26 studies), including Alzheimer's disease, behavioral variant frontotemporal dementia, corticobasal syndrome, and progressive nonfluent aphasia [16]. Once again, this statistical comparison was both nonsignificant and largely resembled the one-sample map for the neurodegenerative disorders (Figure 5B).
3.6.3 Neurodegenerative Disorders Cohort 2
To confirm the lack of specificity of our ADHD findings, we repeated this comparison with an independent data set of neurodegenerative disorders (n = 163 experiments across 159 studies), including mild cognitive impairment, Alzheimer's disease, Parkinson's disease, and Huntington's disease [31]. This comparison again reflected the one-sample map of the control data set (Figure 5C).
3.6.4 Acute Ischemic Stroke Lesions
Finally, to determine whether the connectivity patterns we identified are related to the predilection of specific brain regions for decreased volume with any neuropsychiatric disorder, we also compared the connectivity patterns from regions of decreased volume in ADHD with lesion connectivity patterns in a large cohort of patients with acute ischemic stroke [32], a cohort where impaired attention is also a common comorbid condition. The two-sample t test was again nonsignificant, and again, the strongest differences seemed to largely reflect the consistency of the control (stroke) data set (Figure 5D).
3.7 Control Experiment 2: ADHD Study-Related Coordinates Versus Random Study-Related Decreased Volume Coordinates
Given the surprising lack of specificity of our ADHD-related networks against other clinical cohorts, despite the strong internally consistent distribution described above (Figure 4A), we next sought to investigate whether the network identified here represents a unique finding or is simply a reflection of patterns of decreased volume in general. We statistically compared the results from our set of 40 ADHD studies to those from a set of 40 randomly chosen studies showing decreased volume from the BrainMap [33] database. First, we conducted a one-sample PALM analysis of these random studies, revealing a map that strongly resembled the ADHD map, comprising regions of the basal ganglia, thalamus, hippocampus, and frontal regions like the orbitofrontal cortex (see Supporting Information S1: Table 2 for a full list of peak coordinates). Notably, however, the ACC was largely absent in this map. A subsequent two-sample t test analysis comparing this random study map with the ADHD map revealed no significant differences in connectivity (Figure 5E), and the one-sample t map of 40 random studies had a strong spatial correlation with the one-sample t map of 40 ADHD studies (r = 0.850).
3.8 Control Experiment 3: ADHD-Related Coordinates Versus Random Gray Matter Coordinates
As an additional synthetic control, we also compared our ADHD-related coordinates with an equal number of random gray matter coordinates split into 40 groups. A one-sample analysis of these random “synthetic” studies revealed a small number of seemingly randomly placed significant coordinates, with positive connections in regions of left cerebral white matter and negative connections in the brainstem, cerebellum, caudate, and bilateral white matter. The FWE-corrected two-sample t test of ADHD networks of decreased volume versus these purely random coordinates only identified one small cluster in the brainstem, indicating a stronger connection to the random coordinates than the ADHD coordinates. As with the analysis above using actual studies, the one-sample t map of random gray matter coordinates was still correlated, although to a lesser degree, to the one-sample t map of the ADHD networks (r = 0.666a) (Figure 5F).
4 Discussion
We leveraged CNM to determine whether a single brain network is connected to regions reported to show focal ADHD-related regions of decreased volume, whether atrophy or underdevelopment, and then tested whether this finding is unique to ADHD. First, we replicated that ALE meta-analyses reveal no spatial convergence among ADHD-associated findings. Then, we assessed for overlap with or connectivity to a priori defined putamen and DMN regions and found that there was little spatial overlap with the DMN and only weak connectivity to the putamen. Finally, conducting a CNM analysis with the same source data, we demonstrated that regions of decreased volume in ADHD are consistently connected to frontal and subcortical regions resembling the reward and action mode networks. However, our data do not support the conclusion that this network is specific to ADHD, in contrast to previous studies identifying consistent localizations across multiple other neuropsychiatric disorders [4, 40]. Our findings have important implications regarding not only the neural correlates of ADHD but also ADHD as a diagnosis, which we discuss below.
4.1 Focal Patterns of Decreased Volume in ADHD Have Been Frequently Reported Yet Are Highly Variable Across Studies
To date, multiple studies have reported distinct regions of decreased volume associated with ADHD [6, 7, 9]. However, these regions exhibit significant spatial heterogeneity, with no single region consistently implicated across studies [7]. As described above, the most commonly reported region (i.e., the right putamen) appeared in only five of the 40 experiments included.
Furthermore, the ALE approach did not identify any singular regions as consistently atrophied in ADHD. ALE is a well-validated technique that has been useful in numerous meta-analyses, finding convergence of regions of decreased volume in neuropsychiatric disorders (e.g., migraine [41] and Tourette syndrome [42]). As the field expands to examine complex neuropsychiatric phenotypes, we expect there will be more cases where ALE produces a limited result, even when appropriately powered, as many of these conditions may represent network phenomena.
CNM may be a more appropriate approach for complex phenotypes as it is more likely to find convergence in disorders reflecting network dysfunction rather than impairment of individual regions [12]. Since ADHD is associated with a spectrum of behavioral phenotypes [1], frequent comorbidity with other neuropsychiatric disorders [1, 43], and likely neuroanatomical variability from patient to patient, ADHD is a useful test of CNM's ability to determine whether patients all have in common an alteration of a consistent brain network, even if via remote functional effects, that is, diaschisis [44].
4.2 ADHD-Associated Volume Decreases Are Connected With the Reward and Action Mode Networks
Our localization (Figure 4A) has face validity and biological plausibility as a neuroanatomical substrate for ADHD. Functional neuroimaging studies have long implicated the mesolimbic pathway in reward processing [45]. While not a diagnostic criteria of ADHD, reward processing is a commonly accepted feature of the ADHD phenotype, with more pronounced attention difficulties in activities with lower immediate reward than highly rewarding activities [46]. However, given the correlational nature of traditional imaging studies, it is unclear whether these decreased volumes represent a cause or downstream effect of persistent atypical reward processing.
Multiple regions in our ADHD network also fall within the AMN, which overlaps with the “salience” network and has been proposed to be a core circuit involved in planning, sustained attention, and goal maintenance [37, 38]. As such, it is eminently plausible that this network is affected in ADHD. Moreover, the AMN is strongly negatively correlated with the DMN [37], which may align with prior observations that found decreased connectivity within the DMN in ADHD [7, 11].
Interestingly, our results also converge with other methods that leverage the network structure of the brain. One recent analysis compared focal structural brain measurements with neuropsychiatric symptoms and found three distinct patterns of decreased volume associated with (1) multiple psychiatric disorders, (2) autism spectrum disorder–related symptoms, or (3) ADHD-related symptoms [4]. While our map has mild similarity with this third map (Figure 6) (r = 0.411), there is a high degree of focal overlap with specific regions identified in the ACC, bilateral putamen, thalamus, and medial orbitofrontal cortex.

4.3 The Lack of Specificity in the ADHD Network Map May Reflect the Brain's Large-Scale Network Structure
Despite the biological plausibility of our ADHD network, we describe that numerous regions positively connected to coordinates representing decreased volume consistently emerged across data sets (Figure 5). Large clusters encompassed areas of the ACC, bilateral putamen, caudate, hippocampus, and brainstem, with smaller clusters across frontal and subcortical regions and the cerebellum. These regions were observed both in disorder-associated coordinates and in purely random gray matter coordinates, albeit to a lesser extent. While these regions are biologically plausible as an ADHD network, the lack of statistical specificity with other conditions indicates that the ADHD results are not nearly as consistent as those seen in other previously studied conditions. Furthermore, the lack of statistical difference between random gray matter coordinate-derived maps and the ADHD maps suggests that either the identified networks are centrally located within the brain's overall connectome and will often appear in CNM analyses in general—a bias of the method—or represent a null finding indicating that these regions are nearly random in location and the ADHD literature has yet to capture any true signal. This suggests a heightened likelihood for these regions to be functionally connected to other brain areas in any individual, indicating that our network may simply reflect the large-scale network structure of the brain. If these networks are highly connected, they are likely to emerge even in random coordinates because of their general functional relevance across the brain. As such, we cannot reject the hypothesis that any set of coordinates could result in a similar network by chance. Notably, this is the first time a large CNM study has found a significant and consistent within-cohort signal that has failed to demonstrate specificity to a disorder when compared with control groups, including purely random coordinates. This result likely stems from the heterogeneity of the original coordinates and may speak to the difficulty in both studying ADHD and conceptualizing ADHD as a consistent diagnosis.
Another possible explanation for the lack of specificity seen here relates to the broader issue of specificity in ADHD diagnosis. The association of both the reward and action mode networks with ADHD is plausible; however, reward processing and sustained attention deficits are associated with a variety of disorders, including autism, depression, and schizophrenia [39, 47]. Thus, it may be unsurprising that we could not demonstrate specificity of our findings to ADHD when compared with control groups with other neuropsychiatric or neurodegenerative conditions [15, 30-32]. Supporting this theory, a recent meta-analysis linked disruptions in the salience network with various common psychopathologies [48], and early ADHD diagnosis has even been associated with an increased risk of later neurogenerative disorders [49]. Involvement of the observed networks, albeit complicated by the network bias described above, may still reflect shared attention and executive function symptoms across various neuropsychiatric conditions. While specific patterns of impairment may exist in different disorders, the literature suggests that most common psychopathologies, including ADHD, are consistently associated with executive function impairments across a wide range of tasks [50, 51].
In fact, given the frequent under- and over-diagnosis, neuropsychiatric comorbidity, and phenotypic heterogeneity [2] of ADHD, studying individual symptom profiles may be necessary to identify brain regions or networks associated with ADHD. This bottom-up approach aligns with the National Institute of Mental Health Research Domain Criteria initiative, which aims to classify mental disorders based on neurobiological substrates and dimensions of observable behavior beyond the symptoms specified by current categorical diagnoses [52]. While categorical diagnoses have practical clinical utility, research on symptom profiles may help refine the diagnostic criteria of ADHD to better resolve the heterogeneous biological reality.
4.4 Limitations
Several limitations of the current study must be acknowledged. Due to a lack of control data sets with coordinates representing volume increases, any findings of increased volume across the ADHD studies were excluded. An exploratory one-sample t test with permutations of these increase coordinates found no significant voxels when FWE-corrected. With a less stringent false detection rate correction, peak coordinates appeared in the cerebellum, fusiform gyrus/inferior temporal gyrus, brainstem, postcentral gyrus, thalamus, and cerebral white matter (see Supporting Information S1: Table 3 for details). Additionally, due to the absence of participant-level coding, differentiation between children and adults or among the three ADHD subtypes was not feasible. It is possible that the networks involved in ADHD change throughout the lifetime, and/or that different networks are associated with inattentive, hyperactive/impulsive, and combined ADHD. Nonetheless, the current analysis identifies commonalities across these dimensions, and the diversity of our sample would only hinder our ability to detect a consensus network. Additionally, consistent with the prevalence of ADHD, there was a high proportion of males in this analysis. Most studies used matched cohorts to mitigate sex-related effects; however, future work leveraging participant-level coding (mega-analysis) may be able to address ADHD-related sex differences. Of note, repeating our analyses with a male-only connectome did not alter the results. Finally, a small number of participants had comorbidities common to ADHD, including learning disorders, oppositional defiant disorder/conduct disorder, anxiety, mood disorders, and tic disorders [43]. Therefore, it is possible there would be some overlap between the networks involved in ADHD and those involved in other disorders. While not ideal, the inclusion of participants with comorbidities should only bias against identifying consistent effects here.
4.5 Future Directions
Future meta-analyses examining regions of increased volume and/or increased and decreased fMRI activation may provide a more complete picture of network involvement in ADHD. However, leveraging fMRI studies to examine long-term traits are confounded by the specific tasks performed compared with structural source data used here. It would also be beneficial to study differences in brain networks between age groups, gender, and ADHD subtype. Given the possibility that the lack of specificity in our results was due to heterogeneity within individuals diagnosed with ADHD, future studies would be enhanced by prospective data collection with in-depth, objective ADHD symptom-specific characterization. Finally, studies that directly modulate brain activity or connectivity of specific brain regions or networks, via direct invasive or noninvasive neuromodulation or fMRI neurofeedback, may help disambiguate which regions are more directly and causally associated with impaired attention.
5 Conclusion
CNM offers a possible explanation for why the previously observed lack of convergence across individual neuroimaging studies of ADHD are strongly connected to specific components of both the reward and action mode networks. However, this finding does not appear to be specific to ADHD. As such, while this network may also be involved in other disorders, it appears likely that existing reports of decreased volume in isolated ADHD simply do not converge at the network level beyond chance. Although the coordinates extracted for CNM were significant compared with healthy controls, our analyses suggest only sensitivity to ADHD, not specificity, compared with other neuropsychiatric conditions. Although this meta-analysis adds to the literature on the neurobiology characterizing ADHD (i.e., sensitivity), the lack of specificity conveys the importance of studying the disorder from a bottom-up, symptom-level approach. Disambiguating the specific networks at play in ADHD will help improve existing brain-based and behavioral interventions and to develop novel treatments.
Author Contributions
Juliana Wall, Joseph J. Taylor, Jacob L. Stubbs, Simon K. Warfield, and Alexander L. Cohen conceived of and designed the study. Juliana Wall and Jacob L. Stubbs acquired the data, and Juliana Wall and Gillian N. Miller analyzed the data. Juliana Wall and Alexander L. Cohen drafted the manuscript and created figures.
Acknowledgments
A. C. was supported by the NIMH (K23MH120510), the Simons Foundation Autism Research Initiative, and the Steve Samuels & Ami Cipolla Innovation Pilot Grant. S. W. was supported by the NIH (R01 NS124212, R01 EB019483, and R01 LM013608).
Conflicts of Interest
The authors declare no conflicts of interest.
Open Research
Data Availability Statement
The functional connectivity data used in our analyses come from the Adolescent Brain Cognitive Development Study [27]. The code for the network mapping analysis is available from the corresponding author, upon reasonable request. Coordinates used in this study are freely available from most publications used in the analysis (see Supplementary Material for a full list of papers used). Data from studies that did not list coordinates are available from the corresponding author, upon reasonable request.