Exaggerated T-wave alternans in children with Angelman syndrome
Abstract
Objective
We aimed to test whether T-wave alternans (TWA), which is a marker of susceptibility to ventricular fibrillation, is abnormal in children with Angelman syndrome (AS) compared with typically developing children (TDC), and whether it can be used as a biomarker of AS.
Materials and Methods
Using surface electrocardiogram (ECG), we calculated TWA in AS and compared it between AS and TDC (Wilcoxon rank sum test). We then performed logistic regression to test TWA ability to distinguish AS from TDC.
Results
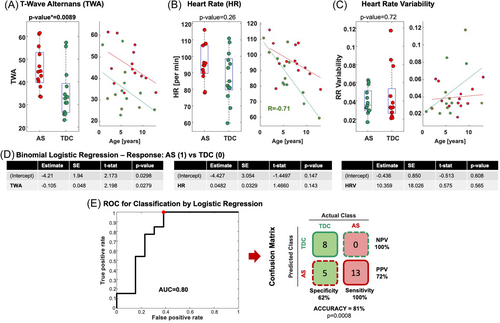
We observed higher TWA in AS than TDC (44 vs. 33 uV, p = 0.009), while heart rate did not differ (p = 0.26), nor its variability (p = 0.72). TWA values enabled discrimination between AS and TDC (p = 0.0008) with accuracy of 81%, positive predictive value of 72%, and negative predictive value of 100%.
Interpretation
Our findings suggest that ECG in children with AS contains evidence of acquired cardiac abnormality via pathologically increased TWA.
Introduction
Angelman syndrome (AS) is a genetic intellectual disability syndrome caused largely by 15q11-q13 deletion, by point mutation of the ubiquitin protein ligase E3A (UBE3A gene), uniparental chromosome 15 disomy, or maternal UBE3A imprinting defect.1-3 Epilepsy prevalence is >90% among patients with AS1, 4, 5 and is often drug resistant with prolonged seizures. An emerging medical literature indicates that patients with recurrent seizures may be prone to acquired myocardial injury, sometimes termed the “epileptic heart,”6 which predisposes them to atrial and ventricular arrhythmias and sudden cardiac death.7 Yet whether physiologic signs of the epileptic heart, as can be detected by surface electrocardiogram (ECG), occur in AS is unknown. We therefore asked whether ECG in AS children contains evidence of acquired cardiac abnormality. Specifically, we tested whether T-wave alternans (TWA), which is a marker of susceptibility to ventricular fibrillation,8 is abnormal in AS children compared with healthy controls, and whether it can be used as a biomarker and classifier that can distinguish AS from healthy controls.
Methods
Participants
We analyzed ECG data from children with AS and typical developing control (TDC) children aged 1–13 years. ECGs from children with AS were extracted from their ambulatory EEGs collected as part of the FiRst Endpoint-Enabling Study in Angelman syndrome study (FREESIAS),9 a prospective, observational, longitudinal study carried out at six US sites (Boston Children's Hospital [BCH], Boston, Massachusetts; Rady Children's Hospital, San Diego, California; Rush University Medical Center, Chicago, Illinois; Baylor College of Medicine, Houston, Texas; University of California, Los Angeles, California; University of North Carolina, Chapel Hill, North Carolina) between September 2019 and May 2021. All participants had a confirmed molecular AS diagnosis (full list of inclusion and exclusion criteria is provided in our previous study).9 Similar ECG data were collected from TDC participants as part of FREESIAS (between September 2019 and May 2021) or a preceding study10 conducted at BCH between 2006 and 2014.
Ethics and Consent
All participants provided informed consent before being enrolled in the study. For AS participants, all consent was provided by their respective caregiver independent of the AS participant's age. Assent was provided for TDC aged 1–4 years, with specific assent forms generated for those aged 5–6 years and 7–12 years that also required signatures from their caregiver. Before recruiting participants, all study documents were approved by an independent institutional review board at each site. All personal data were managed to ensure accordance with applicable national and/or local laws and regulations on personal data protection.
Data Collection
ECG data were obtained as a single channel in an EEG recording, with a cephalic (i.e., EEG system) reference and the active electrode at the V4/V5 position. ECG recordings from the FREESIAS study were recorded during two or three home visits for overnight EEG with TrackItTm Mk3 (Lifelines Neuro, sampling rate 400 Hz): recordings started in the afternoon outside of bed, then participants went to bed continuing to wear the EEG equipment until awaking the next morning. Control ECG data from the FREESIAS study were collected as for the AS, while those collected at BCH were collected in a clinical EEG laboratory—each record lasting 30–60 min (sampling rate: 256 or 512 Hz). Sleep scoring was performed by an experienced sleep EEG technician.
Data Analysis
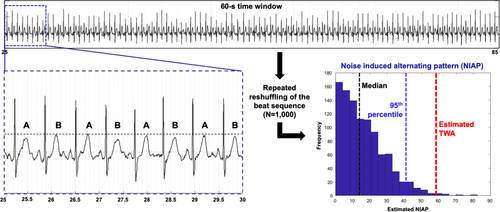
We used a nonparametric surrogate-based test of significance for TWA detection (Figure 1), described and validated in Nemati et al., which differentiates statistically significant TWA from alternating patterns that can be solely explained by the statistics of noise.11 To identify beginning, peak, and end of the T-waves, we used the ECGPUWAVE software available from PhysioNet.org. For TWA analysis, MATLAB (R2018) was used. The TWA detection method is based on estimating the histogram of the noise-induced alternating pattern (NIAP) calculated from 1000 times reshuffling of the even and odd beats (see A and B in Figure 1) within every 60-s window. When the estimated TWA was larger than the 95th percentile of the calculated NIAP, we assumed that the alternating T-wave pattern in the beat sequence could not be explained by the statistics of noise.11 Otherwise, when the estimated TWA fell within the possible values of NIAP, it was regarded as indeterminate. An indeterminate TWA value was also assigned in case of preprocessing failure due to misalignments, inverted T-wave, and/or segmentation issues.

We ran the analysis on 60-s nonoverlapping windows across the entire recording. For each window, we determined whether the TWA value was statistically discernible or indeterminate. We finally averaged all the TWA values per patient (where indeterminate TWA values were excluded). Separate averaged values for sleep and awake were also estimated. Individuals without any statistically discernible TWA were excluded from the study.
Heart rate (HR: beats per minute) in the same windows was calculated as the inverse of the R-R time interval. Heart rate variability (HRV) was calculated as the standard deviation of R-R intervals divided by their mean value, and then normalized dividing by the HR value.
In AS patients, we marked interictal spikes across their whole EEG (5-min windows every hour) and computed the spike-wave index (SWI) as a percentage (if no spikes occurred, SWI was zero).12
Statistical Analysis
TWA values as well as HR and HRV were compared between children with AS and TDC children using the Wilcoxon rank sum test. Paired comparisons between sleep and awake values were performed using the Wilcoxon signed rank test. Correlation between variables was assessed via Spearman correlation. We then fit a logistic binomial regression model of the probability of having AS as a function of each different ECG metric (TWA, HR, and HRV) and computed receiver operating characteristic (ROC) curves using the regression output scores. The optimal operating point of the ROC curve was estimated and used to obtain the model prediction; Fisher exact test was used to test the association between prediction and actual group. We considered p ≤ 0.05 significant. Results are reported as median and interquartile range (25th−75th percentile). Statistical analysis was performed in MATLAB R2018a.
Results
We estimated statistically discernible TWA in 13 TDC and 13 children with AS, whose ages did not differ (5.3 (4.6–7) vs. 7.6 (3.9–8.6) years; p = 0.36). Eleven children with AS (85%) had deletion genotype; eight had history of seizures (based on parents' seizure diary), and 11 had interictal spikes in their EEG data (only one had no history of seizures and no spikes; all the others had either both or spike only). Demographics and clinical characteristics of the cohort are reported in Table 1. In the AS group, TWA correlated positively with SWI (p = 0.033, R = 0.59) but did not differ (p = 0.94) between those with (n = 8) and without history of clinical seizure/s (n = 5). Correlation with SWI lost significance when patients with SWI = 0 were excluded.
| Individual data demographics and clinical characteristics of children with AS | |||||||
|---|---|---|---|---|---|---|---|
| ID | Group | Age (years) | Sex | Genotype | Seizure history | Age at epilepsy onset (years) | Spike-wave index (SWI) [%] |
| 1 | AS | 9.7 | M | DEL | Yes | 0.95 | 2 |
| 2 | AS | 7.6 | F | NDEL | No | n.a. | 1.8 |
| 3 | AS | 10.7 | M | DEL | Yes | 2.90 | 0 |
| 4 | AS | 8.2 | F | DEL | Yes | 1.20 | 1.7 |
| 5 | AS | 4.1 | M | DEL | No | n.a. | 2.1 |
| 6 | AS | 7.5 | M | DEL | Yes | 1.32 | 8.3 |
| 7 | AS | 7.9 | M | DEL | Yes | 1.45 | 7.3 |
| 8 | AS | 2 | M | DEL | No | n.a. | 3 |
| 9 | AS | 3.1 | F | DEL | Yes | 1.75 | 0 |
| 10 | AS | 3.4 | F | DEL | No | n.a. | 0 |
| 11 | AS | 2.8 | M | DEL | Yes | 1.45 | 0.3 |
| 12 | AS | 5.7 | F | NDEL | No | n.a. | 0.7 |
| 13 | AS | 8.2 | M | DEL | Yes | 1.31 | 17 |
| Summary of demographics of the entire cohort and by group | |||||||
| All (N = 26) | 6 (3.6–8.2) | 69% M | - | - | - | - | |
| AS (N = 13) | 5.3 (4.6–7) | 61.5% M | 85% DEL | 61.5% | 1.5 (1.2–1.6) | 3.4 (0.15–5.15) | |
| TDC (N = 13) | 7.6 (3.9–8.6) | 77% M | - | 0% | - | - | |
Group Comparison
Children with AS presented higher TWA values than TDC children (44 vs. 33 uV, p = 0.0089; Figure 2A) without any correlation with age in either group (p > 0.05; Figure 2A). TWA did not differ between sleep and wakefulness (p = 0.28; Wilcoxon sign rank), and increased TWA in AS relative to TDC was observed during both NREM sleep (p = 0.015; AS: n = 11, TDC: n = 6) and wakefulness (p = 0.002; AS: n = 9, TDC: n = 7).

No differences in HR (p = 0.26, Figure 2B) or HRV (p = 0.72, Figure 2C) were observed between TDC and AS. We observed a negative correlation between HR and age (Figure 2B) in the TDC (p = 0.011, R = −0.7) but not AS group (p = 0.51; R = −0.55); no correlations were observed between HRV and age in either group (AS: p = 0.42; TDC: p = 0.089; Figure 2C). Correlations between TWA and HR in AS (p = 0.11, R = 0.46) and TDC groups (p = 0.11, R = 0.46) were also absent.
Binary Classification
As Figure 2D,E shows, TWA values enabled discrimination between AS and TDC children (p = 0.0279, Figure 2D) with a ROC area-under-the-curve of 0.8 and a classification accuracy of 81%, positive and negative predictive value of 72% and 100% (Figure 2E, p = 0.0008, Fisher exact test; true positives = 13; false positives = 5; true negatives = 8; false negatives = 0). HR and HRV instead were not predictive (p = 0.14; p = 0.56, respectively; Figure 2D).
Discussion
We identified pathologically increased TWA in a cohort of patients with AS. Instances of ECG abnormality have been described in limited AS case series, and largely as vagal hypertonia corresponding to bradycardia to asystole during provocations such as laughter.13 However, T-wave abnormalities have not been previously described in this syndrome.
TWA magnitude may reflect the exposure of the myocardium to bouts of increased sympathetic tone, often concomitant with poor ventilation/oxygenation during seizure. That is, the myocardium may undergo slight injury with each seizure, and the cumulative pathologic change is reflected in the TWA. Epilepsy often starts at a young age in AS, with 85% of patients developing seizures before age 3 years,14 and patients with AS are exposed to numerous seizures in childhood. Our finding of increased TWA in our population may thus reflect the cumulative injury from recurrent seizure and plausibly a susceptibility to cardiac arrhythmia, including ventricular fibrillation.
Interestingly, we observed no differences in TWA between AS children who did and did not have a history of seizures, which encourages larger sample investigations to test whether TWA enhancement may be an AS endophenotype. On the other hand, we did observe a moderate correlation between TWA and the amount of EEG interictal epileptiform discharges. Since these epileptiform abnormalities are a consistent finding across AS patients, also seen in children with no seizure history (Table 1), their correlation with the observed TWA suggests a potential neurocardiac link that merits further exploration. While our findings revealing increased TWA, and thus cardiac risk, in AS are novel, we acknowledge that elevated TWA is not specific to this syndrome, but rather a measure of arrhythmogenic repolarization abnormality seen in patients with diverse cardiac conditions or syndromes.15-19
Limitations of this pilot study include: (1) the use of a single ECG lead instead of 12, which reduces signal quality and our ability to quantify TWA in many patients (where TWA resulted indeterminate) and (2) a small sample size, which limits generalizability of our findings and warrants larger studies.
In conclusion, our findings of abnormally increased TWA in AS prompt further research in this direction and indicate the utility for ECG monitoring in AS to address the prevalence of and risk for cardiac complications.
Author Contributions
Alexander Rotenberg, Joerg Hipp, Eleonora Tamilia, and Sebastian Holst contributed to the conception and design of the study. Eleonora Tamilia, Assia Chericoni, Georgios Ntolkeras, Navaneethakrishna Makaram, and Sebastian Holst contributed to the acquisition and analysis of data. Eleonora Tamilia and Alexander Rotenberg contributed to drafting a significant portion of the manuscript and/or figures.
Acknowledgments
We thank the children and families who participated in the FREESIAS study and all individuals involved in acquiring the data (doi: 10.1186/s11689-023-09494-w).
This work was cofunded by F. Hoffmann-La Roche Ltd., Biogen, and Ionis Pharmaceuticals Inc. The study was designed as a precompetitive collaboration between F. Hoffmann-La Roche Ltd., Biogen, and Ionis Pharmaceuticals Inc. with representatives of the US-based AS patient advocacy groups Angelman Syndrome Foundation (ASF) and Foundation for Angelman Syndrome Therapeutics (FAST), and academic key opinion leaders.
Conflict of Interest Statement
Alexander Rotenberg has been a paid consultant and has received research support from F. Hoffmann-La Roche Ltd. He has also received recent research support or consulted for BioMarin, CRE Medical, Encoded, LouLou Foundation, Modulight, Neuroelectrics, SSADH Foundation, and Takeda. Alexander Rotenberg is cofounder of and has equity in Neuromotion Inc., PrevEp Inc., and Galibra Inc. Joerg Hipp and Sebastian Holst are employees of F. Hoffmann-La Roche Ltd.
Open Research
Data Availability Statement
Data will be made available to other investigators for the purpose of replication and reuse upon request to the corresponding author.


