Euclidean distance stratified random sampling based clustering model for big data mining
Funding information: No Funding.
Abstract
Big data mining is related to large-scale data analysis and faces computational cost-related challenges due to the exponential growth of digital technologies. Classical data mining algorithms suffer from computational deficiency, memory utilization, resource optimization, scale-up, and speed-up related challenges in big data mining. Sampling is one of the most effective data reduction techniques that reduces the computational cost, improves scalability and computational speed with high efficiency for any data mining algorithm in single and multiple machine execution environments. This study suggested a Euclidean distance-based stratum method for stratum creation and a stratified random sampling-based big data mining model using the K-Means clustering (SSK-Means) algorithm in a single machine execution environment. The performance of the SSK-Means algorithm has achieved better cluster quality, speed-up, scale-up, and memory utilization against the random sampling-based K-Means and classical K-Means algorithms using silhouette coefficient, Davies Bouldin index, Calinski Harabasz index, execution time, and speedup ratio internal measures.
INTRODUCTION
Nowadays, massive data has been grown by the use of digital and communication technologies, especially related to sensor networks, Internet of Things, social media, healthcare, e-commerce, cloud computing, cyber-physical systems, and so on. In May 2018, Forbes released an article related to the speed of data production. Stating that, Google searches 3.5 billion requests per day and 1.2 trillion requests per year worldwide. YouTube users watched 4,146,600 videos, Twitter users wrote 456,000 tweets, Instagram, and Snapchat users shared 46,740 and 527,760 photos, Facebook users wrote 510,000 comments, 293,000 status updates, and 300 million photos updated every minute worldwide.1 These digital platforms have a variety of sources that generate heterogeneous data at high speed. Complex sources, data formats, and large-scale data production define big data. It is a revolution of conventional and batch data because internet users have grown by 7.5% from 2016 to 2018.1 The above data statistics recognize big data in terms of volume, variety, velocity, and determine traditional data mining algorithms, tools, and techniques are incompatible.2 Essential characteristics of big data are recognized as volume, variety, velocity, whatever value, veracity, variability, visualization identified under the supportable characteristics of big data.3-6
One way of summarization is “The heterogeneous (variety) data is generated, created, and updated by heterogeneous (variety) sources through batch, real-time, and stream environment at high speed (velocity). The variety and velocity increase the data size (volume) to multiple Terabytes and Petabytes”. The veracity, value, variability, and visualization are recognized under extreme characteristics that are supported by volume, variety, and velocity. Based on the existing research examination,3-6 extreme characteristics described as “Veracity encourages accuracy through variety. Value supports the results of data mining by volume, variety, and velocity. Variability boosts sentiment analysis via volume and variety. Visualization supports graphical representation according to the user-readable mode by using other big data characteristics”.
Data mining algorithms are required to improve upon their computational cost, speed, scalability, flexibility, and efficiency according to the essential characteristics of big data.7 Extraction of appropriate hidden predictive information, patterns and relations from the heterogeneous large-scale dataset is big data mining,8 which requires higher transparency for volume, variety and velocity because large-scale data contains valuable knowledge and information.9 Mining techniques have limited applicability for high volume datasets due to millions of tuples and records. To overcome these issues, two alternatives are presented. The first is to scale up the data mining algorithm and the second is to reduce the dataset size. These two alternatives allow effective and feasible data mining.10 Intelligent big data mining is a combination of statistics and mining techniques with data and process management.9
Sampling is a technique of data reduction that uses a statistical model.11, 12 It provides a more effective evaluation with accuracy13 and is recognized as a “bag of little bootstraps”.14 Author15 described a standard framework of the sampling process for data mining using clustering. According to this sampling framework, the entire dataset is split into a sample and an un-sample component. The data mining algorithm uses the sample component and gives partial results. This is referred to as an approximate result. Thereafter, merges the partial results and un-sample unit by using a sample extension strategy that produces a final approximate result.
Various applications adopt cluster analysis such as social network analysis, ontology, customer segmentation, scientific data analysis, bioinformatics, natural classification, underlying structure, data compression, mobile ad-hoc networks, target marketing, texture segmentation, scientific data analysis, and vector quantization.15, 16 Clustering is one of the essential techniques in data mining for discovering the class of unlabeled data based on distance, similarity and dissimilarity. It discovers hidden relations, patterns, dance and information between the two classes, and improves the efficiency and effectiveness of the data mining model.17 Some authors16, 18 identified conventional clustering algorithms for big data mining by comparing the volume, variety and velocity, and suggested K-Means, BFR, CURE, BIRCH, CLARA, DBSCAN, DENCLUE, Wavecluster, and FC are robust for big data mining.
Contributions in the past7, 15, 16, 19, 20 addressed cluster creation techniques under single and multiple machine execution environments of big data mining. Clustering techniques for big data mining are categorized into divide-and-conquer, parallel, center reduction, efficient nearest neighbor (NN) search, sampling, dimension reduction, incremental, and condensation methods. Implementation of the parallel method is useful inside of multiple machines and other cluster construction methods are executed inside of both machine environments.21 This article uses sampling-based method for cluster creation under a single machine execution environment. Sampling mechanism increases the speed of the clustering algorithm and reduces computation time. The efficiency of sampling depends on the sample selection strategies and sample size.
In literature 15 discussed the CURE hierarchical clustering algorithm, which is based on uniform random sampling and improves computational efficiency. This method first selects the sample and thereafter carries the hierarchical clustering. Kollios et al.22 has used the density biased sampling technique for cluster construction and outlier detection within the K-Means and K-medoids algorithm. David et al.23 present a sample-based clustering framework for K-Means and K-Median clustering algorithms. This sampling framework achieves approximation results and depends on the sample size and accuracy parameters because the sample bounds the convergence to optimal clustering.
Aggarwal et al.24 proposed a bi-criteria approximation approach for the initial centroid selection of K-Means clustering using adaptive sampling. This approach achieves ineffective triangle inequalities due to excessive Euclidean distance computations and distance comparison. Bejarano et al.25 suggested a sampler algorithm for K-Means clustering based on random sampling. This algorithm reduces the distance estimation and computational cost in each iteration. The sampler algorithm increases the computation time for massive multi-dimensional data due to sample size estimation in each iteration. Cui et al.26 suggested optimized K-Means clustering by random sampling and parallel execution strategies. This strategy eliminates the iteration of K-Means inside parallel execution and yields effective performance. Xu et al.27 described the random instance sampling-based approximate clustering approach for text-based data and compared it against K-Means, and observed sampling-based clustering to reduce computationally expensive.
Zhan et al.28 introduced a spectral clustering algorithm by incremental Nystrom sampling method for large-scale and high-dimensional datasets. This algorithm achieves optimal approximation results and shows that maximum sampling trials efficiently reduce sampling error. Ros et al.29 used a combination of distance and density sampling for K-Means and hierarchical clustering. This method eliminates multiple distance computations in both clustering algorithms and is insensitive to data size, cluster noise, data, and cluster initialization. However, the combination of both sampling techniques increases the computation cost in the first iteration of the clustering. Zhao et al.30 presents Cluster Sampling Arithmetic (CSA) efficient heuristic approach for clustering through random sampling. This algorithm reduces the computation time by obtaining the minimum sample set and avoids the local optimum problem. The CSA uses a parallel execution strategy and discovered the initial centroid of K-Means clustering.
Aloise et al.31 used iterative sampling to solve the minimax diameter clustering problem. The minimax diameter clustering problem is related to minimizing the maximum intra-cluster dissimilarity. The solution to the minimax diameter clustering problem is to solve the partitioning clustering objective. Ben Hajkacem et al.32 used reservoir random sampling and proposed the sampling-based STiMR K-Means clustering algorithm. The STiMR K-Means algorithm is used triangle inequality and MapReduce acceleration techniques for fast execution. This algorithm suffers from scalability-related issues. Li et al.33 proposed sampling-based K-Means (SKMeans) and discovered excellent results as compared to the K-Means algorithm. This algorithm effectively reduces data size and increases cluster effectiveness and efficiency. Luchi et al.34 enhanced the DBSCAN clustering algorithm by sampling in terms of clustering time and scalability, which is known as Rough-DBSCAN and I-DBSCAN. These algorithms are influenced by some parameters such as sample size.
Based on the above research perspective, sampling is used for different kinds of clustering problems such as outlier detection, initial centroid identification, cluster construction, data size selection, computation cost, sampling error, trails of sampling, local optima, clustering objective, enormous distance computation, scalability, speed-up, and so on. The literatures 26, 27, 30, 33 used multiple machines and literatures 22-25, 28, 29, 31, 32, 34 used a single machine execution environment for clustering, and most of the clustering algorithms achieved approximation results. This study considers the improvement of random sampling concerning cluster creation in a single machine execution environment.
Some other sampling-based data mining techniques are density biased sampling,22 CURE (Clustering Using REpresentatives), RSEFCM (Random Sampling plus Extension Fuzzy C-Means), CLARANS (Clustering Large Applications based on Randomized Sampling),15 eNERF (extended non-Euclidean relational fuzzy c-means clustering),35 progressive sampling-based mining of association rules,36 GOFCM (geometric progressive fuzzy c-means),15 EM clustering,35 STiMR K-Means,32 AdROIT (Adaptive Reservoir sampling Of stream In Time),37 random pairing,38 adaptive-size reservoir sampling, Stratified Reservoir Sampling,39 Monte Carlo based uncertainty quantification and Refined Stratified Sampling,40 SSEFCM (Stratified sampling Plus Extension Fuzzy C Means),15 BIRCH,16 and so forth.
The objective of this article is to improve the computational efficiency and computing speed of conventional clustering algorithms without affecting cluster quality in big data mining using stratified random sampling. Section 0 describes the problem of data mining in large-scale data and presents big data clustering techniques based on existing computational methods. Section 0 has a stratified sampling method, stratum creation algorithm, and stratified sampling-based data mining algorithm. Section 0 contains the implementation of proposed work using the K-Means algorithm and validates them using internal measures. Section 0 concluded the study contribution and determines further research directions.
PROPOSED WORK
This section describes the clustering objective and presents the stratified sampling-based K-Means algorithm (SSK-Means) with Euclidean distance-based stratum (EDS) for cluster construction to big data mining using single machine execution. The proposed method enhances computational efficiency, computation cost and computing speed without affecting cluster quality and cluster objective.
Objective function
Proposed model for big data mining
This subsection presents the stratified sampling based data mining model which has the capability to scale-up and speed-up any conventional data mining algorithm in big data environment. The proposed model uses a three phase with the help of stratified sampling, data mining technique as clustering and sample extension. In the following, details of stratified sampling and sample extension are described separately.
Stratified sampling (SS)
A successful sampling technique must be scalable under the high volume, variety, and velocity characteristics of big data. The SS reduces data volume size, data categorization from heterogeneous to homogeneous, and changes sample data concerning the time and user requirements.15, 30 The SS is an unbiased sampling approach from a statistical point of view that improves the convergence rate and reduces the variance.40 These capabilities illustrate that SS is more scalable for big data mining compared to other sampling methods.
The objective of SS is to improve upon the precision of results based on homogeneous strata. It conducts the sampling process in two phases. In the first step, the entire dataset is grouped into small strata based on the similarity that is known as the stratification process. The second step extracts some relevant data points from each stratum for data mining or analysis called sample allocation. The data points of the sample collection are chosen by any sampling method according to the objective function.42, 43
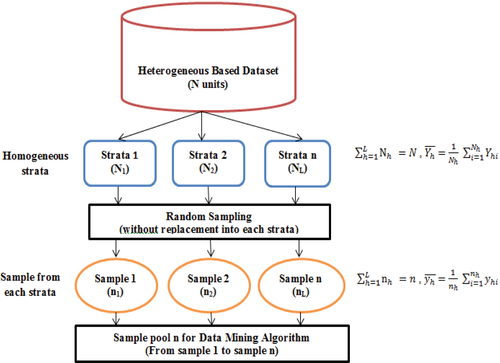
Suppose the dataset N is grouped into L strata and hth stratum has consisted of Nh data points where and h = 1,2,3,4…,L. The sample size nh of each stratum is drawn by any suitable sampling technique as a research problem requirement where . The conceptual representation of SS is shown in Figure 1.
Stratification
In computer science, numerous stratification techniques are available for stratum formation, such as locality-sensitive hashing,15 greedy stratification method,44 Latin Hypercube Sampling,40 hamming distance and other collision-related hashing and bucket-based strategies. This article considers a new method of stratum creation using the Euclidean distance, which is known as Euclidean distance based stratum (EDS). The EDS algorithm used the maxmin data range heuristics approach for k stratum construction, which produces a high homogeneity within-stratum as compared to the mid-square, division, multiplication, and flooding hashing technique. This method first determines the k centroid of the dataset based on max and min range heuristics of the data points and thereafter assigns each data point to the k stratum through the Euclidean distance between the data points and the k centroid of the dataset. This approach describes the high density and compaction within each stratum. The EDS algorithm is described in Algorithm 1.
Algorithm 1. Proposed Euclidean distance based stratum (EDS)
Input:
1. data = Dataset with N data points.
2. i = Attributes of the dataset.
3. k = Required number of strata.
Output:
1. of homogeneous strata.
Method
Data set centroid identification
1.
2. if is greater than than
3. dataset has noise data point and exit()
4. else
Stratum centroid identification
5.
6.
7.
8. End if
Assign data point into stratum
10. Assign each data on the closed k stratum.
11. end for
12. Exit()
Sample allocation techniques
After deciding the optimum sample size of the stratum, the next is to data from the stratum through random sampling. The selection of data points from each stratum has equal changes with probability. Random sampling is used as the probability distribution and without-replacement procedure. The sample pool has n data units from the hth stratum and this sample pool is used for mining.
Sample extension
Algorithm description
This subsection presents the stratified sampling-based data mining algorithm for K-Means (SSK-Means) clustering based on a single machine execution environment that reduces the computation cost and memory resources without impacting conventional K-Means effectiveness. The proposed model first constructs the stratum through the EDS algorithm and then collects samples from each stratum in the sample pool with the help of Neyman allocation and random sampling. Hereafter, the data mining technique is applied inside the sample pool that produces partial results. The last step merges the final result using a sample extension method that merges the un-sample data into partial results. The final result is validated through data mining measures. The details of the proposed SSK-Means algorithm is described in Algorithm 2 and their flowchart in Figure 2. The flow chart explains the essential concept of the SSK-Means algorithm.
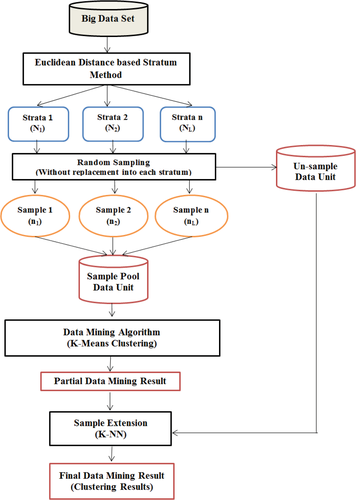
Algorithm 2. Stratified sampling-based K-Means using proposed big data mining model
Input:
1. Data points on D dimension space.
2. i = Attributes of the dataset.
3. k = Required number of clusters.
Output:
1. Approximate Final clustering result.
Method
1. Call the EDH(N,i,k) algorithm to create an L stratum, where EDH returns the number of L strata equal to k.
2. Determine the number of data objects from each stratum using Equation 6.
3. Using random sampling, collect data objects from each stratum and assign each data object into the Ns sample pool and leftover data objects to the Us un-sample pool.
4. Apply required clustering techniques in the Ns pool such as PFc = KMeans(k,Ns)
5. Used Equation 9 for sample extension to obtain final clustering results through centroids of PFc and Us pool such as
6. Exit
COMPUTATIONAL ANALYSIS
This section first explains the experimental setup and details of datasets for evaluation and then computes the performance of the SSK-Means algorithm using effectiveness and efficiency-related evaluation criteria.
Experiment environment (tools) and dataset
The experimental environment of the proposed model has used the Jupyter notebook computing environment, Python 3.5.3 programming tool, Intel I3 processor, CPU [email protected] GHz, 320 GB hard disk, 4 GB DDR3 RAM, Windows 7 Operating System with two real datasets from UC Irvine Machine Learning Repository (archive.ics.uci.edu/ml/datasets/seeds). Details of these datasets are described in Table 1. Evaluation of the real dataset used 5%, 10%, 15%, and 20% sample data and after that merged the sample results with 95%, 90%, 85%, and 80% un-sample data, respectively.
| Datasets | Objects | Attributes |
|---|---|---|
| Skin segmentation | 245,057 | 3 |
| Poker | 800,000 | 10 |
- Note: Optimal values for each investigation are marked in boldface.
Evaluation criteria of clustering validation
- Silhouette coefficient (SC) is to validate clustering performance through a pairwise difference of cluster distances within (compactness) and between (separation). The SC measures the similarity within the cluster. In the SC formula, a(x) is the average distance of x to all other data points in the same cluster C, b(x) denotes the average distance of x to all other data points in all Ci clusters.
- Davies Bouldin Score (DB) help to evaluate within-cluster dispersion and between cluster similarity. Moreover, DB evaluates cluster dispersion and similarity without dependence on number of clusters. In the DB formulation, k is the total number of clusters, defines the total number of data point inside of cluster and is another cluster.
- Calinski Harabasz Score (CH) determines the average value of the sum of squares between and within clusters. The CH measures cluster variance and is referred to as the variance ratio criterion. In the CH formulation, n is the total number of data points, k for the total number of clusters, x is data points inside the cluster, m denotes the mean of entire dataset and is the mean of cluster.
- Execution time (ET) computes the total execution time of any algorithm/model. The execution time is achieved by between the entry ENT and exit EXT time of any data mining algorithm.
- Speedup ratio (SR) estimates the ratio of execution time of sampled-based algorithm and conventional algorithm .
Used algorithm for big data clustering
This study compares the performance of the proposed stratified random sampling-based K-means algorithm (SSK-Means) against the random sampling-based K-means (RSK-Means)25 and traditional K-means19 algorithm inside a single machine based on clustering objective.
Results
The reported results of internal measures are shown in Tables 2–6 based on the average of 10 trials. Optimal values for each investigation are marked in boldface. A number of clusters are set at three for experiments. Tables 2–4 presents the comparative examination of SC, DB, and CH values on experimental datasets using RSK-Means and SSK-Means algorithms, respectively. Table 2 illustrates that the proposed SSK-Means algorithm attained improved cluster compaction and separation than RSK-Means algorithm by maximization of SC value. The SC value of the SSK-Means algorithm is achieved better than RSK-Means except for the sample size 10% on the skin dataset and SC value of the SSK-Means algorithm is much optimized compared to RSK-Means in all sample sizes on the poker dataset.
| Dataset | Sample size | RSK-Means | SSK-Means |
|---|---|---|---|
| Skin segmentation | 5% | ||
| 10% | |||
| 15% | |||
| 20% | |||
| Poker | 5% | ||
| 10% | |||
| 15% | |||
| 20% |
- Note: Optimal values for each investigation are marked in boldface.
| Dataset | Sample size | RSK-Means | SSK-Means |
|---|---|---|---|
| Skin segmentation | 5% | ||
| 10% | |||
| 15% | |||
| 20% | |||
| Poker | 5% | ||
| 10% | |||
| 15% | |||
| 20% |
- Note: Optimal values for each investigation are marked in boldface.
| Dataset | Sample size | RSK-Means | SSK-Means |
|---|---|---|---|
| Skin segmentation | 5% | ||
| 10% | |||
| 15% | |||
| 20% | |||
| Poker | 5% | ||
| 10% | |||
| 15% | |||
| 20% |
- Note: Optimal values for each investigation are marked in boldface.
| Dataset | Evaluation criteria | K-Means | RSK-Means | SSK-Means |
|---|---|---|---|---|
| Skin segmentation | SC | |||
| DB | ||||
| CH | ||||
| Poker | SC | |||
| DB | ||||
| CH |
- Note: Optimal values for each investigation are marked in boldface.
| Dataset | Sample size | RSK-Means | SSK-Means |
|---|---|---|---|
| Skin segmentation | 5% | ||
| 10% | |||
| 15% | |||
| 20% | |||
| Poker | 5% | ||
| 10% | |||
| 15% | |||
| 20% |
- Note: Optimal values for each investigation are marked in boldface.
Table 3 reveals that the proposed SSK-Means algorithm obtained a better distance within and between clusters than RSK-Means algorithm through minimization of DB value. The DB value of the skin dataset is close to zero because the dataset uses an exact number of clusters. The DB value of the poker dataset is higher than one due to the reason it requires more clusters. The DB value of SSK-Means is accurate as opposed to RSK-Means in both datasets. Table 4 reflects that the proposed algorithm achieved excellent variance ratio between sum of squares within and between by maximization of CH value. Validation of CH score and SSK-Means algorithm, the skin dataset obtained better CH as compared to RSK-Means excluding sample size 15%, and poker dataset achieved better-optimized CH value as compared to RSK-Means in all sample sizes.
Table 5 presented the SC, DB, and CH examinations of K-Means, RSK-Means, and SSK-Means using average results of the selected sample size, where SSK-Means obtained better SC, DB, and CH results compared to K-Means and RSK-Means on both datasets. This reflection demonstrates that the SSK-Means seems to be achieved efficiencies homogeneity, compaction, separation, similarity and than K-Means, RSK-Means algorithms.
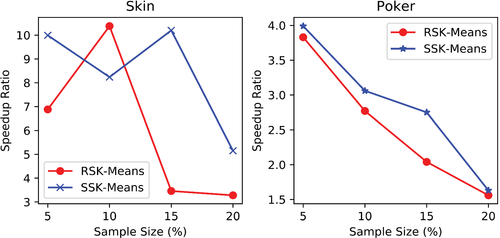
The execution time and speedup ratio validate the algorithm efficiency. Table 6 shows the execution time of the RSK-Means and SSK-Means algorithms on selected sample sizes and their speedup ratio as mentioned in Figure 3 using K-Means execution time. The execution time of SSK-Means is achieved better than the RSK-Means algorithm on each sample size. The speedup of SSK-Means achieved high scalability and speed as compared to the RSK-Means algorithm on each sample size except for the 10% sample size in the skin dataset. The sample size 15% obtains higher scalability and speed of SSK-Means while compared with other sample sizes in both datasets.
The average execution time of the K-Means, RSK-Means, and SSK-Means algorithms are in Figure 4 that indicates the SSK-Means comments less execution time compared to K-Means and RSK-Means. The proposed SS-based algorithm reduces the execution time without affecting the quality of conventional and random sampling-based algorithms. The SSK-Means reduce the average execution time by 58% and 31% with respect to RSK-Means in the skin and poker datasets, respectively.
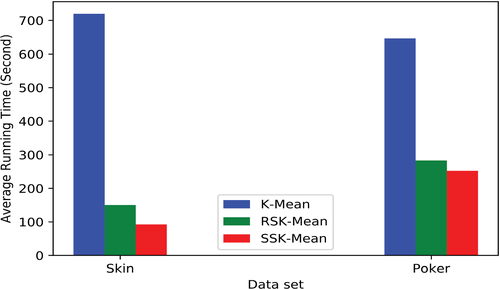
The SSK-Means algorithm uses smaller iterations during clustering that reason the SSK-Means algorithm is to reduce the execution time, computation cost, resource consumption, and improve the convergence speed of K-Means. The reported results of Table 5 and the average execution time of Figure 4 indicate that the SSK-Means have achieved better effectiveness and efficiency against the RSK-Means algorithm and comparable to the K-Means. This indicates that the proposed algorithm is straightaway scalable and robust for big data clustering.
CONCLUSION
This study has suggested two strategies to overcome the shortcomings of the sample-based clustering algorithm in the terms of computation time, resource utilization, and quality. The first is known as the EDS method that is used for stratum creation by dividing original data into different strata according to a number of cluster requirements. The second approach is a stratified random sampling-based data mining model for big data (abbr. SS-based data mining algorithm as SSK-Means). The SSK-Means algorithm has been compared to random sampling-based K-Means (abbr. RSK-Means) using SC, DB, CH, ET, and SR validation. The 5%, 10%, 15%, and 20% sample size data objects have been chosen by EDS, sample allocation and stratified sampling. The K-Means partial clustering results of 5%, 10%, 15%, 20% selected sample sizes data have been obtained and merged into 95%, 90%, 85%, 80% un-sample data by sample extension for final results. The SSK-Means obtained a high speedup ratio in a sample size of 15% as compared to other sample sizes and RSK-Means. Experimental studies on real data sets show that the proposed algorithm has superior clustering performance than RSK-Means and conventional K-Means algorithms in terms of efficiency and effectiveness. The SSK-Means achieved better computing time, cluster quality, and efficiency in 15% and 20% sample sizes. Sampling strategies significantly reduce the clustering time on large-scale data, but they may decrease the cluster quality due to small sample size selection. The sample selection, sample allocation, clustering algorithm, and sample extension are based on the stratification process. Therefore, better stratification determines the effectiveness and efficiency of the clustering algorithm. Further scope of the study is to overcome stratification process, sample size selection, sample allocation concerns for excellence cluster effectiveness by validating other internal and external measurements on single or multiple machine-based environments.
CONFLICT OF INTEREST
The authors declare that they have no conflict of interest.
Biographies

Kamlesh Kumar Pandey is pursuing a Ph.D. from Dr. Hari Singh Gour Vishwavidyalaya (A Central University), Sagar, India, under the supervision of Prof. Diwakar Shukla. Currently, He is doing research on the design of big data mining algorithms with respect to clustering. He is the author and co-author of several research articles in International journals and conference such as IEEE, Springer, and others. He has 8 years of teaching and research experience. He awarded training of young scientist in 34th and 35th M.P. Young Scientist Congress.

Diwakar Shukla is presently working as HOD in the Department of Computer science and applications, Dr. Hari Singh Gour Vishwavidyalaya, Sagar, India, and has over 25 years' experience of teaching research experience. He obtained M.Sc.(stat.), Ph.D.(stat.) degrees from Banaras Hindu University, Varanasi and served the Devi Ahilya University, Indore, M.P. as a permanent Lecturer from 1989 for 9 years and obtained the degree of M.Tech.(Computer Science) from there. He joined Dr. Hari Singh Gour Vishwavidyalaya, Sagar as a reader in statistics in the year 1998. During Ph.D. from BHU, he was junior and senior research fellow of CSIR, New Delhi through Fellowship Examination (NET) of 1983. Till now, he has published more than 75 research articles in national and international journals and participated in more than 35 seminars/conferences at the national level. He also worked as a Professor at the Lucknow University, Lucknow, U.P., for one (from June 2007 to 2008) year and visited abroad in Sydney (Australia) and Shanghai (China) for conference participation and paper presentation. He has supervised 14 Ph.D. theses in Statistics and Computer Science and seven students are presently enrolled for their doctoral degree under his supervision. He is the author of two books. He is a member of 11 learned bodies of Statistics and Computer Science at the national level. The area of research, he works for are Sampling Theory, Graph Theory, Stochastic Modeling, Data mining, Big Data, Operation Research, Computer Network, and Operating Systems.


