Dpcd Induces Hydrocephalus Because of Partial Defects in the Inner Dynein Arms, With Abnormal Ciliary Motility
Funding: This work was supported by Japan Society for the Promotion of Science (17K17792, JP16H06280 and 22K12780).
ABSTRACT
Primary ciliary dyskinesia (PCD) is a congenital disease caused by gene mutations linked to ciliary dysfunction. PCD causes different symptoms, including chronic sinusitis, infertility, situs inversus and hydrocephalus. Motile cilia on ventricular ependymal cells are a crucial factor in cerebrospinal fluid circulation, and dysfunction of these cells causes hydrocephalus. Deleted in primary ciliary dyskinesia (Dpcd) is one genetic abnormality known to cause PCD, and its knockout leads to hydrocephalus in mice. PCD occurs in Dpcd−/− mice because of the lack of an inner dynein arm (IDA) in the motile cilia. However, how this deficiency is associated with the motility of ventricular ependymal motile cilia in Dpcd−/− mice has not been demonstrated. Herein, we show that Dpcd induces partial defects in dyneins and aberrant motility in ventricular ependymal cilia. In Dpcd−/− mice, the ependymal cilia demonstrated decreased amplitude, abnormal waveforms and low cerebrospinal fluid flow velocity. In addition, the amount of dynein axonemal heavy chains in some IDAs decreased in the ependymal cilia. In wild-type mice, Dpcd was localised in the cytoplasm and cilia of ependymal cells. Thus, abnormal ciliary movement in Dpcd−/− mice is likely attributed to a defect in IDA assembly in the ependymal cilia.
1 Introduction
Motile cilia on ventricular ependymal cells are well-known to be crucial factors in the circulation of cerebrospinal fluid (CSF) (Faubel et al. 2016). Motile cilia have a ‘9 + 2’ microtubule structure, called the axonemes, which are composed of nine outer doublet microtubules and a pair of central singlet microtubules (Grigg and Hodge 1949). Two types of motor proteins link each outer doublet microtubule, called outer and inner dynein arms (ODA and IDA). They are composed of heavy, intermediate and light chains (King 2016). The motile cilia bend and create directional CSF flow as the dynein arms slide between the outer doublet microtubules by converting the chemical energy released from adenosine triphosphate hydrolysis into mechanical energy (Faubel et al. 2016). Generally, ODA and IDA regulate ciliary beat frequency and amplitude, respectively (Brokaw and Kamiya 1987; King 2016). Therefore, dysfunction of the ependymal ciliary dynein arms changes ciliary beating, disrupts CSF circulation and causes hydrocephalus (Antony et al. 2021; Porter and Sale 2000). Mutations of several dynein genes are known to cause hydrocephalus and primary ciliary dyskinesia (PCD) (Ibañez-Tallon et al. 2002; Neesen et al. 2001; Vernon et al. 2005; Zhang et al. 2019). Hydrocephalus is common in mice with PCD but is extremely rare in humans (Duy et al. 2022).
In a mouse model of PCD, deleted in primary ciliary dyskinesia (Dpcd) has been identified as one of the genes causing PCD. It is located on chromosome 19 in mice and encodes a 23 kDa protein (Vogel et al. 2010; Zariwala et al. 2004). Initially, the PCD phenotype was reported to be caused by the lack of DNA polymerase λ (Poll) in mice (Kobayashi et al. 2002); however, subsequent research demonstrated that the lack of Dpcd, which is located next to Poll, caused PCD (Zariwala et al. 2004). A recent study has reported that Dpcd functions as an adapter of the R2TP involved in macromolecular complex assembly and acts as a regulator in initiating the ciliogenesis cascade (Dos Santos Morais et al. 2022; Mao et al. 2024). Mice lacking Dpcd (Dpcd−/−) demonstrate hydrocephalus, a high rate of mortality following birth, situs inversus totalis, chronic sinusitis and male infertility caused by sperm immotility (Kobayashi et al. 2002; Vogel et al. 2010). Previous observations using transmission electron microscopy (TEM) have shown that the motile cilia of Dpcd−/− mice lack IDA (Kobayashi et al. 2002; Vogel et al. 2012; Zariwala et al. 2004); however, the motility of ventricular ependymal motile cilia in Dpcd−/− mice has not been reported. In this study, we assessed the cause of hydrocephalus in Dpcd−/− mice and identified it as a partial deficit in IDA and an abnormal ependymal ciliary waveform.
2 Results
2.1 Dpcd Was Localised in Ependymal Cells, and Dpcd Loss Caused Hydrocephalus
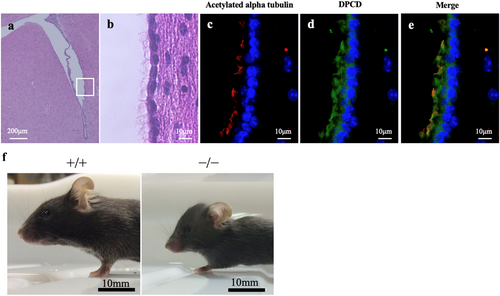
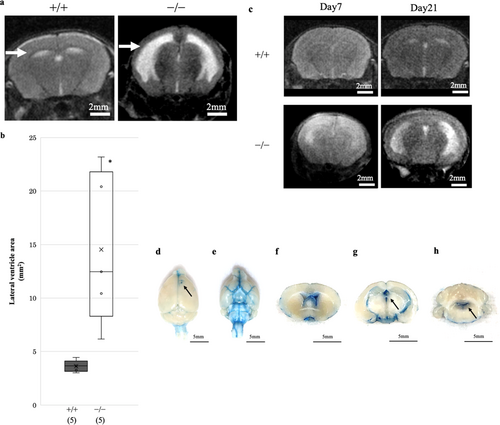
First, we examined the Dpcd expression sites in the ventricles. Immunofluorescence staining revealed that Dpcd was localised in the cytoplasm and cilia of ependymal cells (Figure 1a–e). Next, we examined the appearance and intracranial condition of Dpcd−/− mice to confirm whether they exhibited hydrocephalus. Dpcd−/− mice demonstrated a small body and enlarged skull compared with the same age Dpcd+/+ mice (Figure 1f). Ventricle size was further assessed using head magnetic resonance imaging (MRI) to evaluate hydrocephalus. MRI of a Dpcd−/− mouse revealed an extremely expanded lateral ventricle with a thinned cortex (Figure 2a). The average area of the right lateral ventricle in Dpcd−/− mice was approximately four times larger than that in Dpcd+/+ mice (Figure 2b, each group consisted of five mice). Furthermore, an MRI of the same individual Dpcd−/− mouse revealed that the hydrocephalus gradually worsened over time (Figure 2c). We carefully confirmed the presence of an obstruction in the ventricles, considering that the enlargement of the lateral ventricle in Dpcd−/− mice was remarkable compared to that of other ventricles. Evans blue dye was injected into the right lateral ventricle to assess whether CSF flowed between the ventricles in Dpcd−/− mice. The dye spread from the lateral ventricle to the third ventricle, fourth ventricle and brain surface, confirming no obvious obstruction (Figure 2d–h).
2.2 Motile Ependymal Cilia Demonstrated Decreased Amplitude and Aberrant Waveforms in Dpcd−/− Mice
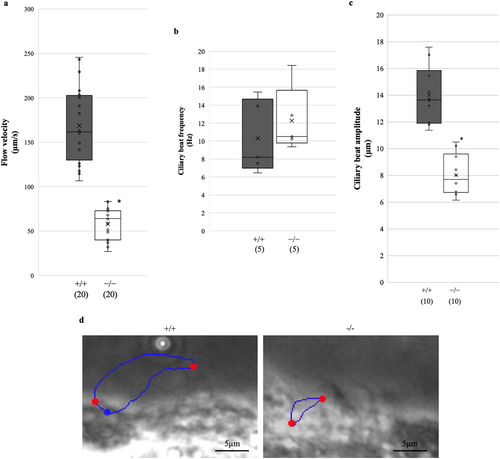
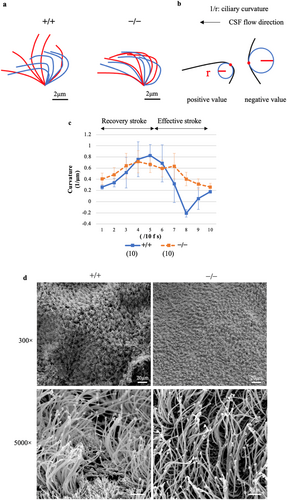
We measured flow velocity using polystyrene microbeads in freshly prepared brain sections to compare the velocity of cilia-driven CSF flow between Dpcd+/+ and Dpcd−/− mice. The average CSF flow velocity in Dpcd−/− mice at the lateral ventricle was significantly lower than that in Dpcd+/+ mice (Dpcd+/+ vs. Dpcd−/−: 168.85 ± 42.22 vs. 58.08 ± 17.57 μm/s, p < 0.05) (Figure 3a; Movies S1 and S2, each group used 5 mice to measure 20 microbeads). Next, we compared the ciliary beat frequency, amplitude and waveform of the ependymal cilia to investigate the cause of the decrease in CSF flow velocity in the Dpcd−/− mice. No significant difference was observed in the average beat frequency between Dpcd+/+ and Dpcd−/− mice (Dpcd+/+ vs. Dpcd−/−: 10.83 ± 3.90 vs. 13.00 ± 3.30 Hz, p = 0.46) (Figure 3b, each group used five mice). Contrastingly, Dpcd−/− mice exhibited a significant decrease in the average amplitude (Dpcd+/+ vs. Dpcd−/−: 13.99 ± 2.0 vs. 8.02 ± 1.48 μm, p < 0.05) (Figure 3c, in each group, a total of 10 cilia were analysed using 5 mice). The ciliary amplitude was measured as the distance between the points of maximum lateral displacement of the ciliary tip (Figure 3d). The cilia of Dpcd−/− mice exhibited a weak bend during the recovery stroke and were less extended during the effective stroke (Figure 4a; Movies S3 and S4). For quantitative analysis, we examined alterations in the ciliary curvature during one beating cycle (Figure 4b). Dpcd+/+ cilia revealed a higher curvature during the recovery stroke and a negative value during the effective stroke. However, the ciliary curvature in Dpcd−/− mice did not demonstrate such dramatic alterations during the beating cycle (Figure 4c, in each group, 10 cilia were analysed using 5 mice). Then, because differences in cilia length and number might affect flow velocity, we captured scanning electron microscope (SEM) images of the lateral ventricular walls (Figure 4d). At low magnification (300×), numerous cilia were observed on the lateral ventricular walls in both Dpcd+/+ and Dpcd−/− mice. In the high-magnification images (5000×), ciliary length could be roughly estimated and was approximately 8 μm in both Dpcd+/+ and Dpcd−/− mice. However, because the images were taken at an angle, accurate measurement of ciliary length was performed using immunostained images, as described later.
2.3 Motile Ependymal Cilia in Dpcd−/− Mice Demonstrated a Partial IDA Defect
Next, we compared the internal structures of motile cilia using TEM to elucidate the cause of aberrant ciliary beating in the Dpcd−/− mice. TEM images of the ependymal cilia in Dpcd−/− mice revealed lower electron densities of IDA (Figures 5a and S1), suggesting that some IDAs in Dpcd−/− mice are missing. Immunofluorescence microscopy of paraffin sections from Dpcd+/+ and Dpcd−/− mice showed that dynein axonemal heavy chains (DNAH) 5 in ODA were similarly stained in the cilia (Figure 5b). This suggests that the ODA structure in Dpcd−/− mice was preserved. Seven distinct DNAH constitute the ciliary IDA. Immunofluorescence microscopy of paraffin sections showed that DNAH1, 6 and 12 of IDA were slightly less intensely stained in the Dpcd−/− mice (Figure 5c–e). However, in paraffin sections, the cilia overlapped, making it difficult to compare the fluorescence intensity of DNAH accurately. Therefore, we isolated the cilia and stained them to prevent overlap, allowing for a more accurate comparison of fluorescence intensity.

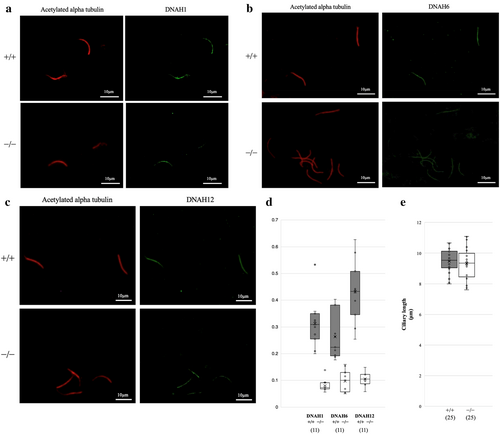
Immunofluorescence microscopy showed that the cilia isolated from the ependymal cells were weakly stained by anti-DNAH1, 6 and 12 antibodies (Figure 6a–c, in each group, 2 mice were used to analyse 11 cilia). In Dpcd−/− mice, the fluorescence intensity ratio of DNAH (1, 6 and 12) to acetylated tubulin was approximately one-third that in Dpcd+/+mice (Figure 6d). These findings suggest that IDAs are present in Dpcd−/− mice; however, their levels are substantially lower in the ependymal cilia of Dpcd+/+mice. In the immunostaining shown in Figure 5b–e, cilia in Dpcd−/− mice appeared shorter. Given that ciliary length could potentially influence CSF flow velocity, we compared the lengths of isolated cilia using immunostaining images for acetylated tubulin. No significant difference was observed in the average ciliary length between Dpcd+/+ and Dpcd−/− mice (Dpcd+/+ vs. Dpcd−/−: 9.47 ± 0.72 vs. 9.32 ± 1.06 μm, p = 0.57) (Figure 6e, in each group, 6 mice were used to analyse 25 cilia).
3 Discussion
Dpcd is one of the genes causing PCD (Kobayashi et al. 2002; Mao et al. 2024; Vogel et al. 2012; Zariwala et al. 2004). The ependymal cilia of Dpcd−/− mice become immotile and cause hydrocephalus owing to the lack of IDAs (Kobayashi et al. 2002). Herein, we found that the ependymal cilia of Dpcd−/− mice were not immotile but exhibited abnormal waveforms because of partial defects in IDAs, in contrast to a previous report. Recent studies have suggested that DPCD functions as an adaptor for the R2TP complex, a chaperone responsible for the assembly of dynein heavy chains (DHCs) and that the R2TP–DPCD complex promotes ciliogenesis by regulating Akt signalling (Dos Santos Morais et al. 2022; Mao et al. 2024). Our findings indicate that DPCD is particularly involved in the assembly of IDA.
Ependymal cell production in mice occurs during embryonic Days 14–16, and the assembly of ependymal cilia begins approximately 1 week following birth (Spassky et al. 2005). Ciliary motility in Dpcd−/− mice may be involved in the exacerbation of hydrocephalus because hydrocephalus worsens after cilia are formed.
ODA and IDA play distinct roles in ciliary motility. ODA plays a role in elevating beat frequency, whereas IDA is crucial in determining the waveform and producing bending. Therefore, aberrant IDAs can result in abnormal ciliary waveforms. We demonstrated that the ependymal cilia of the Dpcd−/− mice lack a part of IDAs and beat with decreasing amplitude and an abnormal waveform, which agrees with previous studies on the Chlamydomonas flagella (Brokaw and Kamiya 1987; Neesen et al. 2001; Porter and Sale 2000; Yamamoto et al. 2021).
Chlamydomonas IDAs contain one two-headed dynein (IDA species fα/fβ) and six single-headed dyneins (IDA species a/b/c/d/e/g), and IDA species a, b, c, d, e and g contain DHC 6, 5, 9, 2, 8 and 7, respectively (Kamiya and Yagi 2014; Yamamoto et al. 2021). In mammals, IDAs contain eight heavy chain types called DNAH, and their abnormalities result in ciliary motility disorders and PCD (Ben Khelifa et al. 2014; Li et al. 2016; Zhang et al. 2019). In the ependymal motile cilia of the Dpcd−/− mice, the amounts of DNAH1, 6 and 12 were markedly decreased, suggesting that Dpcd is involved in multiple DNAH formations. All of these DNAHs are orthologs of those in the single-headed Chlamydomonas IDAs; DNAH1, 6 and 12 correspond to d (DHC 2), g (DHC 7) and a/b/c/e (DHC 6/5/9/8), respectively (Kamiya and Yagi 2014). Although multiple DNAHs of IDAs likely have distinct functions in ciliary motility, no clear role in ciliary motility has been elucidated, except that two-headed IDAs are involved in regulating ciliary motility during phototaxis (King and Dutcher 1997; Okita et al. 2005).
Herein, we examined the curvature of motile cilia during a single stroke to compare waveforms in Dpcd+/+and Dpcd−/− mice. Dpcd+/+ mice demonstrated negative curvature values during the effective stroke, whereas Dpcd−/− mice exhibited minimal alterations in curvature between the effective and recovery strokes (Figure 2f). In efficient ciliary movement, the cilia greatly bend to reduce the resistance to CSF flow during the recovery stroke, and the cilia greatly stretch to flush the CSF during the effective stroke. Therefore, the ciliary movement observed in Dpcd−/− mice was less efficient than that in Dpcd+/+mice. This characteristic ciliary movement in Dpcd−/− mice was caused by a partial deficit in IDA in ependymal cells. This suggests that ciliary amplitude regulation by single-head dynein species is crucial for normal CSF.
A known mutation that causes the loss of IDA in motile cilia is the coiled-coil domain containing 39 (Ccdc39) mutation (Abdelhamed et al. 2018). In mice with the Ccdc39 mutation, most motile cilia are immotile (Abdelhamed et al. 2018). In contrast, in Dpcd mutants, although abnormalities in beat amplitude and waveform were observed, ciliary motility was still present. This difference may result from whether the IDA is completely lost or only partially deficient.
This study had some limitations. First, the CSF flow velocity was measured using the sliced brain, which differed from the in vivo CSF environment. Second, it remains unclear whether the DNAH amounts other than DNAH1, 6 and 12 are affected by defects in Dpcd. Further detailed investigation of ciliary structures could be conducted using cryo-electron tomography to observe isolated cilia.
4 Materials and Methods
4.1 Animals, Dpcd Knockout Mice Generation and Genotyping
All methods were conducted in accordance with the relevant guidelines and regulations for the care and use of laboratory animals and were approved by the Animal Care and Use Committee of the Nagoya University Graduate School of Medicine, which approved all animal experiments (Approval No: M230146-001). In addition, all methods were performed in accordance with the ARRIVE guidelines. Euthanasia procedures were performed using cervical dislocation. All mice were maintained under a 12/12 h light/dark cycle and provided with food and water ad libitum. C57B6J/129 (Dpcd) mice were used as the ciliary mutants. The Dpcd+/− Osaka University provided mice. Adult Dpcd+/− mice were mated, and newborns were divided into Dpcd+/+, Dpcd+/− and Dpcd−/− mice according to polymerase chain reaction (PCR) results. Genotyping was performed via PCR using the following primers:
Primer 1 (P1): 5′-TTAGAAAACAAGGACCTGGGCTGG-3′.
Primer 2 (P2): 5′-ATTCGTCATCTGGGATCCATGCAG-3′.
Primer 3 (P3): 5′-GGGTGGGGTGGGATTAGATAAATG-3′.
Four-week-old mice were used in all experiments.
4.2 MRI
Mice were sedated using inhalation anaesthesia (isoflurane 0.5%–3%), and images were taken using a 3 Tesla MRI (MRS 3000 Benchtop MRI Systems, MR Solutions, UK). The MRI was performed using coronal slices with a thickness of 1.1 mm per image.
4.3 Analysing the Flow Velocity of the CSF
Immediately following dissection, the ependymal cilia retained their motor function and created CSF flow. Brain sections, including the lateral ventricle, were cut to a thickness of approximately 1 mm using a razor. A solution with microspheres (Polybead Black Dyed Microspheres 10.0 μm, Polyscience, USA), which was diluted 100-fold with phosphate-buffered saline (PBS), was injected using a 500 μL pipette into the lateral ventricle of the brain section on a dish. Movies were captured using a stereo microscope (M165C, Leica, Germany) to record the bead trajectory. The flow velocity was measured after the surrounding microspheres stopped; thus, the flow velocity owing to the injected liquid was negligible. Measurements were taken within 15 min following dissection, given that the ciliary movements worsened over time. The movies were analysed using ImageJ (Schneider et al. 2012) plugin ‘Manual Tracking’ (Fabrice Cordelières, Institut Curie). The CSF flow velocity was calculated only for the microspheres that flowed along the lateral ventricle wall to better reflect CSF flow because of the motile cilia. The average velocity was calculated and plotted for each bead.
4.4 Recording Ependymal Ciliary Motility
Ependymal ciliary motility was assessed according to the method described by Sasaki et al. (2019). Brains were collected from mice and trimmed to expose the lateral ventricle ependyma in the DH10 culture medium. Tissues were cut into 150-μm-thick slices using a slicer (Linear Slicer PRO7, DOSAKA EM, Japan). The samples were fixed on a glass slide (MICRO SLIDE GLASS S1111, Matsunami Glass, Japan) within a chamber constructed using a plastic tape. The waveforms of the motile cilia were observed under a UPlan FL 40× objective (Olympus, Japan) using a BX51 phase-contrast microscope (Olympus). A high-speed camera obtained video at 200 fps (HAS-220, DITECT Co., Japan). The ciliary amplitude was measured using ImageJ's Manual Tracking plugin by tracing the trajectory of the ciliary tip in the movies and calculating the distance between the points of maximum lateral displacement. The frequency was analysed using Cilia FA of ImageJ (Smith et al. 2012).
4.5 Analysis of Ciliary Waveform and Ciliary Curvature
The movies were converted into .tiff images using ImageJ. Ten images were obtained for each ciliary beat stroke at equal intervals. The images were placed in PowerPoint (Microsoft, USA) slides, and the shape of the motile cilia was traced and overdrawn to show changes during one beat cycle. The ciliary curvature was defined as the reciprocal of the radius of the inscribed circle; that is, the closer the curvature was to 0, the closer the waveform of the cilia was to a straight line. The direction of CSF flow was set as a positive value, and the opposite side was set as a negative value (Inaba and Shiba 2018). One round trip from the recovery stroke to the effective stroke was divided into 10 equal parts, and the curvature was calculated based on the waveform. Waveform images and inscribed circles were pasted in PowerPoint, and the radii of the inscribed circles and curvatures were calculated. Subsequently, a curvature graph between the recovery stroke and effective stroke in chronological changes was created.
4.6 TEM
Samples were fixed in 2.5% glutaraldehyde for 24 h at 4°C. After washing with 0.1 M PBS on ice, the samples were post-fixed in 2% OsO4 at 25°C for 3 h, dehydrated through a graded ethanol series (50%–100%), substituted with propylene oxide, and embedded in resin. Samples were cut to a 70 nm thickness using an ultramicrotome (UC7k, Leica, Germany) and mounted on grids. The samples were subsequently stained with 7% uranyl acetate for 20 min and with Reynolds lead staining for 2 min, followed by observation under a JEM-1400Plus transmission electron microscope (JEOL Ltd., Japan).
4.7 SEM
Samples were fixed and post-fixed using the same protocol as for TEM. They were then dehydrated in a graded ethanol series (50%–100%) and replaced with tert-butanol before being frozen. Subsequently, the samples were freeze-dried using a t-butanol freeze dryer (VFD-21S, Vacuum Device, Japan), mounted on aluminium stubs and coated with osmium using an osmium plasma coater (NL-OPC80NS, Nippon Laser & Electronics, Japan). The samples were then observed using a SEM (JSM-7610F, JEOL).
4.8 Paraffin-Embedded Samples
Perfusion fixation was performed to prepare the paraffin-embedded samples. Mice were anaesthetised by intraperitoneal administration of butorphanol tartrate, midazolam and dexmedetomidine hydrochloride at 5, 4 and 0.3 mg/kg, respectively. The heart was exposed through the chest of the mouse. Following the incision of the right atrial appendage, the left ventricle was punctured with a 26-gauge needle, and PBS was slowly injected. After the drainage fluid from the right atrial appendage changed from blood to PBS, 4% paraformaldehyde was slowly injected. Mouse brains were removed and placed in a 4% paraformaldehyde solution overnight. The fixed brain was cut to approximately 5 mm in thickness using a razor blade and put in a cassette. The tissues were then embedded in paraffin using an automated embedding machine (VIP6 AI-J0; Sakura Finetek Japan Co., Japan).
4.9 Haematoxylin and Eosin Staining
The paraffin-embedded samples were sliced to a 5 μm thickness and mounted on glass slides (MAS-03, Matsunami Glass). The samples were deparaffinised using three changes of xylene for 5 min, rehydrated using two changes of 100% ethanol for 5 min, 90% ethanol for 5 min and 80% ethanol for 5 min and subsequently washed with distilled water. A haematoxylin and eosin staining kit (ScyTek Laboratories Inc., USA) was used. The samples were stained with haematoxylin for 5 min and eosin for 3 min. The samples were subsequently washed with distilled water and dehydrated with 80% ethanol for 1 min, 100% ethanol for 3 min twice and xylene for 3 min three times. The samples were then sealed using coverslips.
4.10 Immunofluorescence Staining of Paraffin Sections
Samples were deparaffinised and hydrated using the same procedure for the haematoxylin and eosin staining. The samples were heated for antigen retrieval in sodium citrate buffer (10 mM, pH 6.0) using a microwave at 95°C for 20 min. Endogenous peroxidase was blocked using 3% H2O2 in methanol for 10 min at RT. The samples were subsequently washed with 0.05% Tween 20. They were blocked using Dako Antibody Diluent (Dako, Denmark) for 10 min at RT and incubated in primary antibody diluted in blocking solution overnight at 4°C. The following primary antibodies were used: rabbit polyclonal anti-DPCD antibody (1:50; Proteintech, USA), rabbit polyclonal anti-DNAH5 antibody (1:50; St. John's Laboratory, UK), goat polyclonal anti-DNAH1, DNAH6, DNAH12 antibodies (1:50; Santa Cruz Biotechnology Inc., USA) (Jiang et al. 2021) (Figure S2) and mouse monoclonal acetylated α-tubulin antibody (1:100; Sigma-Aldrich, USA). The samples were incubated with secondary antibodies (Alexa Fluor 488 and 546; Invitrogen) for 1 h at 25°C. Cell nuclei were stained using a mounting medium with 4′,6-diamidino-2-phenylindole (DAPI) (VECTASHIELD mounting medium with DAPI, Vector Laboratories, USA). Samples were covered with a coverslip and observed under a BZ-X710 microscope (Keyence, Japan).
4.11 Isolation of Cilia
Cilia isolation was conducted using the previously reported method (Mizuno et al. 2024). Mice were anaesthetised by intraperitoneal administration of butorphanol tartrate, midazolam and dexmedetomidine hydrochloride at 5, 4 and 0.3 mg/kg, respectively. Following euthanasia, the mouse brains were removed and washed with PBS. The anterior and posterior ends of the lateral ventricle were cut to expose the lateral ventricles, and the choroid plexus was removed from the lateral ventricle. The brain was put in the solution (1000 μL of PBS containing 1 mM β-mercaptoethanol and 0.1% Triton X-100), and the 500 μL pipette tip was inserted carefully into the lateral ventricle and pipetted 25 times. The solution was pipetted 20 times using a 26-gauge needle and centrifuged (3000 rpm at 4°C for 5 min). Next, the supernatant of the solution was collected and ultracentrifuged (100,000 × g at 4°C for 60 min) using the 27% and 30% OptiPrep. The solution between the 27% and 30% OptiPrep layers was collected for the sample and diluted with PBS to a total volume of 3.5 mL. The sample underwent ultracentrifugation again (100,000 × g at 4°C for 30 min), and the resulting pellet was collected. Subsequently, it was diluted to 20 μL with PBS.
4.12 Immunofluorescence Staining of Isolated Cilia
The solution containing cilia isolated from the ependymal cells was dropped onto an adhesive glass slide and kept at 25°C for 10 min. Subsequently, the samples were washed five times for 2 min with PBS and then fixed with 4% paraformaldehyde at 25°C for 30 min. The cells were then washed five times for 2 min with PBS. Next, PBS containing 1% NP-40 Surfact-Amps Detergent Solution (Thermo Fisher Scientific, Japan) was dropped onto the slide, incubated for 30 min and washed again five times for 2 min with PBS. The sample was blocked with Antibody Diluent ab64211 (Abcam, UK) at 25°C for 2 h, and then they were incubated in primary antibody diluted in blocking solution overnight at 4°C. The 50-fold diluted goat polyclonal anti-DNAH1, DNAH6 and DNAH12 antibodies (Santa Cruz Biotechnology Inc.) and 100-fold diluted mouse monoclonal acetylated α-tubulin antibody (Sigma-Aldrich) were used as primary antibodies. Subsequently, the sample was washed five times for 2 min with PBS containing 0.2% NP-40 solution. The cells were incubated with secondary antibodies (Alexa Fluor 488 and 546; Invitrogen) for 1 h at 25°C. After the sample was washed again five times for 2 min with PBS containing 0.2% NP-40 solution, coverslips were placed on the sample using the mounting medium (VECTASHIELD mounting medium with DAPI, Vector Laboratories). A fluorescence microscope (BZ-X710; Keyence, Osaka, Japan) was used to assess the samples. Samples were photographed under the same conditions (magnification, exposure time and aperture). The fluorescence intensity ratio of acetylated α-tubulin to DNAH per cilium was calculated and tabulated as box-and-whisker plots with Excel (Microsoft) to compare the expression levels of each DNAH in the Dpcd+/+ and Dpcd−/− mice.
4.13 Measurement of Ciliary Length
Immunofluorescence images of isolated cilia stained for acetylated tubulin were analysed in ImageJ using the segmented line tool to measure ciliary length.
4.14 Statistical Analyses
Data in the bar graphs was expressed as means ± standard deviation. The boxplot data are medians, 25th and 75th percentiles, ranges and outliers. The means of the two experimental groups were compared with Welch's t-test using R (The R Foundation for Statistical Computing, Vienna), and the differences were deemed statistically significant at p < 0.05.
Author Contributions
Taiki Yamamoto and Kazuhito Takeuchi wrote the manuscript. Yuichi Nagata, Akihiro Mizuno, Hideyuki Harada, Takayuki Ishikawa, Sachi Maeda and Ryuji Yanase prepared the figures. All the authors reviewed the manuscript.
Acknowledgements
We thank Hiroshi Hamada (Graduate School of Frontier Biosciences, Osaka University) for providing Dpcd knockout mice and Koji Itakura (Nagoya University) for technical support. This work was supported by The Japan Society for the Promotion of Science KAKENHI (Grant Number 17K17792 to KT, JP16H06280 and 22K12780).
Conflicts of Interest
The authors declare no conflicts of interest.
Open Research
Data Availability Statement
The data that support the findings of this study are available from the corresponding author upon reasonable request.


